. 2019 Oct 22:10:2493.
doi: 10.3389/fimmu.2019.02493. eCollection 2019.

NKT-Like (CD3+CD56+) Cells in Chronic Myeloid Leukemia Patients Treated With Tyrosine Kinase Inhibitors

Affiliations

NKT-Like (CD3+CD56+) Cells in Chronic Myeloid Leukemia Patients Treated With Tyrosine Kinase Inhibitors

Jani-Sofia Almeida et al. Front Immunol. .

Abstract

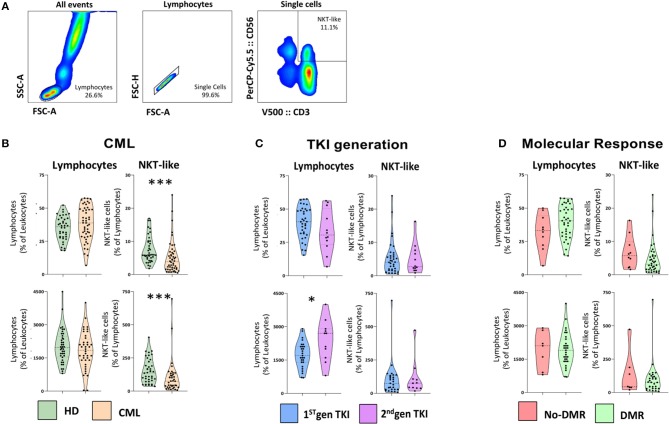
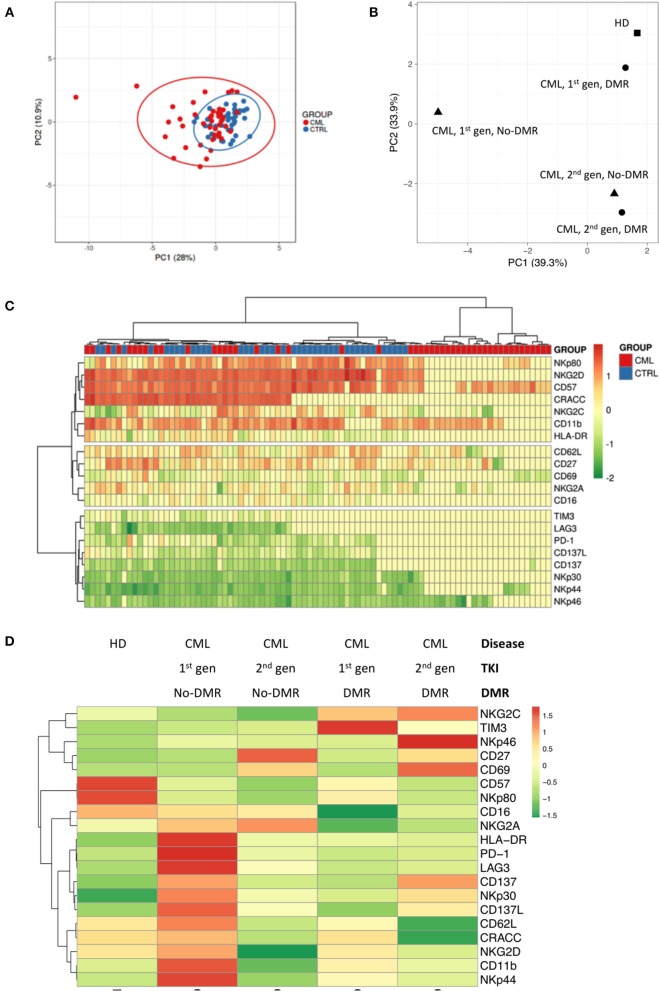
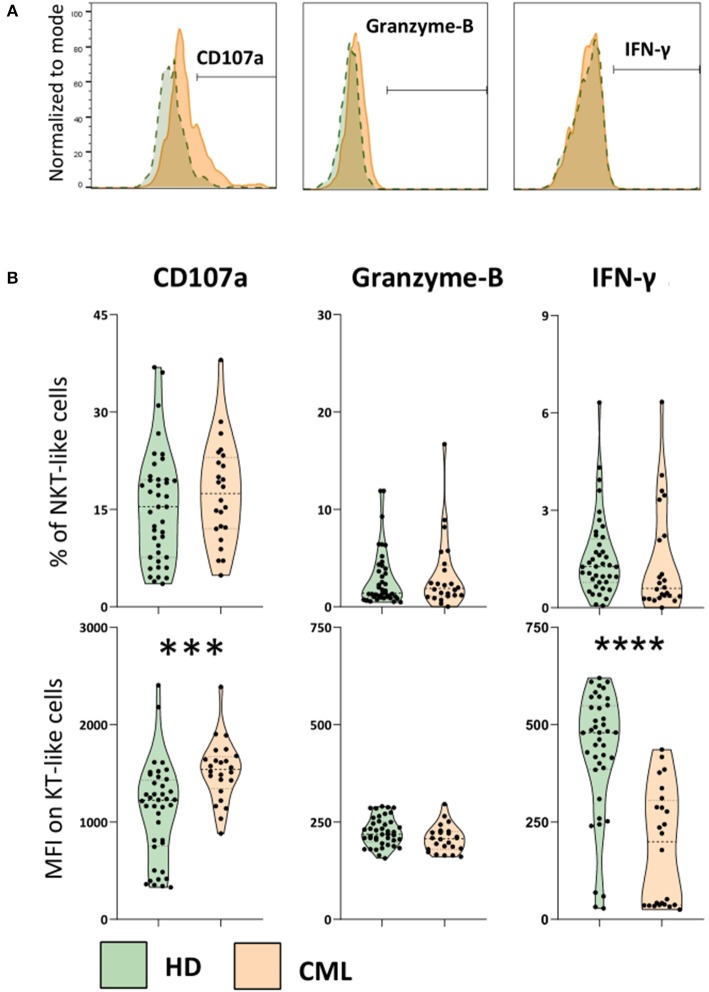
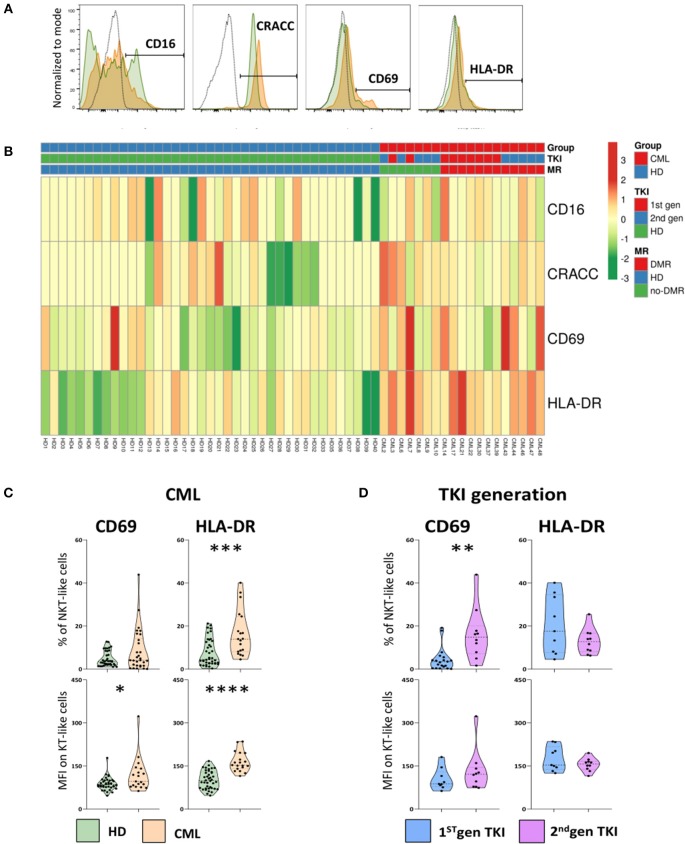
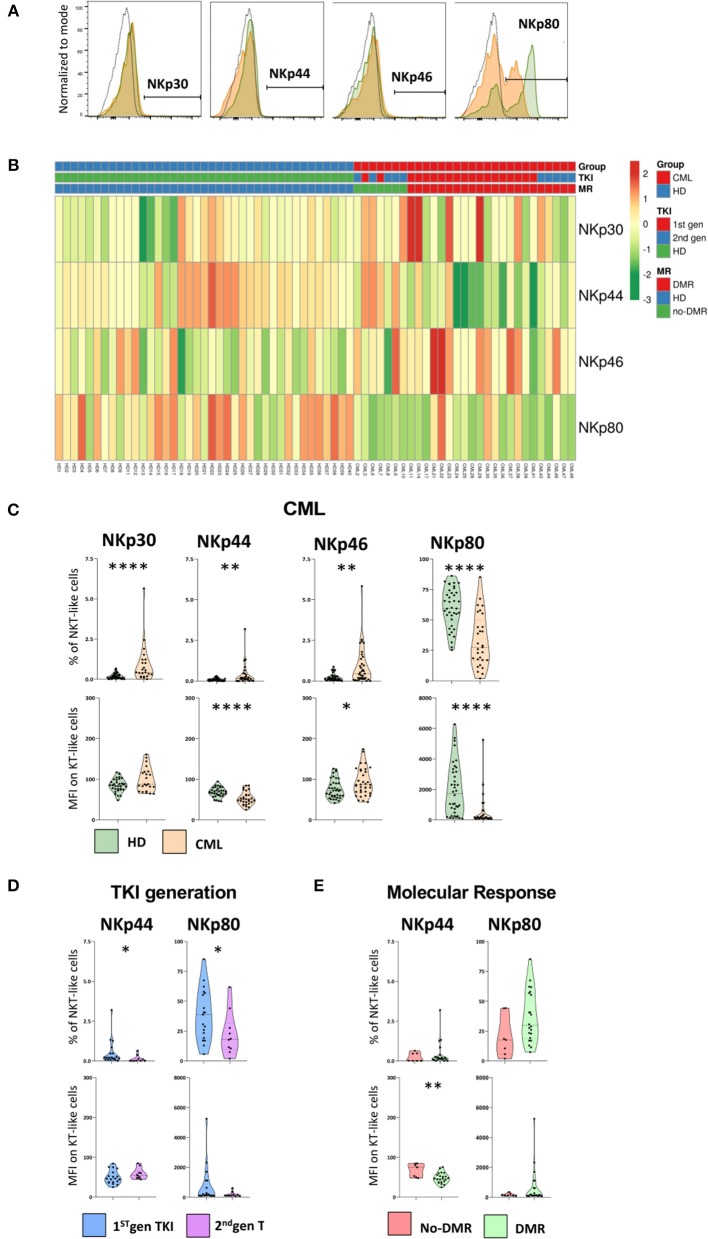
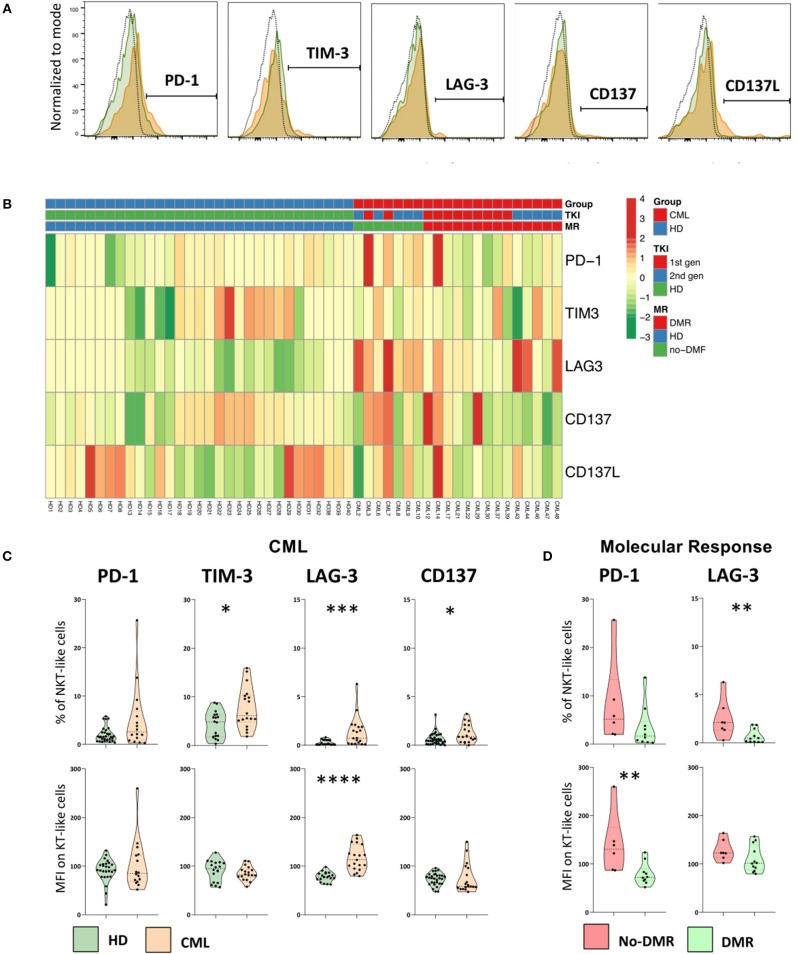
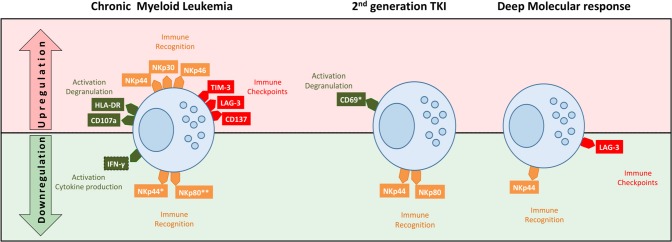
Therapy with Tyrosine Kinase Inhibitors (TKI) aiming stable deep molecular response is the gold standard to treat Chronic Myeloid Leukemia (CML). NKT-like cells (CD3+CD56+) combine characteristics of T and NK cells. The physiopathological role of these cells remains unknown although the literature refers their association with inflammation, autoimmune diseases, and cancer. Since the information regarding the role of NKT-like cells in CML is rare, we aimed at the characterization of these cells in CML patients treated with TKIs. Peripheral blood NKT-like cells from 48 CML patients and 40 healthy donors were analyzed by multiparametric flow cytometry. Functional tests consisting of co-culture with leukemic target cells (K562 cell line) were used to measure degranulation and cytokine production. Our results revealed that NKT-like cells are decreased in treated CML patients, although they present increased expression of activation markers (CD69 and HLA-DR), increased degranulation (CD107a) and impaired IFN-γ production. Significantly alterations on the expression of tumor recognition (NCRs and NKp80), and immune regulation receptors (LAG-3, TIM-3, and CD137) by NKT-like cells were observed in CML patients. Second generation TKIs increased cell activation (CD69) and decreased expression of NKp44 and NKp80 by NKT-like cells from CML patients when compared to Imatinib. CML patients that achieved deep molecular response (MR4.5) presented downregulation of NKp44 and LAG-3. Further studies are needed to clarify the role of these cells as biomarkers of therapy response and also to evaluate their value for discrimination of better candidates for sustained treatment-free remission after TKI discontinuation.

Keywords: NKT-like cells; chronic myeloid leukemia; immune checkpoints; natural cytotoxicity receptors; tyrosine kinase inhibitors.


Figures

Figure 1
Figure 1
NKT-like cells are decreased in treated CML patients. Heparinized fresh whole blood samples were stained with extracellular antibodies and analyzed by multiparametric flow cytometry. (A) Gating strategy to identify NKT-like population. From left to right, gate on lymphocytes, followed by single cells selection and NKT-like identification (CD3+CD56+). (B) CML vs. HD—Relative and absolute frequency of lymphocytes and NKT-like cells in CML patients (n = 48) and HD (n = 40). (C) TKI generation—Relative and absolute frequency of lymphocytes and NKT-like cells in 1st (n = 36) and 2nd TKI generation CML patients (n = 12). (D) Molecular Response—Relative and absolute frequency of lymphocytes and NKT-like cells in CML patients that achieved deep molecular response (DMR; n = 38) and with no DMR (No-DMR; n = 10). Mann Whitney U-test was used for statistical analysis and the charts represent the mean ± standard deviation for HD (n = 40) and CML (n = 48) group. HD, Healthy donors; CML, Chronic Myeloid Leukemia patients; TKI, Tyrosine Kinase Inhibitor; 1st gen. TKI, 1st generation TKI CML patients; 2nd gen. TKI, 2nd generation TKI CML patients; DMR, deep molecular response; no-DMR, without deep molecular response; p-value <0.05*, <0.01**, <0.001***, or <0.0001****.
Figure 2
Figure 2
Different NKT-like cell receptor repertoire patterns in CML patients according to TKI generation and molecular response in CML. Heparinized fresh whole blood samples were stained with extracellular antibodies and analyzed by multiparametric flow cytometry. (A) Principal component analysis for the frequency of NKT-like cells expressing CD11b, CD27, CD57, CD62L, CD16, CRACC, CD69, HLA-DR, NKG2A, NKG2C, NKG2D, NKp30, NKp44, NKp46, NKp80, PD-1, TIM-3, LAG-3, CD137, and CD137L in CML patients (n = 48) and HD (n = 40). (B) Principal component analysis for the density (MFI) of CD11b, CD27, CD57, CD62L, CD16, CRACC, CD69, HLA-DR, NKG2A, NKG2C, NKG2D, NKp30, NKp44, NKp46, NKp80, PD-1, TIM-3, LAG-3, CD137, and CD137L expressed by NKT-like cells in HD (n = 40) and CML patients (n = 48) according to TKI generation [1st (n = 36) or 2nd (n = 12)] and molecular response [DMR (n = 38) or No-DMR (n = 10)]. (C) Heatmap for the density of CD11b, CD27, CD57, CD62L, CD16, CRACC, CD69, HLA-DR, NKG2A, NKG2C, NKG2D, NKp30, NKp44, NKp46, NKp80, PD-1, TIM-3, LAG-3, CD137, and CD137L receptors expressed by NKT-like cells in HD and CML patients. (D) Heatmap for the average density of CD11b, CD27, CD57, CD62L, CD16, CRACC, CD69, HLA-DR, NKG2A, NKG2C, NKG2D, NKp30, NKp44, NKp46, NKp80, PD-1, TIM-3, LAG-3, CD137, and CD137L receptors expressed by NKT-like cells in HD and CML patients according to TKI generation and molecular response. HD, Healthy donors; CML, Chronic Myeloid Leukemia patients; TKI, Tyrosine Kinase Inhibitor; 1st gen. TKI, 1st generation TKI CML patients; 2nd gen. TKI, 2nd generation TKI CML patients; DMR, deep molecular response; no-DMR, without deep molecular response.
Figure 3
Figure 3
Increased degranulation and decreased IFN-γ production by NKT-like cells in treated CML patients. PBMCs isolated from heparinized fresh whole blood were incubated with and without the K562 cell line (effector:target ratio 25:1), in the presence of Brefeldin A, for 4 h in CO2 incubator, at 37°C. At the end of incubation cells were stained for cell membrane receptors and intracellular targets to be analyzed by multiparametric flow cytometry. (A) Representative histograms of the cut-off for positive NKT-like cells for each parameter. From left to right: CD107a expression, Granzyme-B and IFN-γ intracellular production from CML patients (orange) and HD group (green). (B) Top: Frequency of CD107a NKT-like cells, intracellular accumulation of Granzyme-B and IFN-γ intracellular production against K562 cell line. Bottom: Corresponding MFI of CD107a, Granzyme-B and IFN-γ parameters. Graphs represent data from HD (n = 40) and CML (n = 24) samples as mean ± standard deviation. Paired t-test was used to compare between groups. HD, Healthy donors; CML, treated CML patients; MFI, Median Intensity Fluorescence; p-value <0.05*, <0.01**, <0.001***, or <0.0001****.
Figure 4
Figure 4
Increased activation of NKT-like cells in treated CML patients. Heparinized fresh whole blood samples were stained with extracellular antibodies and analyzed by multiparametric flow cytometry. (A) Representative histograms relative to CD16, CRACC, CD69, and HLA-DR expression by NKT-like cells. The dashed black lines represent the isotype control, the fulfilled green lines represent the HD group and the fulfilled red lines represent the CML group. (B) Heatmaps for the frequency of NKT-like cells expressing CD16, CRACC, CD69, and HLA-DR in HD (n = 40) and CML patients (n = 48) according to TKI generation [1st (n = 36) or 2nd (n = 12)] and molecular response [DMR (n = 38) or No-DMR (n = 10)]. (C) Relative frequencies and MFI of CD69 and HLA-DR in the NKT-like population from CML patients (n = 19) and HD (n = 38 and n = 40, respectively). (D) Relative frequencies and MFI of CD69 and HLA-DR in the NKT-like population according to 1st generation TKI (n = 20 and n = 9, respectively) and 2nd generation TKI (n = 10). Mann Whitney U-test was used for statistical analysis and the charts represent the mean ± standard deviation. HD, Healthy donors; CML, treated CML patients; TKI, Tyrosine Kinase Inhibitor; 1st gen. TKI, 1st generation TKI CML patients; 2nd gen. TKI, 2nd generation TKI CML patients; MFI, Median Intensity Fluorescence; p-value <0.05*, <0.01**, <0.001***, or <0.0001****.
Figure 5
Figure 5
NCRs and NKp80 are significantly altered on NKT-like cells in CML patients. Heparinized fresh whole blood samples were stained with extracellular antibodies and analyzed by multiparametric flow cytometry. (A) Representative histograms relative to the cut-off for positive NKT-like cells in terms of, from left to right, NKp30, NKp44, NKp46, and NKp80. The dashed black lines represent the isotype control, the fulfilled green lines represent the HD group and the fulfilled red lines represent the CML group. (B) Heatmaps for the frequency of NKT-like cells expressing NKp30, NKp44, NKp46, and NKp80 in HD (n = 40) and CML patients (n = 48) according to TKI generation [1st (n = 36) or 2nd (n = 12)] and molecular response [DMR (n = 38) or No-DMR (n = 10)]. (C) NKp30, NKp44, NKp46 and NKp80 relative frequencies and MFI of NKT-like population from CML patients (n = 23, n = 29, n = 36 and n = 29, respectively) and HD (n = 39, n = 39, n = 39 and n = 38, respectively). (D) Relative frequencies and MFI of NKp44 and NKp80 in the NKT-like population according to 1st gen. TKI (n = 19) and 2nd gen. TKI (n = 10). (E) Relative frequencies and MFI of NKp44 and NKp80 of NKT-like cells from patients without deep molecular response (n = 9) or with deep molecular response (n = 25). Mann Whitney U-test was used for statistical analysis and the charts represent the mean ± standard deviation. HD, Healthy donors; CML, treated CML patients; TKI, Tyrosine Kinase Inhibitor; 1st gen. TKI, 1st generation TKI CML patients; 2nd gen. TKI, 2nd generation TKI CML patients; DMR, deep molecular response; no-DMR, without deep molecular response; MFI, Median Intensity Fluorescence; p-value <0.05*, <0.01**, <0.001***, or <0.0001****.
Figure 6
Figure 6
Immune checkpoints are expressed by NKT-like cells in CML patients and are decreased in patients achieving deep molecular response. Heparinized fresh whole blood samples were stained with extracellular antibodies and analyzed by multiparametric flow cytometry. (A) Representative histograms relative to the cut-off for positive NKT-like cells in terms of, from left to right, PD-1, TIM-3, LAG-3, CD137, and CD137L. The dashed black lines represent the isotype control, the fulfilled green lines represent the HD group and the fulfilled red lines represent the CML group. (B) Heatmaps for the frequency of NKT-like cells expressing PD-1, TIM-3, LAG-3, CD137, and CD137L in HD (n = 40) and CML patients (n = 48) according to TKI generation [1st (n = 36) or 2nd (n = 12)] and molecular response [DMR (n = 38) or No-DMR (n = 10)]. (C) PD-1, TIM-3, LAG-3 and CD137 relative frequencies and MFI of NKT-like population from CML patients (n = 16, n = 18, n = 19 and n = 19, respectively) and HD (n = 32, n = 18, n = 19 and n = 35, respectively). (D) Relative frequencies and MFI of PD-1 and LAG-3 of NKT-like cells from patients without deep molecular response (n = 6 and n = 7, respectively) or with deep molecular response (n = 10 and n = 12, respectively). Mann Whitney U-test was used for statistical analysis and the charts represent the mean and standard deviation. HD, Healthy donors; CML, treated CML patients; DMR, deep molecular response; no-DMR, without deep molecular response; MFI, Median Intensity Fluorescence; p-value <0.05*, <0.01**, <0.001*** or <0.0001****.
Figure 7
Figure 7
Schematic representation of NKT-like cell profiles in treated CML according to TKI generation and deep molecular response. NKT-like cells from CML patients had different patterns of receptor expression associated with function/activation (CD107a, IFN-γ, HLA-DR, and CD69), tumor recognition (NKp30, NKp44, NKp46, and NKp80) and immune regulation (TIM-3, LAG-3, CD137). Second generation TKIs were associated with remarkably activation status (CD69) and downregulation of NKp44 and NKp80. Patients in deep molecular response were associated with downregulation of NKp44 and LAG-3. Top (in red) of the diagram represents upregulation of receptors and the bottom (in green) represent the downregulation of receptors by NKT-like cells.

References

    1. Faderl S, Talpaz M, Estrov Z, O'Brien S, Kurzrock R, Kantarjian HM. The biology of chronic myeloid leukemia. N Engl J Med. (1999) 341:164–72. 10.1056/NEJM199907153410306 - DOI - PubMed
    1. Sawyers CL. Chronic myeloid leukemia. N Engl J Med. (1999) 340:1330–40. 10.1056/NEJM199904293401706 - DOI - PubMed
    1. Lugo TG, Pendergast AM, Muller AJ, Witte ON. Tyrosine kinase activity and transformation potency of bcr-abl oncogene products. Science. (1990) 247:1079–82. 10.1126/science.2408149 - DOI - PubMed
    1. Groffen J, Heisterkamp N. The BCR/ABL hybrid gene. Baillieres Clin Haematol. (1987) 1:983–99. 10.1016/S0950-3536(87)80035-5 - DOI - PubMed
    1. Nowell PC, Hungerford D. A minute chromosome in human chronic granulocytic leukemia. Science. (1960) 142:1497. - PubMed

Publication types

MeSH terms