. 2019 Oct 22:10:1280.
doi: 10.3389/fpls.2019.01280. eCollection 2019.

Bread Wheat With High Salinity and Sodicity Tolerance

Affiliations

Bread Wheat With High Salinity and Sodicity Tolerance

Yusuf Genc et al. Front Plant Sci. .

Abstract

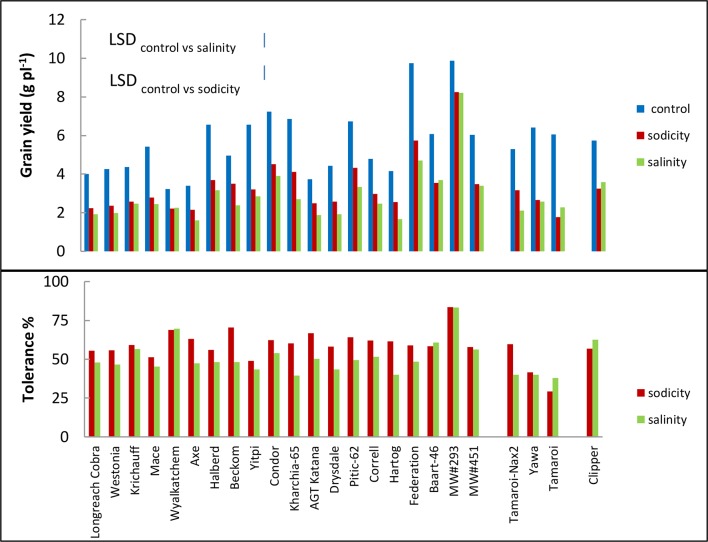
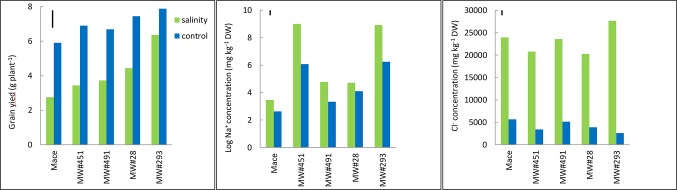
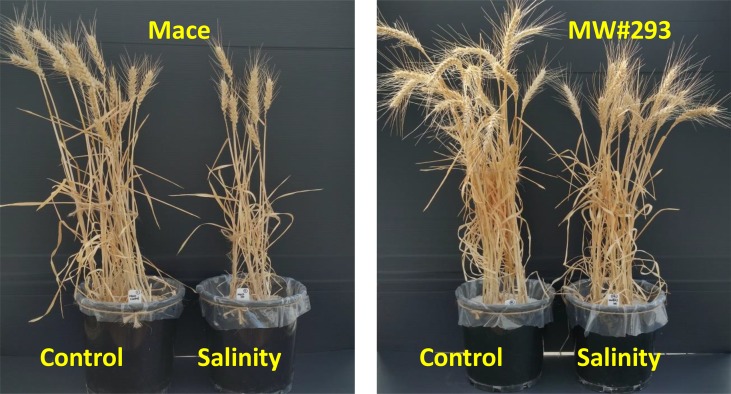
Soil salinity and sodicity are major constraints to global cereal production, but breeding for tolerance has been slow. Narrow gene pools, over-emphasis on the sodium (Na+) exclusion mechanism, little attention to osmotic stress/tissue tolerance mechanism(s) in which accumulation of inorganic ions such as Na+ is implicated, and lack of a suitable screening method have impaired progress. The aims of this study were to discover novel genes for Na+ accumulation using genome-wide association studies, compare growth responses to salinity and sodicity in low-Na+ bread Westonia with Nax1 and Nax2 genes and high-Na+ bread wheat Baart-46, and evaluate growth responses to salinity and sodicity in bread wheats with varying leaf Na+ concentrations. The novel high-Na+ bread wheat germplasm, MW#293, had higher grain yield under salinity and sodicity, in absolute and relative terms, than the other bread wheat entries tested. Genes associated with high Na+ accumulation in bread wheat were identified, which may be involved in tissue tolerance/osmotic adjustment. As most modern bread wheats are efficient at excluding Na+, further reduction in plant Na+ is unlikely to provide agronomic benefit. The salinity and sodicity tolerant germplasm MW#293 provides an opportunity for the development of future salinity/sodicity tolerant bread wheat.

Keywords: chloride; ionic; osmotic; salinity; sodicity; sodium; sodium humate; tolerance.


Figures

Figure 1
Figure 1
Boxplots of leaf Na+ (back-transformed), Cl-, K+, Ca2+ and Mg2+ concentrations (mg kg-1 DW) at heading in 100 bread wheat entries, 12 durum wheat entries and a barley cultivar grown under sodicity (8 g kg-1 Na+-humate) in Experiment 1 (n = 4). See Table S3 for individual responses. The box represents the middle 50% of the distribution (the median is drawn as the solid line within the box) with whiskers extending to the lowest/highest value within 1.5* IQR (Inter-Quartile Range). Values outside this range are plotted separately.
Figure 2
Figure 2
Manhattan plot showing the association signals for leaf Na+ concentration using 100 bread wheat entries grown under sodicity (8 g kg-1 Na+-humate) in Experiment 1 (n = 4). The x-axis indicates the physical location of SNP markers along each wheat chromosome; the y-axis shows the P-value of SNP markers for the association test on a log scale. The horizontal red line indicates the significance threshold (P-value = 8.91e-5). The marker names of SNPs above the threshold are shown.
Figure 3
Figure 3
Relative grain yield (%) (salinity or sodicity tolerance), and best linear unbiased estimates for leaf Na+ and Cl- concentrations in wheat cv. Westonia, Westonia-Nax1, Westonia-Nax2 and Baart-46 under different levels of salinity (left panels) and sodicity applied as Na+ humate (right panels) in Experiment 2 (n = 4). The vertical bars indicate Least Significant Difference test value at P = 0.05 for variety x treatment interaction. See Table S8 for back-transformed Na+ and Cl-concentrations for comparisons with published data.
Figure 4
Figure 4
Relationships of Na+, Cl-, K+, Ca2+ and Ma2+ concentrations (mg kg-1 DW), and grain yield (g plant-1) under control, salinity (100 mM NaCl) and sodicity (8 g kg-1 Na+-humate) in 20 bread wheat entries in Experiment 3 (n = 4) (r = 0.561,df = 18, P < 0.01). MW#293 is shown as an empty circle.
Figure 5
Figure 5
Best linear unbiased estimates for grain yield, and tolerance (grain yield under sodicity or salinity as a percentage of grain yield under control) of 20 bread wheat entries (Triticum aestivum L.), three durum wheat entries (Triticum turgidum subsp durum cv. Tamaroi, Tamaroi-Nax2 and Yawa) and one barley (Hordeum vulgare L. cv. Clipper) in Experiment 3 (n = 4). The vertical bars indicate Least Significant Difference test value at P = 0.05 for variety x treatment interaction. Entries are ordered in ascending order of leaf Na+ concentration.
Figure 6
Figure 6
Best linear unbiased estimates for grain yield, and leaf Na+ and Cl- concentrations at heading in bread wheat cv. Mace, and two low-Na+ (MW#28 and MW#491) and two-high Na+ (MW#293 and MW#451) doubled-haploid lines selected from a cross between Mace and high-Na+ germplasm W4909 (n = 5). Sodium concentration data were transformed to natural logarithms. The vertical bars indicate Least Significant Difference test value at P = 0.05 for variety x treatment interaction. Wheat lines are ordered in ascending order of salinity tolerance (ratio of grain yield under salinity to grain yield under control, expressed as percent).
Figure 7
Figure 7
Representative pots of bread wheat (Triticum aestivum) cv. Mace and doubled-haploid line MW#293 grown under control and salinity (100 mM NaCl) in Experiment 4.

References

    1. Acosta-Motos J. R., Ortuna M. F., Bernal-Vicente A., Diaz-Vivancos P., Sanches-Blanco M. J., Hernandez J. A. (2017). Plant responses to salt stress: adaptive mechanisms. Agronomy 7, 18. 10.3390/agronomy7010018 - DOI
    1. Adem G. A., Roy S. R., Huang Y., Chen Z.-H., Wang F., Zhou M., et al. (2017). Expressing Arabidopsis thaliana V-ATPase subunit C in barley (Hordeum vulgare L.) improves plant performance under saline condition by enabling better osmotic adjustment. Funct. Plant Biol. 44, 1147–1159. 10.1071/FP17133 - DOI - PubMed
    1. Afzal Z., Howton T. C., Sun Y., Mukhtar M. S. (2016). The roles of aquaporins in plant stress responses. J. Dev. Biol. 4, 9. 10.3390/jdb4010009 - DOI - PMC - PubMed
    1. Alavilli H., Awasthi J. P., Rout G. R., Sahoo L., Lee B.-H., Panda S. K. (2016). Overexpression of a Barley Aquaporin Gene, HvPIP2;5 Confers Salt and Osmotic Stress Tolerance in Yeast and Plants. Front. Plant Sci. 7, 1566. 10.3389/fpls.2016.01566 - DOI - PMC - PubMed
    1. Alexander D. H., Lange K. (2011). Enhancements to the ADMIXTURE algorithm for individual ancestry estimation. BMC Bioinformatics 12, 246. 10.1186/1471-2105-12-246 - DOI - PMC - PubMed