. 2019 Sep 25;9(24):7222-7238.
doi: 10.7150/thno.32058. eCollection 2019.

Generation of human induced pluripotent stem cell-derived cardiomyocytes in 2D monolayer and scalable 3D suspension bioreactor cultures with reduced batch-to-batch variations

Affiliations

Generation of human induced pluripotent stem cell-derived cardiomyocytes in 2D monolayer and scalable 3D suspension bioreactor cultures with reduced batch-to-batch variations

Sarkawt Hamad et al. Theranostics. .

Abstract

Human induced pluripotent stem cell derived cardiomyocytes (hiPSC-CMs) are promising candidates to treat myocardial infarction and other cardiac diseases. Such treatments require pure cardiomyocytes (CMs) in large quantities. Methods: In the present study we describe an improved protocol for production of hiPSC-CMs in which hiPSCs are first converted into mesodermal cells by stimulation of wingless (Wnt) signaling using CHIR99021, which are then further differentiated into CM progenitors by simultaneous inhibition of porcupine and tankyrase pathways using IWP2 and XAV939 under continuous supplementation of ascorbate during the entire differentiation procedure. Results: The protocol resulted in reproducible generation of >90% cardiac troponin T (TNNT2)-positive cells containing highly organized sarcomeres. In 2D monolayer cultures CM yields amounted to 0.5 million cells per cm2 growth area, and on average 72 million cells per 100 mL bioreactor suspension culture without continuous perfusion. The differentiation efficiency was hardly affected by the initial seeding density of undifferentiated hiPSCs. Furthermore, batch-to-batch variations were reduced by combinatorial use of ascorbate, IWP2, and XAV939. Conclusion: Combined inhibition of porcupine and tankyrase sub-pathways of Wnt signaling and continuous ascorbate supplementation, enable robust and efficient production of hiPSC-CMs.

Keywords: Human induced pluripotent stem cells; Wnt signaling; ascorbate; cardiomyocytes; differentiation; hiPSCs; iPS cells; regenerative medicine, bioreactor suspension culture; robust method.


Conflict of interest statement

Competing Interests: The authors have declared that no competing interest exists.

Figures
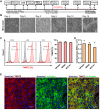
Figure 1
Figure 1
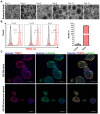
Cardiac differentiation of hiPSCs in a monolayer culture. (A) Workflow of cardiac differentiation of hiPSCs. The numbers above the line represent the differentiation days. hiPSCs were cultured in E8 medium from day -4 to day 0 and in RPMI 1640 medium supplemented with 1× B27 without insulin and 50 μg/mL ascorbate from day 0 to day 18. Culture medium was supplemented with 5 μM ROCK inhibitor from day -4 to day -2, with 8 μM CHIR99021 from day 0 to day 1, and with 5 μM IWP2 and 5 μM XAV939 from day 3 to day 5. (B) Brightfield images of monolayer cultures of differentiating cells at 10X magnification. Scale bars: 100 μm. (C) Left histogram charts show representative flow cytometric analysis of hiPSC-CMs at day 18 of differentiation. Grey histograms represent isotype controls and the red histogram samples stained with TNNT2 antibodies and numbers inside the graphs represent the percentage of TNNT2-positive cells, and right bar chart is flow cytometry data analysis of biological independent replications for NP0040 (n = 6), IMR90 (n = 4) and NP0141 (n = 3) hiPSC-CMs at day 18 of differentiation. (D) Cardiomyocyte yields per cm2 growth area in NP0040, IMR90, and NP0141 hiPSC lines. Data are shown as mean ± SD (n = 6, 4, and 3, respectively). (E) Immunocytochemical analysis of NP0040 hiPSC-CMs that were differentiated on Matrigel-coated cover glass. Cells in monolayer cultures were stained without prior dissociation with antibodies against TNNT2 (red) and α-actinin (green). Nuclei were counterstained with Hoechst 33342 (blue). Scale bars: 100 μm.
Figure 2
Figure 2
The effect of different combinations of small molecules on cardiac differentiation efficiency of hiPSCs. (A) NP0040 hiPSCs were seeded at the initial density 0.6 cells/cm2 and differentiated in a monolayer culture in basal differentiation medium consisting of RMPI 1640 and 1× B27 supplement. In all experimental groups, the cardiac differentiation was induced at day 0 by addition of 8 μM CHIR99021 for 24 h. In all ascorbate containing groups, the ascorbate was present in the medium from day 0 until the end of differentiation. Cells were treated with IWP2 and XAV939 alone or in combination from day 3 to day 5 of differentiation. Flow cytometry analysis was performed at day 18 of differentiation. (A) Cells were stained with isotype (grey histograms) or TNNT2-specific antibodies (red histogram) and the percentage of TNNT2-positive cells in each experimental group is indicated in the panels. (B) Percentages of TNNT2-positive cells in different experimental groups are shown in panel B. (C) Total live cell number (black) and cardiomyocyte number (red) per cm2 growth area. Data in B and C are shown as mean ± SD of six independent biological replicates. Statistics were performed by one-way ANOVA with Bonferroni's multiple comparison post hoc. P < 0.05 was considered as a statistically significant difference.
Figure 3
Figure 3
Effect of the initial hiPSC seeding density on cardiac differentiation. (A) Flow cytometric analysis was carried out at day 18 of differentiation. Left panel histograms show cells in each group stained with isotype (grey histogram) or TNNT2-specific (red histogram) antibodies. Numbers inside the graphs represent the percentage of TNNT2-positive cells (individual, representative measurements), and right panel bar chart shows statistical analysis of the differences in the percentage of TNNT2-positive cells in nine seeding density groups. Data are shown as mean ± SD of five independent biological replicates. Statistical analyses of data were performed by one-way ANOVA with Bonferroni's multiple comparison post hoc. P < 0.05 was considered as a statistically significant difference. (B) Total live cell number (black bars), and cardiomyocyte yield (red bars) per cm2 growth area are shown as mean ± SD of five independent biological replicates. (C) Fitting of average cardiomyocyte yields obtained at different seeding densities to a sigmoidal curve. Data are presented as mean ± SD of five independent biological replicates. Yield max indicates maximal cardiomyocyte yield.
Figure 4
Figure 4
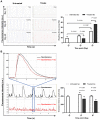
Differentiation of hiPSCs to cardiomyocytes in bioreactor suspension culture using the optimized protocol. (A) Bright field images of cell aggregates formed in a suspension culture of NP0040 hiPSCs from day -4 to day 14 at 10X magnification. Scale bars: 100 μm. (B) Left panel histograms show the fraction of TNNT2-positive cells at day 18 (red), analyzed by flow cytometry in 3 different differentiation experiments. Results of isotype controls are shown in grey. Bar chart represents the fraction of positive cells as mean ± SD of three independent biological replicates (C) Expression of TNNT2 (red), and α-actinin (green) in cardiac clusters at day 18 of differentiation. Nuclei were stained with Hoechst 33342 (blue). Images were obtained with a SP8 Leica confocal microscope. Cardiac cluster were stained as whole mounts (upper images), or dissected into 8 µm slices prior to staining (lower images). Scale bars: 100 μm.
Figure 5
Figure 5
Calcium imaging of control and 10 µM isoproterenol-treated hiPSC-CMs. (A) Beating frequency of hiPSC-CM, left panel shows representative data, and right panel displays statistical analysis of ten measurements of spontaneous contraction frequency of hiPSC-CMs. (B) Calcium transient time to peak on day 20, 30, and 40 time points of the differentiation process, left panel shows representative data, and right panel displays statistical analysis of calcium transients in ten hiPSC-CMs. Statistical analyses of data were performed by Student unpaired t test. P < 0.05 was considered as a statistically significant difference.
Figure 6
Figure 6
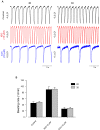
Functional characterization of hiPSC-CMs cultured in 2D and 3D conditions. (A) Typical examples of spontaneously beating signal demonstrating similar positive chronotropy after administration of the β-adrenergic agonist Iso (10 μmol/L) in both culture conditions. Likewise, application of carbachol (10 μmol/L) reduced rhythmic beating activity of the CMs, demonstrating functional expression and integration of β-adrenergic and muscarinic signaling in both 2D and 3D conditions. (B) Bar graph shows no differences between CMs of 2D and 3D. Beating rate was determined using the xCELLigence RTCA Cardio software version 1.0 at threshold 12. Error bars indicate mean ± SD of at least 8 wells (8 technical replicates) of each experiment (n=2).
Figure 7
Figure 7
Optical membrane potential mapping of hiPSC-CMs. (A,B) Action potentials were measured by voltage sensitive dyes at day 25 and 33 of differentiation and (C) action potential parameters were analyzed. (D,E) Optical mappings of excitation spread in layers of hiPSC-CMs at day 25 and 33 and (F) calculation of conduction velocities.
Figure 8
Figure 8
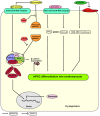
Hypothetic model of signaling pathways involved in the differentiation of hiPSC-CM from mesodermal progenitors. Canonical Wnt signaling releases β-catenin from the axin-GSK3β complex, whereas non canonical Wnt signaling acts via activation of the PKC (protein kinase C) pathway and elevates the cytoplasmic calcium levels. The Axin - GSK3β complex consist of the axin protein and GSK3β (glycogen synthesis kinase three β) together with APC (adenomatosis polyposis coli), CK1 (casein kinase 1) and β-catenin. IWP2: small molecule inhibitor of porcupine pathway; XAV939: small molecule inhibitor of tankyrase pathway; MEK-ERK 1/2: mitogen-activated protein kinase-extracellular-signal regulated kinases 1 and 2; ascorbate: L-ascorbic acid phosphate magnesium n-hydrate.

References

    1. Calvert JW. Chapter 5 - Ischemic Heart Disease and its Consequences A2 - Willis, Monte S. In: Homeister JW, Stone JR, editors. Cellular and Molecular Pathobiology of Cardiovascular Disease. San Diego: Academic Press; 2014. p. 79-100.
    1. Sinnecker D, Dirschinger RJ, Goedel A, Moretti A, Lipp P, Laugwitz K-L. Induced Pluripotent Stem Cells in Cardiovascular Research. In: Nilius B, Amara SG, Gudermann T, Jahn R, Lill R, Offermanns S, et al., editors. Reviews of Physiology, Biochemistry and Pharmacology, Vol 163. Berlin, Heidelberg: Springer Berlin Heidelberg; 2012. p. 1-26. - PubMed
    1. Takahashi K, Tanabe K, Ohnuki M, Narita M, Ichisaka T, Tomoda K. et al. Induction of Pluripotent Stem Cells from Adult Human Fibroblasts by Defined Factors. Cell. 2007;131:861–72. - PubMed
    1. Liu YW, Chen B, Yang X, Fugate JA, Kalucki FA, Futakuchi-Tsuchida A. et al. Human embryonic stem cell-derived cardiomyocytes restore function in infarcted hearts of non-human primates. Nat Biotechnol. 2018;36:597–605. - PMC - PubMed
    1. Laflamme MA, Chen KY, Naumova AV, Muskheli V, Fugate JA, Dupras SK. et al. Cardiomyocytes derived from human embryonic stem cells in pro-survival factors enhance function of infarcted rat hearts. Nat Biotechnol. 2007;25:1015–24. - PubMed

Publication types

MeSH terms