. 2019 Oct 14;9(25):7628-7647.
doi: 10.7150/thno.36277. eCollection 2019.

A self-enforcing HOXA11/Stat3 feedback loop promotes stemness properties and peritoneal metastasis in gastric cancer cells

Affiliations

A self-enforcing HOXA11/Stat3 feedback loop promotes stemness properties and peritoneal metastasis in gastric cancer cells

Chao Wang et al. Theranostics. .

Abstract

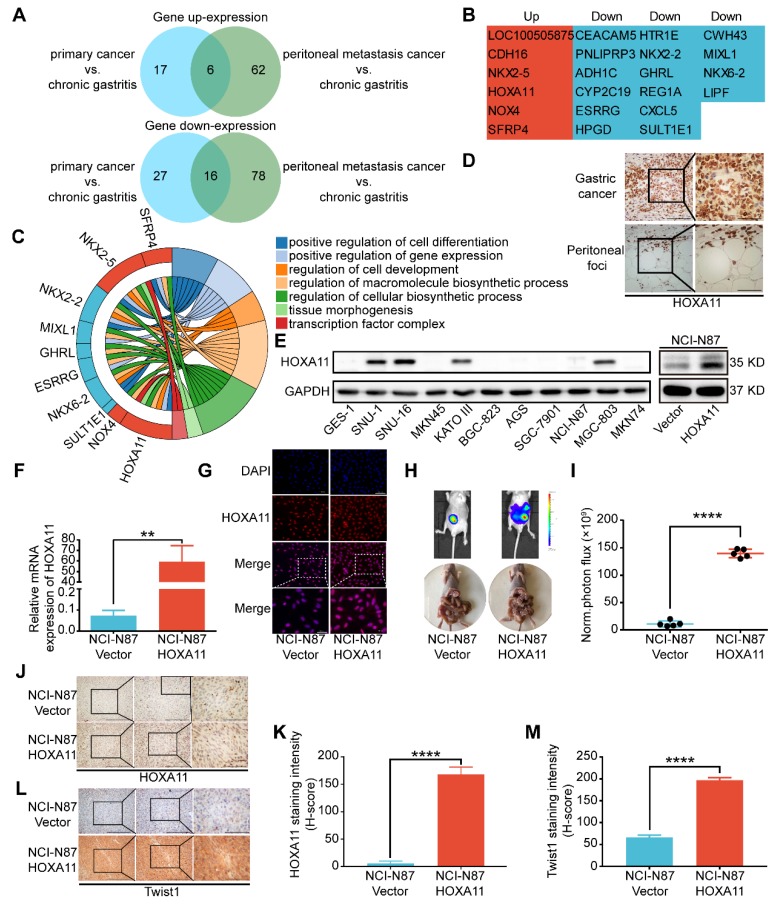
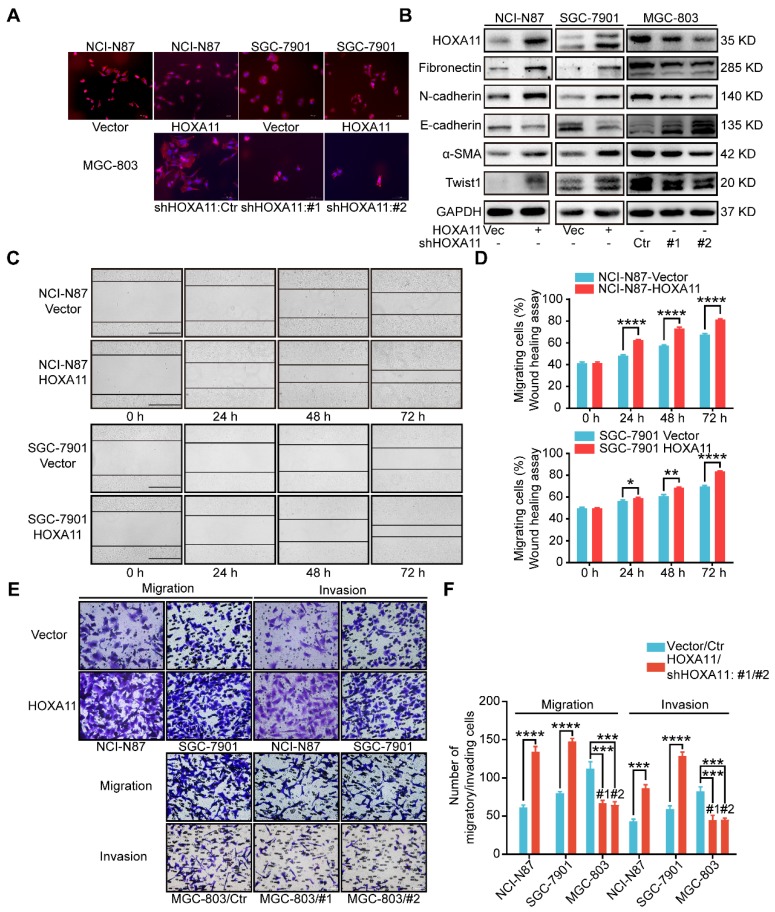
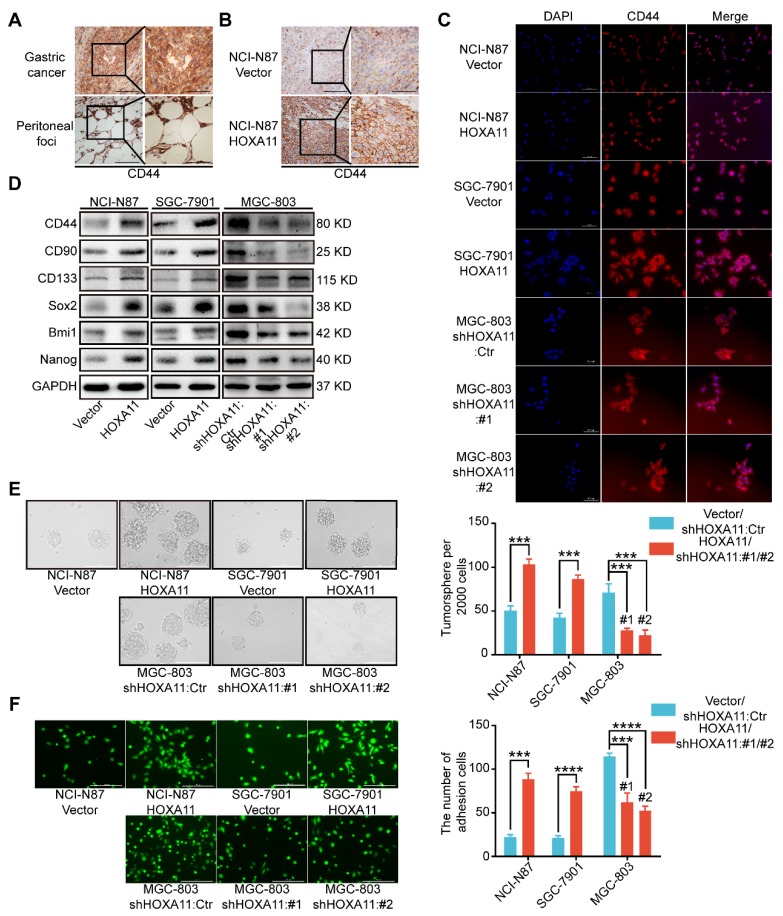
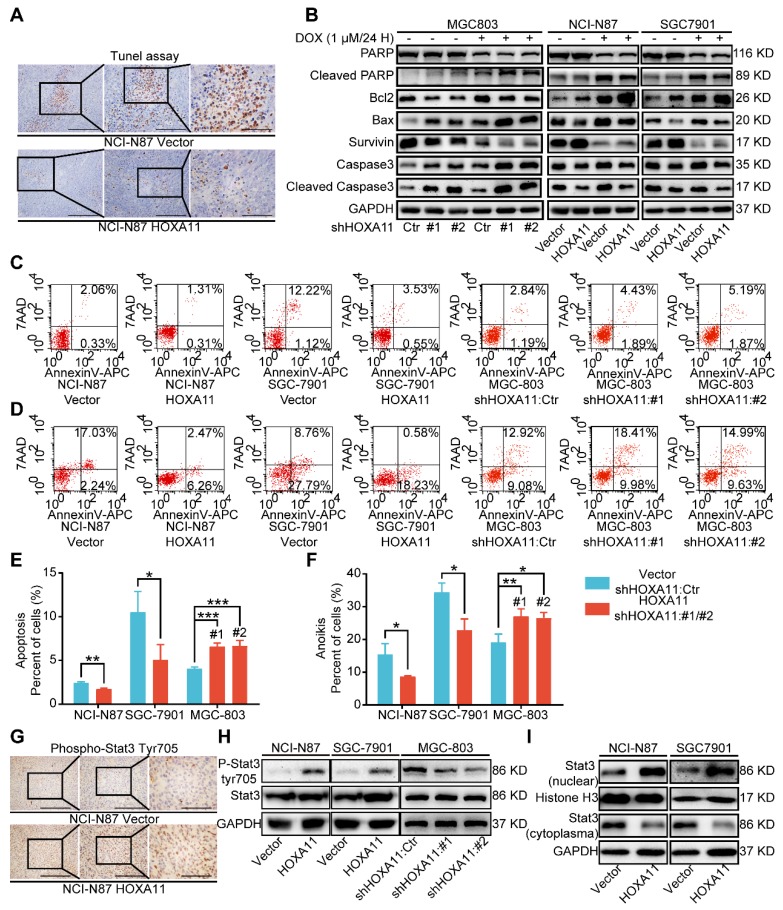
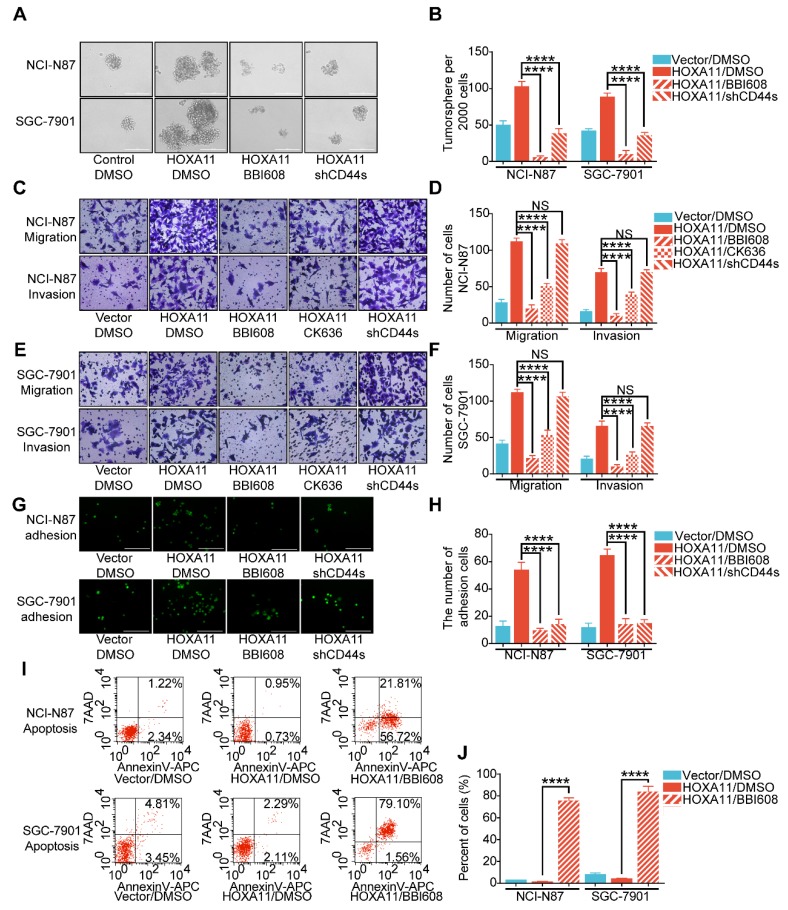
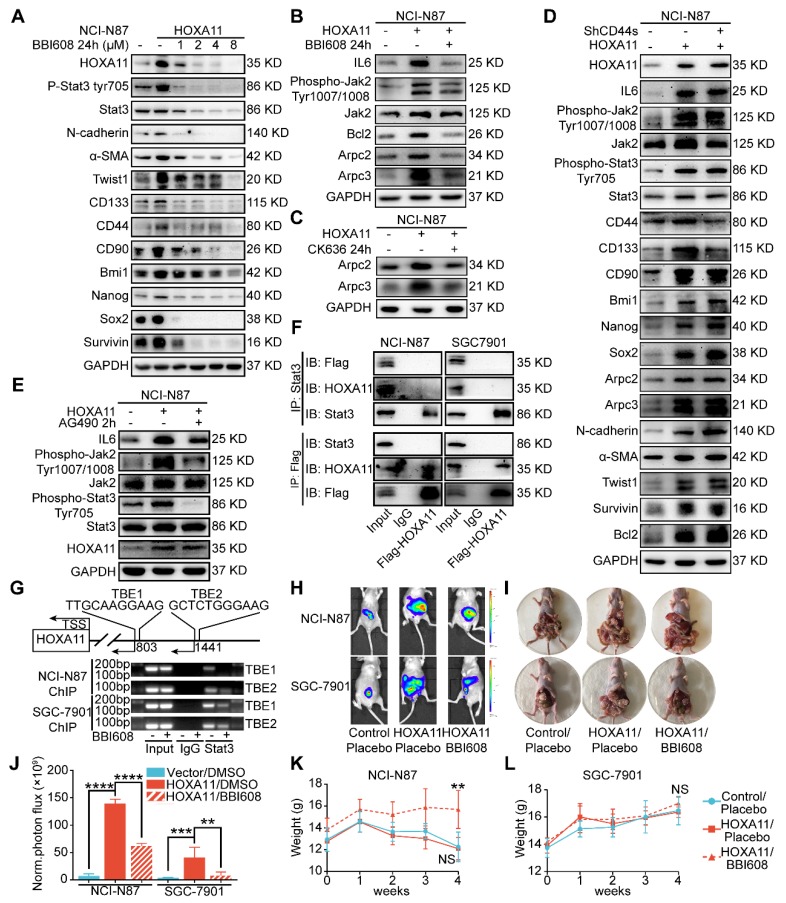
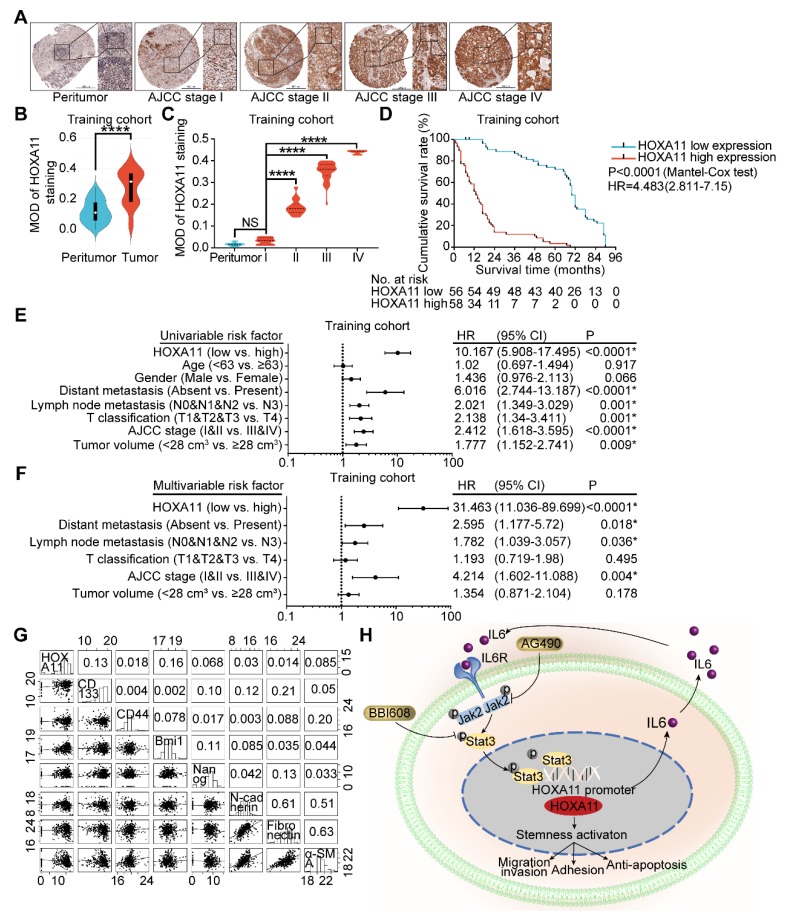
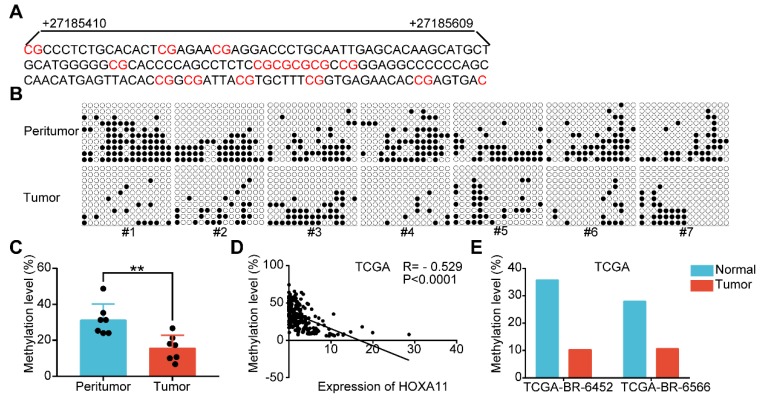
Rationale: Peritoneal metastasis is one of the most common and life-threatening metastases in gastric cancer patients. The disseminated gastric cancer cells forming peritoneal metastasis exhibit a variety of characteristics that contrast with those of adjacent epithelial cell of gastric mucosa and even primary gastric cancer cells. We hypothesized that the gene expression profiles of peritoneal foci could reveal the identities of genes that might function as metastatic activator. Methods: In this study, we show, using in vitro, in vivo, in silico and gastric cancer tissues studies in humans and mice, that Homoebox A11 (HOXA11) potently promote peritoneal metastasis of gastric cancer cells. Results: Its mechanism of action involves alternation of cancer stemness and subsequently enhancement of the adhesion, migration and invasion and anti-apoptosis. This is achieved, mainly, through formation of a positive feedback loop between HOXA11 and Stat3, which is involved in the stimulation of Stat3 signaling pathway. Conclusions: These observations uncover a novel peritoneal metastatic activator and demonstrate the association between HOXA11, Stat3 and cancer stemness of gastric cancer cells, thereby revealing a previously undescribed mechanism of peritoneal metastasis.

Keywords: BBI608; HOXA11; Stat3; gastric cancer; peritoneal metastasis.


Conflict of interest statement

Competing Interests: The authors have declared that no competing interest exists.

Figures

Figure 1
Figure 1
HOXA11 was high expressed in the peritoneal foci of gastric cancer and promoted peritoneal metastasis. (A) A venn diagram summarized the upregulated genes and downregulated genes in both primary gastric cancer and peritoneal foci when compared with the adjacent chronic gastritis tissues. (B) The list shown the genes' name which belong to the category of upregulated and downregulated genes, respectively. (C) Chordal graph shown the pathway analysis of shared upregulated and down-regulated genes in both primary gastric cancer and peritoneal foci by GO enrichment. (D) Immunohistochemistry assay show the expression of HOXA11 in both primary gastric cancer and peritoneal foci, the left scale bar, 200 μm, 200× magnification, the right scale bar, 100 μm, 400× magnification. (E) Left: western blot analysis of HOXA11 protein levels in 10 gastric cancer cells and normal gastric epithelial cell line GES-1, right: expression of HOXA11 of indicated cells were analyzed using western blot, and GAPDH was used as a loading control. Each experiment was performed in triplicate. (F) Expression of HOXA11 of indicated cells were analyzed using qRT-PCR. Results were shown as mean ± SEM of three independent experiments, each experiment was performed in triplicate. **, P<0.01 (Student t test). (G) Immunofluorescence staining for HOXA11 in NCI-N87-Vector and NCI-N87-HOXA11 cells are shown here (HOXA11, red; DAPI, blue). The scale bar, 100 μm, 200× magnification; 50 μm, 400× magnification. Each experiment was performed in triplicate. (H) Overexpression of HOXA11 promoted peritoneal metastasis of gastric cancer cells in BALB/c mice. Tumor in both groups are measured both in situ and after laparotomy. (I) Statistical analysis of the bioluminescence in peritoneal foci of both groups. Results were shown as mean ± SEM, ****, P<0.0001 (Student t test). (J & L) Immunohistochemistry assay shown the expression of HOXA11 and Twist1 in peritoneal foci derived from NCI-N87-Vector and NCI-N87-HOXA11 cell groups, respectively. The scale bar, from left to right, 400 μm, 100× magnification; 200 μm, 200× magnification; 100 μm, 400× magnification. (K & M) Statistical analysis of HOXA11 and Twist1 staining intensity (H-score) in both groups. Results were shown as mean ± SEM of three independent experiments, each experiment was performed in triplicate. ****, P<0.0001 (Student t test).
Figure 2
Figure 2
HOXA11 changed the morphology of gastric cancer cells and promoted gastric cancer cells motility, migration and invasion. (A) Fluorescence microscope images of NCI-N87 and SGC-7901 upon HOXA11 induction as well as MGC-803 cells upon HOXA11 knockdown. Rhodamine phalloidin was used to label the cytoskeletal F-actin (phalloidin, red; DAPI, blue). The scale bar, 100 μm, 200× magnification. Each experiment was performed in triplicate. (B) The protein expression of HOXA11, Fibronectin, N-cadherin, E-cadherin, α-SMA, and Twist1 in NCI-N87-Vector, NCI-N87-HOXA11, SGC-7901-Vector, SGC-7901-HOXA11, MGC-803-Control, MGC-803-shHOXA11 #1 and MGC-803-shHOXA11 #2 cells were analyzed using western blot with the indicated antibodies. GAPDH was used as the internal protein loading control. Each experiment was performed in triplicate. (C) Time-lapse phase-contrast images from scratch-wound assays performed on NCI-N87-Vector, NCI-N87-HOXA11 cells, SGC-7901-Vector and SGC-7901-HOXA11 cells. The scale bar, 1000 μm, 40× magnification. (D) Quantification demonstrated impaired directional migration with HOXA11 overexpression (data points = % of original wound area healed at the indicated time). Results were shown as mean ± SEM of three independent experiments, each experiment was performed in triplicate. *, P<0.05; **, P<0.01; ****, P<0.0001 (Student t test). (E) Representative images of cell migration and invasion assays. The scale bar, 120 μm, 200× magnification. (F) Statistical analysis of number of migratory/invading cells. Results were shown as mean ± SEM of three independent experiments, each experiment was performed in triplicate. ***, P<0.001; ****, P<0.0001 (Student t test and the analysis of variance test).
Figure 3
Figure 3
HOXA11 enhanced gastric cancer cell stemness and adhesion. (A) Immunohistochemistry assay shown the expression of CD44 in both primary gastric cancer and peritoneal foci, the left scale bar, 200 μm, 200× magnification; the right scale bar, 100 μm, 400× magnification. (B) Immunohistochemistry assay shown the expression of CD44 in peritoneal foci derived from NCI-N87-Vector and NCI-N87-HOXA11 cell groups, the left scale bar, 200 μm, 200× magnification; the right scale bar, 100 μm, 400× magnification. (C) Immunofluorescence staining for CD44 in NCI-N87-Vector, NCI-N87-HOXA11, SGC-7901-Vector, SGC-7901-HOXA11, MGC-803-Control, MGC-803-shHOXA11 #1 and MGC-803-shHOXA11 #2 cells were shown here (CD44, red; DAPI, blue). The scale bar. 100 μm, 200× magnification; each experiment was performed in triplicate. (D) The protein expression of CD44, CD90, CD133, Sox2, Bmi1 and Nanog in NCI-N87-Vector, NCI-N87-HOXA11, SGC-7901-Vector, SGC-7901-HOXA11, MGC-803-Control, MGC-803-shHOXA11 #1 and MGC-803-shHOXA11 #2 cells were analyzed using western blot with the indicated antibodies. GAPDH was used as the internal protein loading control. Each experiment was performed in triplicate. (E) Representative images of tumorsphere formed by the indicated cells in suspension with cancer stem cell medium. Histograms shown the mean number of tumorsphere. The scale bar, 400 μm, 100× magnification. Results were shown as mean ± SEM of three independent experiments, each experiment was performed in triplicate. ***, P<0.001 (Student t test and the analysis of variance test). (F) Representative images of adhesion assays which gastric cancer cells adhere to the HPMC. Histograms shown the number of adhered gastric cancer cells in each group. The scale bar, 400 μm, 100× magnification. Results were shown as mean ± SEM of three independent experiments, each experiment was performed in triplicate. ***, P<0.001; ****, P<0.0001 (Student t test and the analysis of variance test).
Figure 4
Figure 4
HOXA11 suppressed apoptosis and anoikis of gastric cancer cells and activated Stat3 signaling pathways. (A) Representative images of Tunel assays in peritoneal foci derived from NCI-N87-Vector and NCI-N87-HOXA11 cell groups. The scale bar, from left to right, 400 μm, 100× magnification; 200 μm, 200× magnification; 100 μm, 400× magnification. Each experiment was performed in triplicate. (B) The protein expression of PARP, Cleaved PARP, Bcl2, Bax, Survivin, Caspase3, and Cleaved caspase3 in NCI-N87-Vector, NCI-N87-HOXA11, SGC-7901-Vector, SGC-7901-HOXA11, MGC-803-Control, MGC-803-shHOXA11 #1 and MGC-803-shHOXA11 #2 cells treated with Doxorubicin (1 μm) for 24 hours or not were analyzed using western blot with the indicated antibodies. GAPDH was used as the internal protein loading control. Each experiment was performed in triplicate. (C) The apoptosis of indicated cells were analyzed by flow cytometry via labeling with APC-Annexin-V and 7-AAD. Representative images were shown. (D) The anoikis of indicated cells were analyzed by flow cytometry via labeling with APC-Annexin-V and 7-AAD. Representative images were shown. (E & F) Histograms shown the apoptosis and anoikis level of indicated cells respectively. Results were shown as mean ± SEM of three independent experiments, each experiment was performed in triplicate. *, P<0.05; **, P<0.01; ***, P<0.001 (Student t test and the analysis of variance test). (G) Immunohistochemistry assays shown the expression of phosphorylation (Tyr705) of Stat3 in peritoneal foci derived from NCI-N87-Vector and NCI-N87-HOXA11 cell groups. The scale bar, from left to right, 400 μm, 100× magnification; 200 μm, 200× magnification; 100 μm, 400× magnification. Each experiment was performed in triplicate. (H) The protein expression of phosphorylation (Tyr705) of Stat3 and Stat3 in NCI-N87-Vector, NCI-N87-HOXA11, SGC-7901-Vector, SGC-7901-HOXA11, MGC-803-Control, MGC-803-shHOXA11 #1 and MGC-803-shHOXA11 #2 cells were analyzed using western blot with the indicated antibodies. GAPDH was used as the internal protein loading control. Each experiment was performed in triplicate. (I) HOXA11 overexpression increased Stat3 nuclear accumulation in indicated cells, as confirmed by western blot analysis. GAPDH and Histone H3 were used as loading controls. Each experiment was performed in triplicate.
Figure 5
Figure 5
HOXA11 mediated malignant phenotypes which was required for transcriptional activation of Stat3. (A & B) Representative images of tumorsphere formed by the indicated cells in suspension with cancer stem cell medium and then treated with either DMSO or BBI608 (NCI-N87-HOXA11 cells: 3 μM or SGC-7901-HOXA11 cells: 6.5 μM) for 24 h at 37°C. Histograms shown the mean number of tumorsphere. The scale bar, 400 μm, 100× magnification. Results were shown as mean ± SEM of three independent experiments, each experiment was performed in triplicate. ****, P<0.0001 (the analysis of variance test). (C to F) Representative images of cell migration and invasion assays were performed to investigate the indicated cells treated with knockdown of CD44s, BBI608 (NCI-N87-HOXA11 cells: 3 μM or SGC-7901-HOXA11 cells: 6.5 μM), CK636 (4 μM) or DMSO for 24 h at 37°C. The scale bar, 120 μm, 200× magnification. Histograms shown the number of migratory/invading cells. Results were shown as mean ± SEM of three independent experiments, each experiment was performed in triplicate. NS, no significance; ***, P<0.001; ****, P<0.0001 (the analysis of variance test). (G & H) Representative images of adhesion assays which the indicated cells treated with knockdown of CD44s, BBI608 (NCI-N87-HOXA11 cells: 3 μM or SGC-7901-HOXA11 cells: 6.5 μM) or DMSO for 24 h at 37°C, and then trypsinized into single suspension and adhered to the HPMC for 3 h. Histograms shown the number of adhered gastric cancer cells in each group. The scale bar, 400 μm, 100× magnification. Results were shown as mean ± SEM of three independent experiments, each experiment was performed in triplicate. ****, P<0.0001 (the analysis of variance test). (I & J) The apoptosis of indicated cells treated with BBI608 (NCI-N87-HOXA11 cells: 3 μM or SGC-7901-HOXA11 cells: 6.5 μM) or DMSO for 24 h at 37°C were analyzed by flow cytometry via labeling with APC-Annexin-V and 7-AAD. Representative images were shown. Histograms shown the apoptosis level of each group respectively. Results were shown as mean ± SEM of three independent experiments, each experiment was performed in triplicate. ****, P<0.0001 (the analysis of variance test).
Figure 6
Figure 6
HOXA11-Stat3 generated a positive-feedback loop, and inhibition of Stat3 suppressed the peritoneal metastasis caused by HOXA11. (A) NCI-N87-HOXA11 cells were treated with BBI608 at a density of 1, 2, 4, or 8 μM or with DMSO (-) as well as NCI-N87-Vector cells treated with DMSO (-) for 24 h at 37°C. Cell lysates from the indicated cells were then analyzed by western blot. BBI608 suppressed the expression of HOXA11, crucial metastatic and stemness related proteins. GAPDH was used as the internal protein loading control. Each experiment was performed in triplicate. (B) The protein expression of IL6, phosphorylation (Tyr1007/1008) of Jak2, Jak2, Bcl2, Arpc2 and Arpc3 in NCI-N87-Vector and NCI-N87-HOXA11 cells treated with BBI608 (3 μM) for 24 h at 37°C were analyzed using western blot with the indicated antibodies. GAPDH was used as the internal protein loading control. Each experiment was performed in triplicate. (C) The protein expression of Arpc2 and Arpc3 in NCI-N87-Vector and NCI-N87-HOXA11 cells treated with CK636 (4 μM) for 24 h at 37°C were analyzed using western blot with the indicated antibodies. GAPDH was used as the internal protein loading control. Each experiment was performed in triplicate. (D) NCI-N87-HOXA11 cells were treated with knockdown of CD44s for 24 h at 37°C. Cell lysates from the indicated cells were then analyzed by western blot with the indicated antibodies. GAPDH was used as the internal protein loading control. Each experiment was performed in triplicate. (E) NCI-N87-HOXA11 cells were treated with AG490 (60 μM) for 2 h at 37°C. Cell lysates from the indicated cells were then analyzed by western blot with the indicated antibodies. GAPDH was used as the internal protein loading control. Each experiment was performed in triplicate. (F) Co-IP experiments in NCI-N87-flag-HOXA11 and SGC-7901-flag-HOXA11 cells using anti-Stat3 and anti-Flag antibodies, respectively. (G) The ChIP-qPCR experiments were performed to assess whether the binding ability of Stat3 on the promoter region of HOXA11 which was affected by BBI608, a schematic illustrated the relative positions of qPCR probes to putative transcription binding elements (TBEs) for ChIP-qPCR experiments. TBE1: TTGCAAGGAAG, TBE2: GCTCTGGGAAG. IgG was used as a negative control. (H & I) BBI608, which targets Stat3, suppressed the peritoneal metastasis of gastric cancer cells caused by HOXA11 in BALB/c mice. Tumor in all groups were measured both in situ and after laparotomy. (I) Statistical analysis of the bioluminescence in peritoneal foci of all groups. Results were shown as mean ± SEM, **, P<0.01; ***, P<0.001; ****, P<0.0001 (the analysis of variance test). (K & L) These mice were given BBI608 (20 mg/kg), or DMSO i.p. All regimens were administered twice a week. Body weight was measured weekly during the treatment. There was no significant decrease in body weight due to administration of the BBI608.
Figure 7
Figure 7
HOXA11 was frequently upregulated in gastric cancer tissues and its correlation with clinicopathological parameters. (A) Examination of HOXA11 expression in primary gastric cancer and peritumor tissues by IHC. The scale bar, 500 μm, 50× magnification; 100 μm, 200× magnification; 50 μm, 400× magnification; (B) Statistical analysis of the HOXA11 expression in the paired primary gastric cancer and peritumor tissues of training cohort by MOD of staining. ****, P<0.0001 (Student t test). (C) Statistical analysis of the HOXA11 expression in peritumor tissues of AJCC stage I and primary gastric cancer tissues of different AJCC stages of training cohort by MOD of staining. NS, no significance; ****, P<0.0001 (the analysis of variance test). (D) Survival of patients in HOXA11-low expression group and HOXA11-high expression group. The survival time of patients in the training cohort was compared between groups using the Mantel-Cox test, which presented significantly longer survival of patients in the HOXA11-low expression group (P<0.0001). (E) Univariate analysis was performed in training cohort. The bar corresponds to 95% confidence intervals. (F) Multivariate analysis was performed in training cohort. The bar corresponds to 95% confidence intervals. (G) Correlations among HOXA11, CD133, CD44, Bmi1, Nanog, N-cadherin, Fibronectin and α-SMA levels in human gastric cancer tissues (TCGA, n=375). (H) Schematic diagram of the relationship between HOXA11, stemness, migration and invasion, adhesion and anti-apoptosis.
Figure 8
Figure 8
HOXA11 expression and promoter methylation in primary gastric cancer tissues and peritumor normal tissues. (A) The schematic illustration of 15 CpG sites located between nucleotides +27185410-+27185609 in the HOXA11 promoter for BSP. (B & C) BSP was performed to evaluate HOXA11 CpG island methylation statuses in seven paired gastric cancer tissues and peritumor normal tissues. All images and corresponding statistical plots were presented. Filled circles and open circles represent methylated and unmethylated CpG sites, respectively. (D) The correlation between expression of HOXA11 and methylation level of HOXA11 promoter in TCGA database. (E) The methylation level of HOXA11 promoter in two paired gastric cancer tissues and peritumor normal tissues (TCGA-BR-6452 & TCGA-BR-6566).

References

    1. Sun F, Feng M, Guan W. Mechanisms of peritoneal dissemination in gastric cancer. Oncol Lett. 2017;14:6991–8. - PMC - PubMed
    1. Zhang J, Huang JY, Chen YN, Yuan F, Zhang H, Yan FH. et al. Whole genome and transcriptome sequencing of matched primary and peritoneal metastatic gastric carcinoma. Sci Rep. 2015;5:13750. - PMC - PubMed
    1. Yang X, Deng Y, He RQ, Li XJ, Ma J, Chen G. et al. Upregulation of hoxa11 during the progression of lung adenocarcinoma detected via multiple approaches. Int J Mol Med. 2018;42:2650–64. - PMC - PubMed
    1. Zhang R, Zhang TT, Zhai GQ, Guo XY, Qin Y, Gan TQ. et al. Evaluation of the hoxa11 level in patients with lung squamous cancer and insights into potential molecular pathways via bioinformatics analysis. World J Surg Oncol. 2018;16:109. - PMC - PubMed
    1. Wang L, Cui Y, Sheng J, Yang Y, Kuang G, Fan Y. et al. Epigenetic inactivation of hoxa11, a novel functional tumor suppressor for renal cell carcinoma, is associated with rcc tnm classification. Oncotarget. 2017;8:21861–70. - PMC - PubMed

Publication types

MeSH terms