. 2019 Dec 5;4(23):e130090.
doi: 10.1172/jci.insight.130090.

Cytomegalovirus infection is a risk factor for tuberculosis disease in infants

Affiliations

Cytomegalovirus infection is a risk factor for tuberculosis disease in infants

Julius Müller et al. JCI Insight. .

Abstract

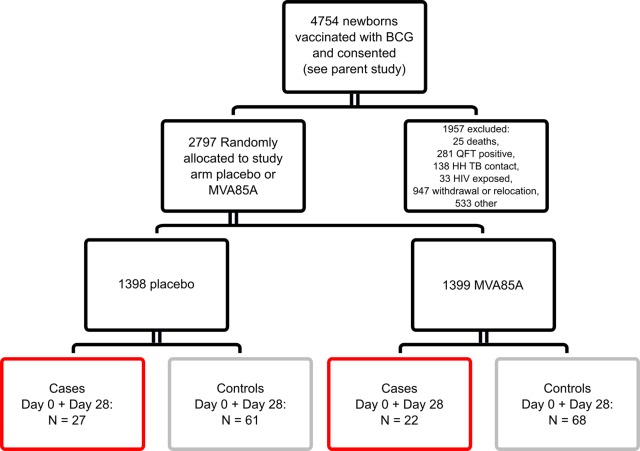
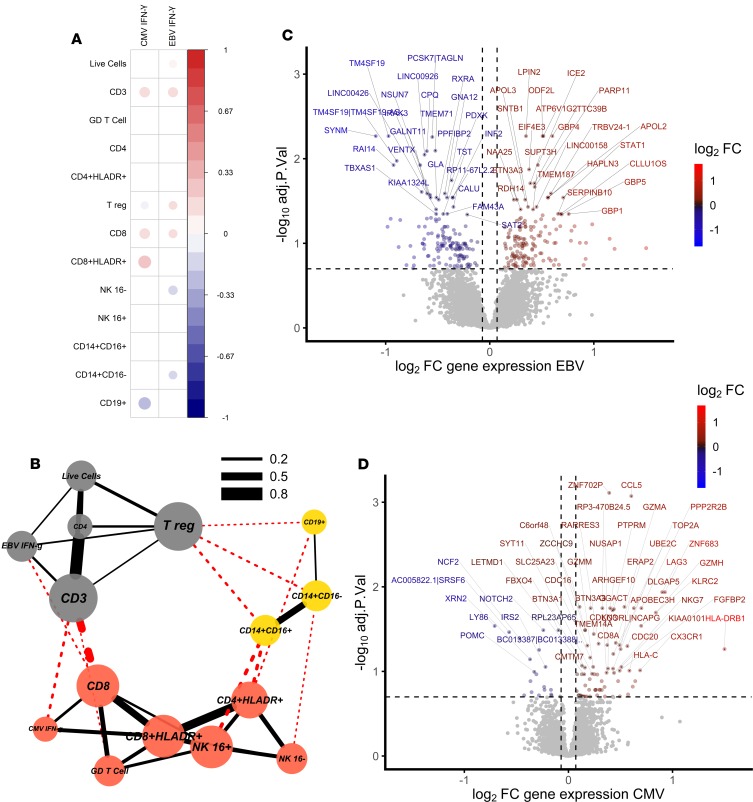
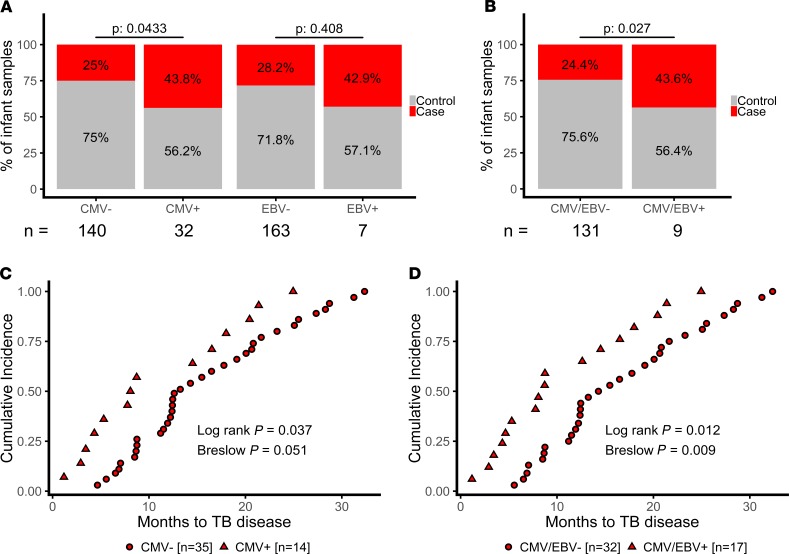
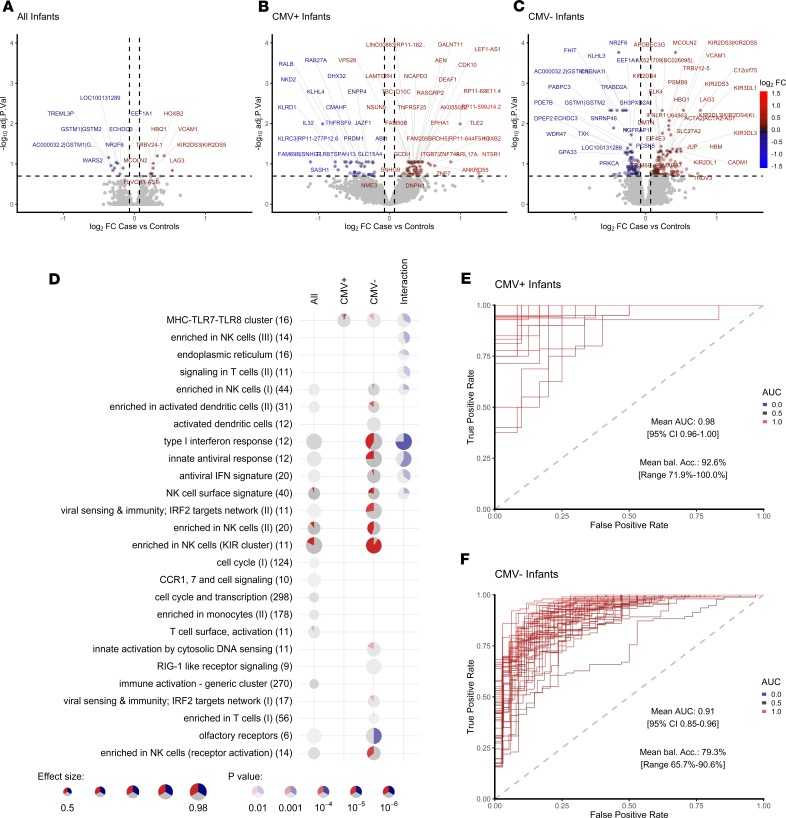
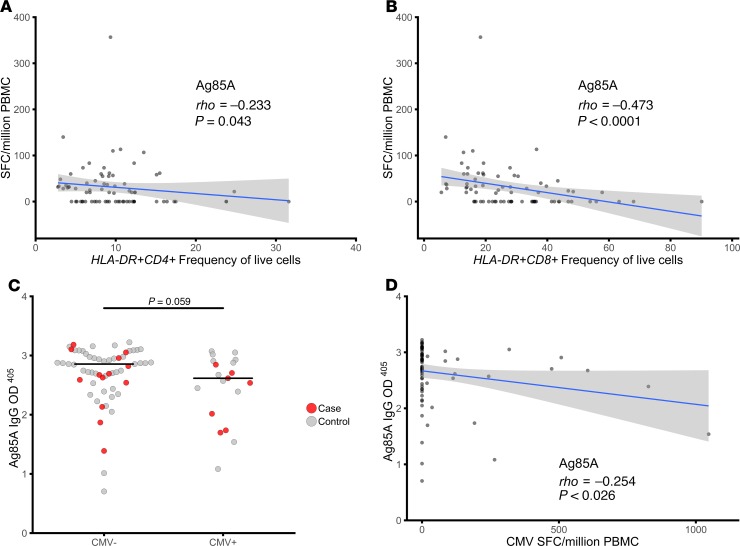
Immune activation is associated with increased risk of tuberculosis (TB) disease in infants. We performed a case-control analysis to identify drivers of immune activation and disease risk. Among 49 infants who developed TB disease over the first 2 years of life, and 129 healthy matched controls, we found the cytomegalovirus-stimulated (CMV-stimulated) IFN-γ response to be associated with CD8+ T cell activation (Spearman's rho, P = 6 × 10⁻⁸). A CMV-specific IFN-γ response was also associated with increased risk of developing TB disease (conditional logistic regression; P = 0.043; OR, 2.2; 95% CI, 1.02-4.83) and shorter time to TB diagnosis (Log Rank Mantel-Cox, P = 0.037). CMV+ infants who developed TB disease had lower expression of NK cell-associated gene signatures and a lower frequency of CD3-CD4-CD8- lymphocytes. We identified transcriptional signatures predictive of TB disease risk among CMV ELISpot-positive (area under the receiver operating characteristic [AUROC], 0.98, accuracy, 92.57%) and -negative (AUROC, 0.9; accuracy, 79.3%) infants; the CMV- signature was validated in an independent infant study (AUROC, 0.71; accuracy, 63.9%). A 16-gene signature that previously identified adolescents at risk of developing TB disease did not accurately classify case and control infants in this study. Understanding the microbial drivers of T cell activation, such as CMV, could guide new strategies for prevention of TB disease in infants.

Trial registration: ClinicalTrials.gov NCT00953927.

Keywords: Inflammation; NK cells; Tuberculosis; Vaccines.


Conflict of interest statement

Conflict of interest: The authors have declared that no conflict of interest exists.

Figures

Figure 1
Figure 1. Study design for immune correlates analysis.
Infants who were enrolled in an efficacy trial of the candidate TB vaccine MVA85A were included in this study (4). Infants were randomized at 16–24 weeks of age to receive a single intradermal dose of MVA85A or placebo (Candin, a candida skin test antigen) (4). Boxes indicate the number of case infant (red) or control infant (gray) samples available for combined Day 0 (D0) and D28 analysis. Analysis was restricted to infants where a frozen PBMC sample was available and live cells in PBMC were > 50% (or PHA IFN-γ ELISPOT ≥ 1000 SFC/million), as well as to infants where a sample was available for analysis from both the D0 and D28 time points. Control infants were excluded if the corresponding matched case was not in the analysis. QFT, QuantiFERON-TB Gold test; HH, household.
Figure 2
Figure 2. CMV infection is associated with CD8+ T cell activation in South African infants.
(A) Correlation matrix of significantly (Spearman’s rho, P < 0.05) correlated cell populations and IFN-γ ELISpot responses to EBV and CMV using cellular data. The magnitude of the CMV-specific IFN-γ ELISpot response correlated with the frequency of activated CD8+ T cells. (B) Network of positively correlating cell populations using cellular data (Spearman’s rho, P < 0.05) showing 3 clusters dominated by activated T cells with CMV, CD3+ T cells with EBV, and monocytes with B cells (node color indicates cluster membership using clusters defined by ref. ; red, clustering with CMV response; gray, clustering with EBV response; and yellow, clustering with myeloid cells). Red lines indicate between-cluster correlations, and black lines within-cluster correlations. Line width indicates the correlation coefficient. (C) Volcano plot using transcriptomic data showing magnitude and significance of differential expression between EBV+ and EBV infants, where blue indicates genes that are downregulated in EBV+ infants and red indicates genes that are upregulated in EBV+ infants. (D) CMV–strongly positive (ELISpot > 100 SFC/million) and CMV infants, where blue indicates genes that are downregulated in CMV+ infants and red indicates genes that are upregulated in CMV+ infants. Gray indicates genes for which expression is unchanged. The top 50 significant genes are labeled, and horizontal and vertical dashed lines indicate 20% FDR and 5% change in gene expression, respectively.
Figure 3
Figure 3. CMV+ infants are at increased risk of developing TB disease.
(A) We saw a higher proportion of case (red) infants among CMV+ (n = 14 of 32) when compared with CMV infants (n = 35 of 140), and there was no significant enrichment for cases among EBV+ infants (n = 3 of 7 compared with n = 46 of 163), although infants positive for either CMV or EBV (B) were at increased risk (n = 17 of 39 compared with 32 of 131). (C) CMV+ TB case infants (red triangles, n = 14) developed TB disease earlier in follow-up when compared with CMV infants (red circles, n = 35), and (D) TB case infants positive for either CMV or EBV (red triangles, n = 17) developed TB disease earlier than CMV/EBV infants (red circles, n = 32).
Figure 4
Figure 4. Transcriptomic correlates of risk of TB disease are different in CMV+ and CMV infants.
Volcano plots showing magnitude and significance of differential expression between all case and control infants (A), CMV+ case and control infants (B), and CMV case and control infants (C). The top 50 significant genes are labeled, and horizontal and vertical dashed lines indicate 20% FDR and 5% change in gene expression, respectively. Log2 FC color code: blue, downregulated in cases vs. controls; gray, unchanged; red, upregulated in cases vs. controls. (D) Enriched modules for differential expression in case and control infants among all, CMV+, and CMV infants. Each row contains 1 module with the number of genes indicated. Each significantly enriched module at a P < 0.05 is shown as a pie chart. The size of the pie corresponds to the AUROC in the cerno test, and intensity of the color corresponds to the enrichment q value. The red and blue color indicates the amount of significantly up- and downregulated genes, respectively, and gray color indicates the remaining nonsignificant genes within the category. The interaction term evaluates the statistical difference between changes in CMV+ and CMV infants. (E and F) AUROC of the classification performance of the artificial neural network model, which was trained using approximately 70% of the data, and risk of TB was predicted on the withheld 30% of the data (Supplemental Figure 3A). The process was repeated 50 times with random splits into training and test set (bootstrapping), and the AUROC was recorded for each round for CMV+ (E) and CMV (F) infants.
Figure 5
Figure 5. T cell activation is associated with lower mycobacterial antigen–specific immune response following immunization with MVA85A.
(A and B) The D28 IFN-γ ELISpot response to Ag85A was inversely correlated with both activated CD4+ T cell (A) and activated CD8+ T cell (B) frequency. (C) There was a trend for lower anti–Ag85A IgG in CMV+ compared with CMV infants following immunization with MVA85A. (D) Anti–Ag85A IgG was inversely correlated with CMV ELISpot response. Mann Whitney U test and Spearman’s rho correlation. Red, cases; gray, controls.

References

    1. [No authors listed]. World Health Organization Global Tuberculosis Report 2019. World Health Organization. https://www.who.int/tb/publications/global_report/en/ Accessed October 31, 2019.
    1. Lamb GS, Starke JR. Tuberculosis in Infants and Children. Microbiol Spectr. 2017;5(2):TNMI7-0037-2016 - PMC - PubMed
    1. Hawkridge A, et al. Efficacy of percutaneous versus intradermal BCG in the prevention of tuberculosis in South African infants: randomised trial. BMJ. 2008;337:a2052. - PMC - PubMed
    1. Tameris MD, et al. Safety and efficacy of MVA85A, a new tuberculosis vaccine, in infants previously vaccinated with BCG: a randomised, placebo-controlled phase 2b trial. Lancet. 2013;381(9871):1021–1028. doi: 10.1016/S0140-6736(13)60177-4. - DOI - PMC - PubMed
    1. Fletcher HA, et al. Human newborn bacille Calmette-Guérin vaccination and risk of tuberculosis disease: a case-control study. BMC Med. 2016;14:76. - PMC - PubMed

Publication types

MeSH terms

Associated data