. 2019 Nov 7;14(11):e0224491.
doi: 10.1371/journal.pone.0224491. eCollection 2019.

Optimizing the procedure of grain nutrient predictions in barley via hyperspectral imaging

Affiliations

Optimizing the procedure of grain nutrient predictions in barley via hyperspectral imaging

Mathias Wiegmann et al. PLoS One. .

Abstract

Hyperspectral imaging enables researchers and plant breeders to analyze various traits of interest like nutritional value in high throughput. In order to achieve this, the optimal design of a reliable calibration model, linking the measured spectra with the investigated traits, is necessary. In the present study we investigated the impact of different regression models, calibration set sizes and calibration set compositions on prediction performance. For this purpose, we analyzed concentrations of six globally relevant grain nutrients of the wild barley population HEB-YIELD as case study. The data comprised 1,593 plots, grown in 2015 and 2016 at the locations Dundee and Halle, which have been entirely analyzed through traditional laboratory methods and hyperspectral imaging. The results indicated that a linear regression model based on partial least squares outperformed neural networks in this particular data modelling task. There existed a positive relationship between the number of samples in a calibration model and prediction performance, with a local optimum at a calibration set size of ~40% of the total data. The inclusion of samples from several years and locations could clearly improve the predictions of the investigated nutrient traits at small calibration set sizes. It should be stated that the expansion of calibration models with additional samples is only useful as long as they are able to increase trait variability. Models obtained in a certain environment were only to a limited extent transferable to other environments. They should therefore be successively upgraded with new calibration data to enable a reliable prediction of the desired traits. The presented results will assist the design and conceptualization of future hyperspectral imaging projects in order to achieve reliable predictions. It will in general help to establish practical applications of hyperspectral imaging systems, for instance in plant breeding concepts.


Conflict of interest statement

The authors have declared that no competing interests exist.

Figures

Fig 1
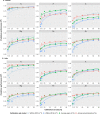
Fig 1. Regression model comparison—Across environments—Across traits.
Comparison of the investigated regression models in regard to prediction performance (R2) across the four environments (DUN15, DUN16, HAL15 & HAL16) and the six nutrient traits (N, P, K, Mg, Fe & Zn) for different calibration set sizes from 5% to 99%. The color of the boxplots differentiates the three different model types MLP (multi-layer perceptron, blue), tRBF (radial base function network with transfer learning, green) and PLS (partial least squares, red). The diamonds inside the boxes indicate the arithmetic mean. Letters (a, b, c) in the upper part of the figure indicate significant (P<0.05) differences between the models based on a Tukey test (S4 Table). Furthermore, numbers above the letters indicate the change in prediction performance compared to the next smaller one.
Fig 2
Fig 2. Calibration set size comparison—Within environments—Across traits.
Impact of calibration set size on prediction performance (R2) in each of the four environments (DUN15 = dark blue, DUN16 = light blue, HAL15 = orange, HAL16 = yellow) across the six nutrient traits (N, P, K, Mg, Fe & Zn). A logarithmic function was fitted, which indicates the gain in prediction performance (R2) with increasing calibration set sizes. The formulas of these four functions are shown in the upper left corner.
Fig 3
Fig 3. Calibration set size comparison—Across environments—Within traits.
Impact of calibration set size on prediction performance (R2) across the four environments (DUN15, DUN16, HAL15 & HAL16) for each of the six nutrient traits (N, P, K, Mg, Fe & Zn). The color of the boxplots represents the six different traits and the diamonds inside the boxes indicate the arithmetic mean. The numbers in the upper part of the figure indicate the change in prediction performance compared to the next smaller one.
Fig 4
Fig 4. Calibration model comparison—With additional samples—Within environments—Across traits.
Comparison of the three calibration set compositions (within environments, across years & across environments) across the six nutrient traits (N, P, K, Mg, Fe & Zn) in Dundee and Halle. The color of the boxplots represents the combination of the different calibration set models and environments. The resulting extension of the total number of samples used for the respective model composition is indicated in parentheses (n*1 = single number of samples, n*2 = duplicated number of samples & n*4 = quadruplicated number of samples). The diamonds inside the boxes indicate the arithmetic mean. Letters (a, b) in the upper part of the figure indicate significant (P<0.05) differences between the model compositions based on a Tukey test (S7 Table). Furthermore, numbers above the letters indicate the change in prediction performance compared to the next smaller one.
Fig 5
Fig 5. Calibration model comparison—With additional samples—Within environments—Within traits.
Comparison of the three calibration set compositions (within environments, across years & across environments) for each of the six nutrient traits (N, P, K, Mg, Fe & Zn) in Dundee and Halle. The colors of the lines represent the different calibration set models. In addition, the legend contains the number of samples used for the respective model composition (n*1 = single number of samples, n*2 = duplicated number of samples & n*4 = quadruplicated number of samples) in parentheses.
Fig 6
Fig 6. Model transferability—Within environments—Across traits.
Evaluation of model transferability to predict grain nutrients in each of the four environments (Dundee 2015, Dundee 2016, Halle 2015 & Halle 2016, shown as columns) across the six nutrient traits (N, P, K, Mg, Fe & Zn). Seven different prediction models (within each environment, across years, across environments; shown as rows) were used to predict nutrient concentrations of the six traits in the four investigated environments. Prediction models containing the respective environment to be predicted are visually emphasized. The three types of prediction model compositions contain different numbers of samples: the four within environment models (DUN15, DUN16, HAL15 & HAL16) contain the simple number of samples of the respective environment, the two across years models (DUN1516 & HAL1516) the duplicated number of samples and the across environments model (DUNHAL1516) the quadruplicated number of samples.

References

    1. Kearney J. Food consumption trends and drivers. Philos Trans R Soc Lond, B, Biol Sci. 2010; 365: 2793–2807. 10.1098/rstb.2010.0149 - DOI - PMC - PubMed
    1. OECD-FAO Agricultural outlook 2017–2026. Special focus: Southeast Asia. Paris: OECD Publishing; 2017.
    1. McKevith B. Nutritional aspects of cereals. Nutr Bull. 2004; 29: 111–142. 10.1111/j.1467-3010.2004.00418.x - DOI
    1. Elleuch M, Bedigian D, Roiseux O, Besbes S, Blecker C, Attia H. Dietary fibre and fibre-rich by-products of food processing. Characterisation, technological functionality and commercial applications: A review. Food Chem. 2011; 124: 411–421. 10.1016/j.foodchem.2010.06.077 - DOI
    1. Gaudichon CC. Protein quality in human nutrition and contribution of cereals to protein intake. Nantes, France; 2015.

Publication types