. 2019 Nov 7;14(11):e0224950.
doi: 10.1371/journal.pone.0224950. eCollection 2019.

Evaluating rectal swab collection method for gut microbiome analysis in the common marmoset (Callithrix jacchus)

Affiliations

Evaluating rectal swab collection method for gut microbiome analysis in the common marmoset (Callithrix jacchus)

Stephen C Artim et al. PLoS One. .

Abstract

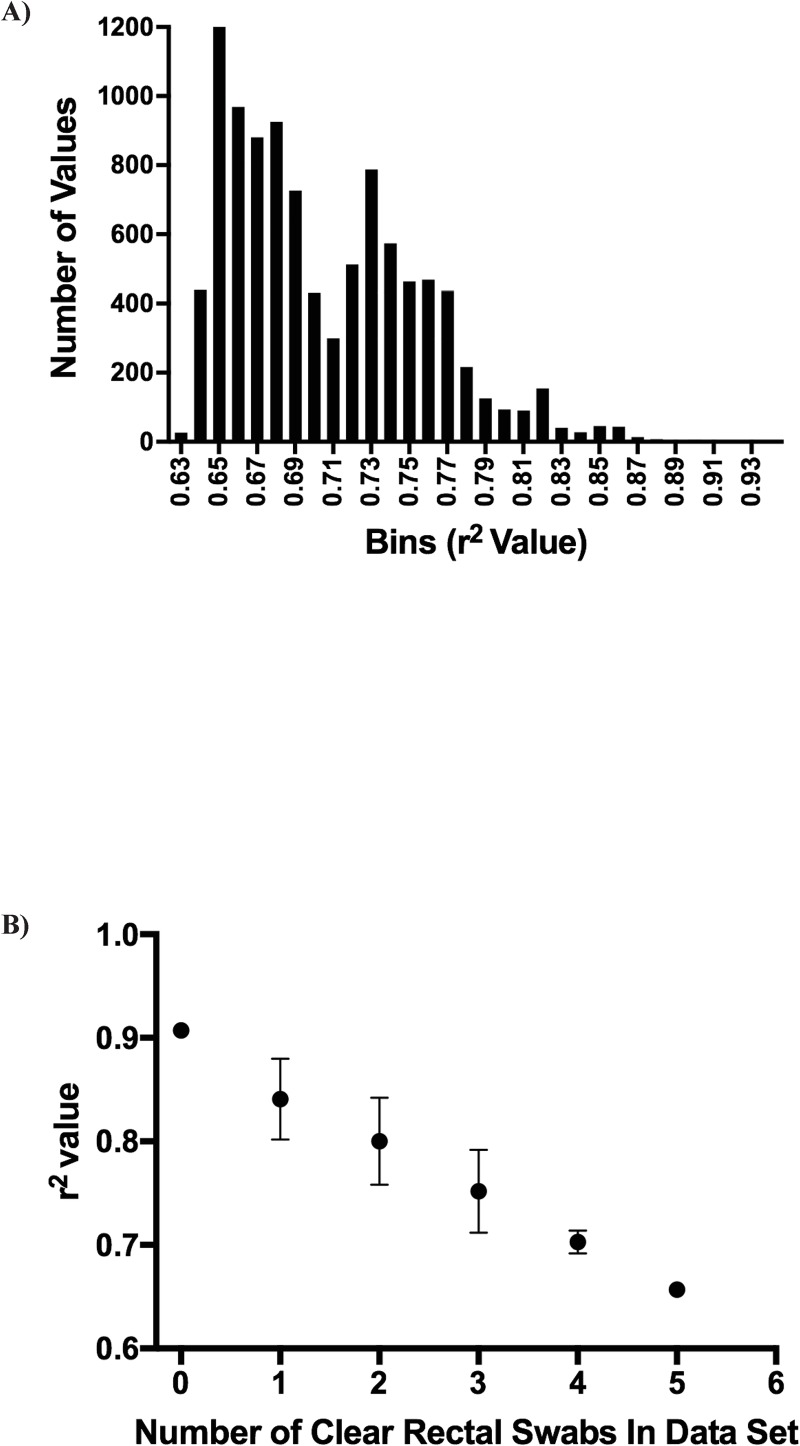
The common marmoset (Callithrix jacchus) is increasingly used as an animal model for biomedical research; however, gastrointestinal diseases causing significant morbidity are endemic in many captive marmoset colonies. Establishing gut microbiome patterns in a marmoset colony may aid in clinical decision-making and model reproducibility. A standardized method of sample collection and storage is essential for proper interpretation of microbiome data. While microbiome studies commonly utilize fecal samples, the goal of this study was to determine whether the microbiome profile from a rectal swab performed on a sedated animal was comparable to the microbiome profile from a fecal sample. During routine physical exams, paired fecal and rectal swab samples were collected from each of 23 marmosets. DNA was extracted from all fecal and rectal swab samples and 16S ribosomal RNA gene sequences were amplified and analyzed. Initial comparison of the relative abundance of bacterial phyla between paired samples had a r2 value of 0.70 with S of 0.08 with no significant differences in α and β diversity metrics between fecal and rectal samples. Initial analysis however, revealed 5 discordant fecal-rectal pairs which corresponded only with the 5 rectal swabs that were classified as free of visible fecal matter during collection. Exclusion of these 5 pairs resulted in an optimized fit of the data as evidenced by a r2 value of 0.91 with S of 0.05. These results demonstrate that rectal swabs are a reliable method for profiling the fecal microbiome in the marmoset since the bacterial composition from a rectal swab with visible fecal contents correlated well with the bacterial composition from a fecal sample from the same marmoset. This study highlights the importance of standardized sample collection methods and exclusion of inappropriate samples.


Conflict of interest statement

The authors have declared that no competing interests exist.

Figures

Fig 1
Fig 1. Location of rectal swab sampling.
A sedated adult marmoset was radiographed (Toshiba Rotanode at 40 kVp and 3.75 mAs) as a routine procedure. A Calgiswab was inserted in the rectum and advanced to 3 cm past the anal verge. This swab was bent 90° at the 3 cm mark on the shaft so that rest of the shaft could be placed flush with the animal’s skin to indicate the entrance of the rectum. A white arrowhead marks the tip of the swab in the right lateral radiograph (A) and ventrodorsal radiograph (B).
Fig 2
Fig 2. Bacterial community composition of fecal (F) and rectal (R) samples.
Each animal in the study is listed by study ID listed in Table 1. The relative abundances of sequences classified to the order level with abundances <1% omitted for convenience. Animal #1 in this study was sampled twice 27 days apart. Thus, the samples are designated as 1_Fa and 1_Ra and 1_Fb and 1_Rb. A greyscale bar under the study ID indicates the relative amount of material on the rectal swab (white = FVFM [0] and black = maximal [4]).
Fig 3
Fig 3. Microbiome analysis of all fecal-rectal pairs collected in this study.
A) Relative abundance at the phyla level of each rectal swab sample was plotted against its paired fecal sample. A linear regression model was used to fit the data with a r2 value of 0.70 and a standard error of regression (S) of 0.08 to demonstrate how comparable the relative abundance of each rectal swab is to its paired fecal sample. B) A residuals plot of the linear regression fit from A. The residual plot shows a random arrangement of residuals, however there are some residuals that stand out. C) Boxplots showing the α diversity metrics calculated by using the chao1 index in QIIME. No significant difference observed between the fecal and rectal samples. D) Principal Coordinates Analysis (PCoA) of the weighted Unifrac distance representing the β diversity between all the samples E) Distance plots based on the weighted Unifrac distance of fecal and rectal swab samples according to group. Distances between fecal and rectal samples are lower within a marmoset compared to all other marmosets in the study (P value: <0.0001).
Fig 4
Fig 4. Microbiome re-analysis of all fecal-rectal pairs collected in this study.
Re-analysis of fecal-rectal pairs with the omission of 5 pairs that were noted to have FVFM rectal sample during sample collection. A) Relative abundance at the phyla level of each rectal swab sample was plotted against its paired fecal sample. A linear regression model was used to fit the data with a r2 value of 0.91 and a standard error of regression (S) of 0.05 to demonstrate how comparable the relative abundance of each rectal swab is to its paired fecal sample. B) A residuals plot of the linear regression fit from A. The residual plot illustrates a random arrangement of residuals with no clear outliers. C) Boxplots showing the α diversity metrics calculated by using the chao1 index in QIIME. No significant difference observed between the fecal and rectal samples. D) Principal Coordinates Analysis (PCoA) of the weighted Unifrac distance representing the β diversity between fecal and rectal swab samples with visible fecal contents. E) Distance plots based on the weighted Unifrac distance of fecal and rectal swab samples according to group. Distances between fecal and rectal samples are lower within a marmoset compared to all other marmosets in the study (P value: <0.0001).
Fig 5
Fig 5. Computer simulated confirm significance of FVFM.
A) r2 values were simulated by omitting 10,000 combinations of five random samples from the dataset. B) A plot of r2 values vs the number of FVFM rectal swabs included in the data set reveals that the r2 values increased and were optimized with increased removal of FVFM samples.

References

    1. Marini RP, Wachtman LM, Tardif SD, Mansfield K, Fox JG. The Common Marmoset in Captivity and Biomedical Research. Academic Press; 2018.
    1. t Hart BA, Abbott DH, Nakamura K, Fuchs E. The marmoset monkey: a multi-purpose preclinical and translational model of human biology and disease. Drug Discovery Today. 2012;17: 1160–1165. 10.1016/j.drudis.2012.06.009 - DOI - PMC - PubMed
    1. Tardif SD, Mansfield KG, Ratnam R, Ross CN, Ziegler TE. The marmoset as a model of aging and age-related diseases. ILAR J. 2011;52: 54–65. 10.1093/ilar.52.1.54 - DOI - PMC - PubMed
    1. Nishijima K, Saitoh R, Tanaka S, Ohsato-Suzuki M, Ohno T, Kitajima S. Life span of common marmoset (Callithrix jacchus) at CLEA Japan breeding colony. Biogerontology. 6 ed. 2012;13: 439–443. 10.1007/s10522-012-9388-1 - DOI - PubMed
    1. Ridley RM, Baker HF, Windle CP, Cummings RM. Very long term studies of the seeding of β-amyloidosis in primates. J Neural Transm. 2005;113: 1243–1251. 10.1007/s00702-005-0385-2 - DOI - PubMed

Publication types