. 2019 Dec 5;134(23):2059-2069.
doi: 10.1182/blood.2019002206.

The microenvironmental niche in classic Hodgkin lymphoma is enriched for CTLA-4-positive T cells that are PD-1-negative

Affiliations

The microenvironmental niche in classic Hodgkin lymphoma is enriched for CTLA-4-positive T cells that are PD-1-negative

Sanjay S Patel et al. Blood. .

Abstract

Classic Hodgkin lymphoma (cHL) is a tumor composed of rare, atypical, germinal center-derived B cells (Hodgkin Reed-Sternberg [HRS] cells) embedded within a robust but ineffective inflammatory milieu. The cHL tumor microenvironment (TME) is compartmentalized into "niches" rich in programmed cell death-1 ligand (PD-L1)-positive HRS cells and tumor-associated macrophages (TAMs), which associate with PD-1-positive T cells to suppress antitumor immunity via PD-L1/PD-1 signaling. Despite the exquisite sensitivity of cHL to PD-1 checkpoint blockade, most patients eventually relapse and need therapeutic alternatives. Using multiplex immunofluorescence microscopy with digital image analysis, we found that cHL is highly enriched for non-T-regulatory, cytotoxic T-lymphocyte-associated protein 4 (CTLA-4)-positive T cells (compared with reactive lymphoid tissues) that outnumber PD-1-positive and lymphocyte-activating gene-3 (LAG-3)-positive T cells. In addition, T cells touching HRS cells are more frequently positive for CTLA-4 than for PD-1 or LAG-3. We further found that HRS cells, and a subset of TAMs, are positive for the CTLA-4 ligand CD86 and that the fractions of T cells and TAMs that are CTLA-4-positive and CD86-positive, respectively, are greater within a 75 μm HRS cell niche relative to areas outside this region (CTLA-4, 38% vs 18% [P = .0001]; CD86, 38% vs 24% [P = .0007]). Importantly, CTLA-4-positive cells are present, and focally contact HRS cells, in recurrent cHL tumors following a variety of therapies, including PD-1 blockade. These results implicate CTLA-4:CD86 interactions as a component of the immunologically privileged niche surrounding HRS cells and raise the possibility that patients with cHL refractory to PD-1 blockade may benefit from CTLA-4 blockade.


Figures

None
Graphical abstract
Figure 1.
Figure 1.
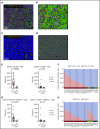
CTLA-4–positive T cells are enriched in cHL. (A-B) Representative mIF image of cHL (CHL9) [inset: CTLA-4–positive cells in contact with PAX5-positive HRS cells] and the cell segmentation and phenotype map for the same image (panel B) [purple, HRS; green, CTLA-4–positive/FOXP3-negative; red, CTLA-4–negative/FOXP3-positive; yellow, CTLA-4–positive/FOXP3-positive; dark gray, “other” cell]. (C-D) mIF image of interfollicular zone from representative RLT [inset: rare CTLA-4–positive/FOXP3-positive cells] and the cell segmentation and phenotype map for the same image (panel D) [green, CTLA-4–positive/FOXP3-negative; red, CTLA-4–negative/FOXP3-positive; yellow, CTLA-4–positive/FOXP3-positive; dark gray, “other” cell]. (E) The densities of CTLA-4–positive/CD4-positive (median, 1243 cells/mm2 vs 135 cells/mm2; P = .0004) and CTLA-4–positive/CD8-positive (median, 113 cells/mm2 vs 22 cells/mm2; P = .02) cells are greater in cHL than in RLTs. Each dot corresponds to the results of an individual case. (F) CTLA-4–positive fraction of total T cells (CD4-positive plus CD8-positive cells) is greater in cHL (32%; 6%-87%) compared with RLTs (2%; 0.4%-5%) [cHL vs RLT, P = .0002]. (G) The density of CTLA-4–positive/CD4-positive/FOXP3-positive cells is greater in cHL relative to RLT (median, 260 cells/mm2 vs 14 cells/mm2; P = .0032), whereas there is no significant difference in the density of CD8-positive/CTLA-4–positive/FOXP3-positive cells between groups (median, 11 cells/mm2 vs 9 cells/mm2; P > .05). Each dot corresponds to the results of an individual case. (H) FOXP3-positive fraction of total CTLA-4–positive T cells in cHL (25%; 0.07%-66%) and RLTs (31%; 0.15%-68%) [cHL vs RLT, P > .05]. Epstein-Barr virus (EBV)-positive cases are marked by asterisks. DAPI, 4′,6-diamidino-2-phenylindole; RLN, reactive lymph node; TS, tonsil.
Figure 2.
Figure 2.
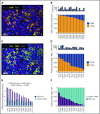
CTLA-4 is the predominant checkpoint on T cells in cHL, which are frequently negative for either PD-1 or LAG-3 and are often in direct contact with HRS cells. (A-B) Representative case of cHL (CHL5) including full field view (panel A) following cell segmentation and phenotyping (panel B) [purple, HRS; blue, B cell; green, CTLA-4–positive T cell; orange, LAG-3–positive T cell; yellow, PD-1–positive T cell; red, T-cell positive for multiple checkpoints; gray, triple-negative T cell; dark gray, “other” cell]. (C) Pooled cell counts (135 298 T cells) across all analyzed cases (n = 18) reveals that CTLA-4–positive cells (46 981) outnumber PD-1–positive (26 256) and LAG-3–positive (22 061) cells (58 349 T cells were negative for CTLA-4, PD-1, and LAG-3). (D) Focal view of a representative case (CHL5) showing examples of isolated CTLA-4–positive cells (single arrow) and PD-1/LAG-3 double-positive cells (double arrow). (E) Cell segmentation and phenotype map corresponding to panel D. Filled cell borders denote cells in direct contact with HRS cells, whereas skeletal cell borders denote cells not in contact with HRS cells [purple, HRS; blue, B cell; green, CTLA-4–positive T cell; orange, LAG-3–positive T cell; yellow, PD-1–positive T cell; red, T-cell positive for multiple checkpoints; gray, triple-negative T cell; dark gray, “other” cell]. (F) CTLA-4–positive cells (median, 28%; range, 8%-73%) comprise a greater fraction of T cells in direct contact with HRS cells than do PD-1–positive (median, 9%; range, 3%-66%) or LAG-3–positive (median, 14%; range, 0%-36%) cells [CTLA-4 vs PD-1, P = .09; CTLA-4 vs LAG-3, P = .02].
Figure 3.
Figure 3.
CD86 is uniformly and strongly expressed on HRS cells and also on a subset of TAMs. (A) Representative mIF image of a cHL case (CHL24) [inset: PAX5-positive HRS cells with strong CD86 expression]. (B) HRS cells are predominantly CD86-positive (median, 86%; range, 65%-100%) [overlay, density of HRS cells across analyzed cases; median, 243/mm2; range, 55-548/mm2]. (C) Representative mIF image of a cHL case (CHL24) showing weakly CD86-positive TAMs (arrows) [inset, PAX5-positive HRS cells with strong CD86 expression next to CD68-positive TAMs with weaker CD86 expression]. (D) A subset of CD68-positive TAMs is CD86-positive in each case (median, 32%; range, 12%-79%) [overlay, density of TAMs across analyzed cases; median, 1236/mm2; range, 261-2,670/mm2]. (E) CD86 expression is higher on HRS cells (median of mean cell membrane intensity, 4.5; range, 1.7-7.2) than on TAMs (median of mean cell membrane intensity, 1.8; range 1.1-3.1) in each case of cHL (HRS vs TAM, P = .0007). (F) Contribution of cellular CD86 expression in cHL attributable to HRS cells (median, 27%; range, 2%-73%) and to TAMs (median, 73; range, 27%-98%). EBV-positive cases are marked by asterisks. DAPI, 4′,6-diamidino-2-phenylindole.
Figure 4.
Figure 4.
Macroscopic view showing zonal distribution of CTLA-4–positive cells, HRS cells, and CD86-positive cells. (A) Four 20× fields of view merged to form a macroscopic mIF image from a representative case of cHL (CHL12). (B) Phenotypic cell fraction represented as a spatially distributed heatmap for HRS cells. (C) Phenotypic cell fraction represented as a spatially distributed heatmap for CD86-positive cells. (D) Composite heatmap for HRS cells and CD86-positive cells (purple, colocalization of HRS cells and CD86-positive cells) overlaid on the original mIF image in panel A. (E) Phenotypic cell fraction represented as a spatially distributed heatmap for CTLA-4–positive cells. (F) Composite of heatmaps for HRS cells and CTLA-4–positive cells (yellow, colocalization of HRS cells and CTLA-4–positive cells) overlaid on the original mIF image (from panel A). The color intensities for each heatmap were determined by calculating percentage of cells with the given phenotype among all cells within a 49.6 µm radius distance of the centroid of each hexagon. DAPI, 4′,6-diamidino-2-phenylindole.
Figure 5.
Figure 5.
The HRS cell microenvironmental niche is enriched for CTLA-4–positive cells and CD86-positive TAMs. (A-C) Schematic showing generation of “HRS proximal” and distal regions in the representative case shown in Figure 4 (CHL12). (D) The HRS proximal region is enriched for T cells that are CTLA-4–positive (median percentage positive, 38%; range, 3%-84%) in each individual case, and across cases, relative to the distal region (median, 18%; range, 2%-53%; P = .0001). (E) The HRS proximal region is enriched for CD68-positive TAMs that are CD86-positive (median percentage positive, 38%; range, 22%-91%) in each individual case, and across cases, relative to the distal region (median percentage positive, 24%; range, 0%-69%; P = .0007). (F) The CD86-positive TAMs within 75 μm of HRS cells were predominantly PD-L1–positive (median percentage positive, 92%; range, 52%-99%) (PD-L1–positive vs PD-L1–negative, P = .002). EBV-positive cases are marked by asterisks.
Figure 6.
Figure 6.
CTLA-4–positive cells are present after anti–PD-1 immunotherapy and focally contact HRS cells. Representative mIF images of core tissue biopsy samples from 3 patients with recurrent cHL after anti–PD-1 immunotherapy (A-C), from 1 patient after doxorubicin, bleomycin, vinblastine, and dacarbazine therapy (ABVD) (D), and from 1 patient after SCT (E), and showing the presence of CTLA-4–positive cells, including CTLA-4–positive T cells focally in contact with CD86-positive/PAX5-positive HRS cells. (F) Relapsed cHL cases (n = 18) have a large portion of HRS cells in contact with CTLA-4–positive cells (median, 54%; range, 13%-98%); this is greater (Mann-Whitney U test, P = .11) than the portion of HRS cells in contact with CTLA-4–positive cells among diagnostic cases (n = 20; median, 40%; range, 7%-76%). DAPI, 4′,6-diamidino-2-phenylindole.
Figure 7.
Figure 7.
Model of PD-1:PD-L1 and CTLA-4:CD86 interactions in cHL. HRS cells (purple) express PD-L1 (and PD-L2) and CD86. TAMs (blue) that are in proximity to HRS cells frequently coexpress both PD-L1 and CD86, likely in response to local cytokine production, and thereby significantly increase the total amount of these ligands in proximity to the malignant cells. PD-L1 and CD86 on TAMs and HRS cells are available to bind PD-1–positive/CD4-positive T cells (green) and CTLA-4–positive/CD4-positive T cells (yellow). PD-1–positive T cells (previously shown) and CTLA-4–positive T cells are specifically enriched in the vicinity of PD-L1–positive/CD86-positive HRS cells.

References

    1. Swerdlow SH, Campo E, Harris NL, et al. . WHO Classification of Tumours of Haematopoietic and Lymphoid Tissues. Revised 4th Edition Lyon, France: IARC; 2017.
    1. Green MR, Monti S, Rodig SJ, et al. . Integrative analysis reveals selective 9p24.1 amplification, increased PD-1 ligand expression, and further induction via JAK2 in nodular sclerosing Hodgkin lymphoma and primary mediastinal large B-cell lymphoma. Blood. 2010;116(17):3268-3277. - PMC - PubMed
    1. Roemer MGM, Advani RH, Ligon AH, et al. . PD-L1 and PD-L2 genetic alterations define classical Hodgkin lymphoma and predict outcome. J Clin Oncol. 2016;34(23):2690-2697. - PMC - PubMed
    1. Roemer MGM, Advani RH, Redd RA, et al. . Classical Hodgkin lymphoma with reduced β2M/MHC Class I expression is associated with inferior outcome independent of 9p24.1 status. Cancer Immunol Res. 2016;4(11):910-916. - PMC - PubMed
    1. Chen BJ, Chapuy B, Ouyang J, et al. . PD-L1 expression is characteristic of a subset of aggressive B-cell lymphomas and virus-associated malignancies. Clin Cancer Res. 2013;19(13):3462-3473. - PMC - PubMed

Publication types