. 2020 Jan 2;135(1):41-55.
doi: 10.1182/blood.2019002220.

Therapy-induced mutations drive the genomic landscape of relapsed acute lymphoblastic leukemia

Affiliations

Therapy-induced mutations drive the genomic landscape of relapsed acute lymphoblastic leukemia

Benshang Li et al. Blood. .

Abstract

To study the mechanisms of relapse in acute lymphoblastic leukemia (ALL), we performed whole-genome sequencing of 103 diagnosis-relapse-germline trios and ultra-deep sequencing of 208 serial samples in 16 patients. Relapse-specific somatic alterations were enriched in 12 genes (NR3C1, NR3C2, TP53, NT5C2, FPGS, CREBBP, MSH2, MSH6, PMS2, WHSC1, PRPS1, and PRPS2) involved in drug response. Their prevalence was 17% in very early relapse (<9 months from diagnosis), 65% in early relapse (9-36 months), and 32% in late relapse (>36 months) groups. Convergent evolution, in which multiple subclones harbor mutations in the same drug resistance gene, was observed in 6 relapses and confirmed by single-cell sequencing in 1 case. Mathematical modeling and mutational signature analysis indicated that early relapse resistance acquisition was frequently a 2-step process in which a persistent clone survived initial therapy and later acquired bona fide resistance mutations during therapy. In contrast, very early relapses arose from preexisting resistant clone(s). Two novel relapse-specific mutational signatures, one of which was caused by thiopurine treatment based on in vitro drug exposure experiments, were identified in early and late relapses but were absent from 2540 pan-cancer diagnosis samples and 129 non-ALL relapses. The novel signatures were detected in 27% of relapsed ALLs and were responsible for 46% of acquired resistance mutations in NT5C2, PRPS1, NR3C1, and TP53. These results suggest that chemotherapy-induced drug resistance mutations facilitate a subset of pediatric ALL relapses.


Conflict of interest statement

Conflict-of-interest disclosure: B.J.R. is a consultant at and has ownership interest in (including stock and patents) Medley Genomics. H.S. and L.S. are employees of WuXi NextCODE Co., Ltd. The remaining authors declare no competing financial interests.

Figures

None
Graphical abstract
Figure 1.
Figure 1.
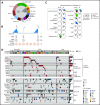
Relapse-enriched somatic variants in pediatric ALL. (A) ALL subtypes of the patient cohort. The number of cases in each subtype and in B- or T-lineage is labeled in the outer and the inner circles, respectively. Subtypes of singleton cases are binned to B/Other (IGH-MYC and hypodiploid) or T/Other (HOXA). D, diagnosis; R, relapse. (B) Schematic showing sequencing performed and number of patients (n) sequenced with each platform. (C) Pathways mutated among shared variants (diagnosis and relapse [D+R]) compared with relapse-specific variants (R); pathways are defined in supplemental Table 5. Color indicates mutation type identified in a single patient; box indicates pathways enriched at relapse. Slice width represents the proportion of patients with mutation of at least 1 gene in indicated pathway. (D) Heatmap of significantly mutated genes and known driver genes across the cohort, with genes in rows and patients in columns. The 12 genes at top are those enriched specifically among relapse-specific variants (supplemental Methods), and genes in the bottom portion are frequently present at both diagnosis and relapse. At right, a bar plot of the percentage of patients mutated for each gene is shown, along with the pathway to which the gene belongs. Gray indicates that the mutation is shared at diagnosis and relapse (D+R), red indicates relapse-specific (R), and blue indicates diagnosis-specific (D). Subtypes and B- vs T-lineage are indicated at top. CDKN2A mutations occurred in 49% of samples, which is above the axis limit.
Figure 2.
Figure 2.
Functional characterization of relapse-specific mutations. (A) Top, relapse-specific NR3C1 mutation locations within the NR3C1 protein, with the x-axis indicating amino acid position. Bottom, their effects on NR3C1 transcriptional activator activity (left) and ALL sensitivity to glucocorticoids (right). Left, mutant, wild-type (WT), and empty vector (EV) transcription activator activity was measured in HEK293T cells by using the reporter gene assay. Mutations are grouped and color-coded according to their locations in protein domains. Right, glucocorticoid sensitivity (ie, dose–response curve) was measured by using cell viability after treatment with prednisolone for 72 hours in ALL cell line REH expressing WT or mutant NR3C1 (color-coded according to protein domain), using the MTT assay. The y-axis represents percent cell viability compared with untreated control. Error bars indicate standard error. (B) Top, FPGS relapse-specific mutations. Bottom, their effects on polyglutamation enzymatic activity using MTX as the substrate. Purified mutant and WT FPGS were tested at 3 different amounts (5 ng, 2.5 ng, or 1.25 ng) in triplicate, and the enzymatic activity was relative to the activity of the WT at 5 ng. The first 2 columns represent controls with no MTX or FPGS. Error bars represent standard error. (C) Top, NT5C2 relapse-specific mutations. Bottom, cell viability of REH or Nalm6 cells treated with 6-thioguanine (6-TG, left) or 6-mercaptopurine (6-MP, right) in cells expressing indicated NT5C2 mutations (or WT NT5C2 or uninfected control [-]). Error bars represent standard deviation. (D) Top, TP53 relapse-specific mutations. Bottom, functional validation of TP53 R248Q and R196G. Nalm6 cells underwent TP53 knockout (KO) by CRISPR and were reintroduced with TP53 WT, R196G, or the known hotspot R248Q mutant. Left, cell viability in response to idarubicin and vincristine treatment. Right, fold change in proportion of Annexin V–positive apoptotic cells (top) and in proportion of EdU+ cells in S phase (bottom; values <1.0 indicate G1/S checkpoint arrest induced by functional p53 in response to treatment), compared with untreated controls, after treatment with 1 µM (top) or 0.01 µM (bottom) idarubicin for 24 hours. Error bars represent standard deviation. Dotted line in right panels represents 1.0. Protein domains are as reported on pecan.stjude.cloud (A,D), National Center for Biotechnology Information (B), or Dieck et al (C).
Figure 3.
Figure 3.
Evidence of preexisting and later-appearing resistant clones. Panels A and B include B-ALL samples; panels C through E include both B- and T-ALL samples. (A) Histogram (top) indicates the distribution of relapse times across B-ALL samples in the cohort (50-day bins) together with kernel density estimation (gray line). Arrows indicate predicted relapse time of 95% of the B-ALL cohort given a single preexisting resistant cell and a doubling time of 5, 6, 7, 8, or 9 days. Purple indicates very early relapses (<9 months from diagnosis), likely relapsing due to a preexisting resistant clone (schematic at bottom). Yellow represents early relapses (9-36 months), which appear at times consistent with postdiagnosis appearance of the resistant clone from a persister clone that survives initial treatment (bottom), or delayed growth (≥9-day doubling time) of a preexisting clone. Blue represents late relapses (>36 months) appearing after the time treatment had ended on all protocols (3 years, “treatment end” bar). These clones may have survived treatment without outright resistance and relapse at times consistent with resumption of proliferation at treatment cessation. “Survival” (blue circles) and “resistance” (red circles) represent mutations conferring these phenotypes. (B) Percentage of very early, early, or late B-ALL relapses consistent only with the preexisting resistant subclone scheme. The percentages are calculated based on projected relapse times when the doubling time of the resistant clone is 5, 6, 7, 8, or 9 days (shown in arrows in panel A at top); if a sample relapsed before that projected time, it was considered preexisting. (C) Distribution of relapse-enriched variants in the 3 patient groups with very early (<9 months), early (9-36 months), and late (>36 months) relapse. D indicates diagnosis-specific variants, R indicates relapse-specific, and D+R indicates shared. Also shown are the mutation burden (panel D) and number of SVs (panel E) at diagnosis (D) and relapse (R) in the 3 groups along with P values from the 2-sided Wilcoxon rank sum test for D vs R. Variants at D or R in panels D and E included shared variants.
Figure 4.
Figure 4.
Evolution of mutational signatures from diagnosis to relapse. (A) Contribution of known COSMIC signatures and 2 novel relapse-specific signatures to somatic SNVs identified in the matched diagnostic (top) or relapse (bottom) samples of patients in the 3 relapse time categories. Samples are sorted according to increasing relapse time from left to right. Relapse-specific mutations in DNA mismatch repair genes (ie, MSH2, MSH6, or PMS2) are indicated at bottom; samples with bi-allelic mutations are marked by a star. MMR indicates mismatch repair deficiency-associated signatures. (B) Trinucleotide mutation spectra of novel signatures A and B, with the contexts of selected example relapse-specific gene variants indicated.
Figure 5.
Figure 5.
Causes and consequences of the 2 novel mutational signatures. (A) Detection of novel signatures in additional cohorts of primarily diagnosis (black text) or relapse (blue text) samples. Number of tumor samples is indicated in parentheses. Heatmap at bottom depicts percentage of patients receiving indicated therapy in the relapsed cohort. anthracyc., anthracyclines; cyclophosph., cyclophosphamide; thiop., thiopurines; metho., methotrexate. P is by Fisher’s exact test. PCAWG, Pan-Cancer Analysis of Whole Genomes. Shanghai refers to our cohort. Asterisk indicates that a subset of relapsed AMLs from TARGET (14 of 95) received thiopurines but only for ≤2 weeks, an insufficient time to generate the signature as shown in panel B, as part of the CCG-2961 trial. (B) Left, correlation between relapse time and novel signature B strength. Blue indicates approximate time periods of thiopurine treatment in 17 cases for which detailed clinical information was available; treatment end is indicated as 3 years as all patients ended treatment by that time (see supplemental Methods); r is Pearson correlation coefficient excluding novel signature A/B–positive (double-positive) cases (2 red points), which are also excluded from the indicated regression line. Right, TPMT expression based on RNA-Seq of diagnosis samples of novel signature B–negative or signature B–positive patients; P value is by 2-sample Student t test. (C) Mutational spectra of two MCF10A single-cell clones after treatment with 6-thioguanine 10 nM for 7 weeks. The y-axis represents the number of mutations in the treated clone minus the background mutation spectra averaged from 2 untreated single-cell clones. Bottom shows novel signature B; “cosine” indicates cosine similarity for indicated comparisons, and "prop. SNVs" indicates proportion of SNVs. Light vertical lines mark novel signature B–preferred trinucleotide mutation types for comparison. (D) Relapse-specific pathogenic mutations with ≥50% probability to be caused by the novel signatures at relapse. The y-axis represents the probability each variant was caused by a given signature, and each variant represents a relapse-specific mutation detected in a specific patient. Mutations in the same patient are shown as rectangles joined by lines (top). “S261 sp” represents a TP53 variant (chr17:7 577 157, T>G) likely affecting splicing, and the T125T variant also affects splicing.
Figure 6.
Figure 6.
Serial sample analysis reveals dynamics of resistant clone evolution. Graphical representations (“fish plots”) of clonal evolution shaped by chemotherapy based on ultra-deep sequencing in patients SJALL040461 (A), SJALL018372 (B), and SJALL040462 (C). Treatment history is shown at the top, with drug treatment periods indicated by colors. 6-MP, 6-mercaptopurine; 6-TG, 6-thioguanine. MTX was given weekly during maintenance and is only shown at the beginning of a regimen during maintenance. Clonal evolution is shown in the middle with the vertical axis representing proportion of cells; normal cells are represented by white space. ALL clones are indicated in colors by representative mutations listed below. The minimum tumor purity values (thin line) indicate no detectable ALL cells by ultra-deep sequencing, and their clonal compositions at these times are inferred. Days from diagnosis are indicated at the bottom, with tick marks indicating time points at which samples were sequenced. Samples sequenced by WGS are indicated by black text and tick marks on x-axes, whereas samples with targeted deep sequencing only are shown in gray. In panels B and C, multiple independent CDKN2A deletions are indicated by CDKN2A SV #1, SV #2, and so forth. Variants with alternative possible clonal parentage are indicated by blue asterisks (B). In panel B, the VAF of NT5C2 D407 > DRD at day 322 is 0.007%, but it is shown as larger to enable visualization. In panel C, the surviving clones at days 108 and after are descended from the KMD4B (gray) clone; the KDM4B descendant PCDHGA7 (light-blue) clone and its descendants are dominant at day 356.
Figure 7.
Figure 7.
Comparison of different clonal evolution models leading to relapse. Clones are represented as in the fish plots in Figure 6, and time goes from left to right from time of disease initiation to relapse. Clone sizes are represented in the vertical direction. Chemotherapy-sensitive clones are indicated in gray, chemotherapy-resistant in red, and persistent clones (able to survive but not proliferate during chemotherapy) in blue. The time of diagnosis and treatment commencement are indicated by a dotted line. (A) The de novo resistance scenario, in which most cells are chemoresistant up-front and remission is never achieved; this was not observed in our cohort. (B) The chemo-selection scenario, in which a minor drug-resistant subclone survives chemotherapy and leads to relapse after an initial remission. Our mathematical modeling suggests that very early relapses (<9 months) are likely due to this mechanism. (C) The chemo-induced mutation scenario, in which no fully resistant subclone is present at the time of diagnosis. The drug-resistant subclone is derived from a population of cells that persisted (survived) during chemotherapy treatment but was not fully drug resistant because it could not actively proliferate sufficiently to cause relapse. This is supported by mutational signature and mathematical modeling in later relapse groups (specifically, the early and late relapse groups).

Comment in

References

    1. Pui CH, Yang JJ, Bhakta N, Rodriguez-Galindo C. Global efforts toward the cure of childhood acute lymphoblastic leukaemia. Lancet Child Adolesc Health. 2018;2(6):440-454. - PMC - PubMed
    1. Ribeiro RC, Antillon F, Pedrosa F, Pui CH. Global pediatric oncology: lessons from partnerships between high-income countries and low- to mid-income countries. J Clin Oncol. 2016;34(1):53-61. - PMC - PubMed
    1. Bhojwani D, Pui CH. Relapsed childhood acute lymphoblastic leukaemia. Lancet Oncol. 2013;14(6):e205-e217. - PubMed
    1. Mullighan CG, Zhang J, Kasper LH, et al. CREBBP mutations in relapsed acute lymphoblastic leukaemia. Nature. 2011;471(7337):235-239. - PMC - PubMed
    1. Li B, Li H, Bai Y, et al. Negative feedback-defective PRPS1 mutants drive thiopurine resistance in relapsed childhood ALL. Nat Med. 2015;21(6):563-571. - PMC - PubMed

Publication types

MeSH terms