. 2019 Nov 6;8(11):1397.
doi: 10.3390/cells8111397.

Hypoxia and EGF Stimulation Regulate VEGF Expression in Human Glioblastoma Multiforme (GBM) Cells by Differential Regulation of the PI3K/Rho-GTPase and MAPK Pathways

Affiliations

Hypoxia and EGF Stimulation Regulate VEGF Expression in Human Glioblastoma Multiforme (GBM) Cells by Differential Regulation of the PI3K/Rho-GTPase and MAPK Pathways

Samer Nicolas et al. Cells. .

Abstract

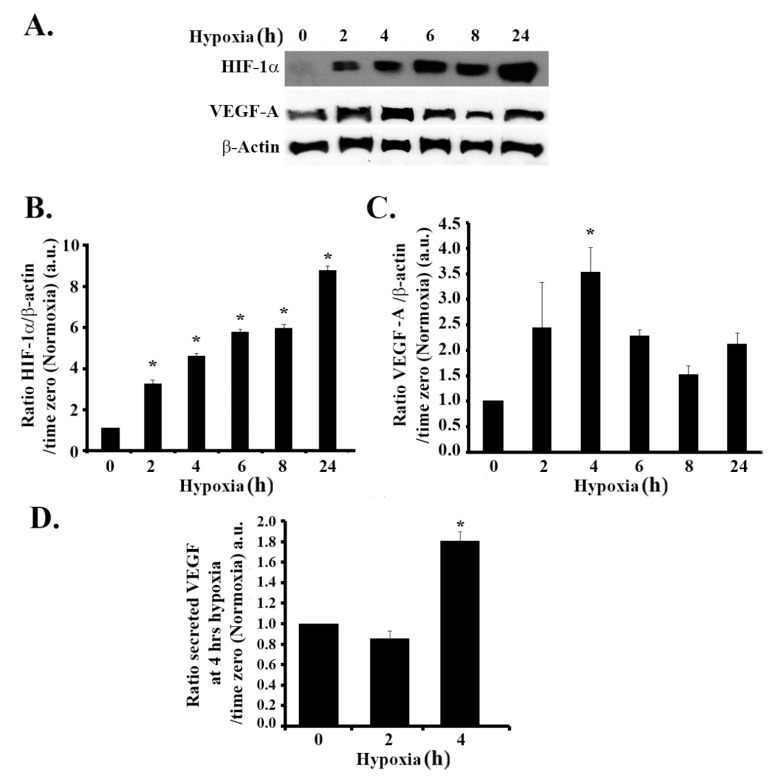
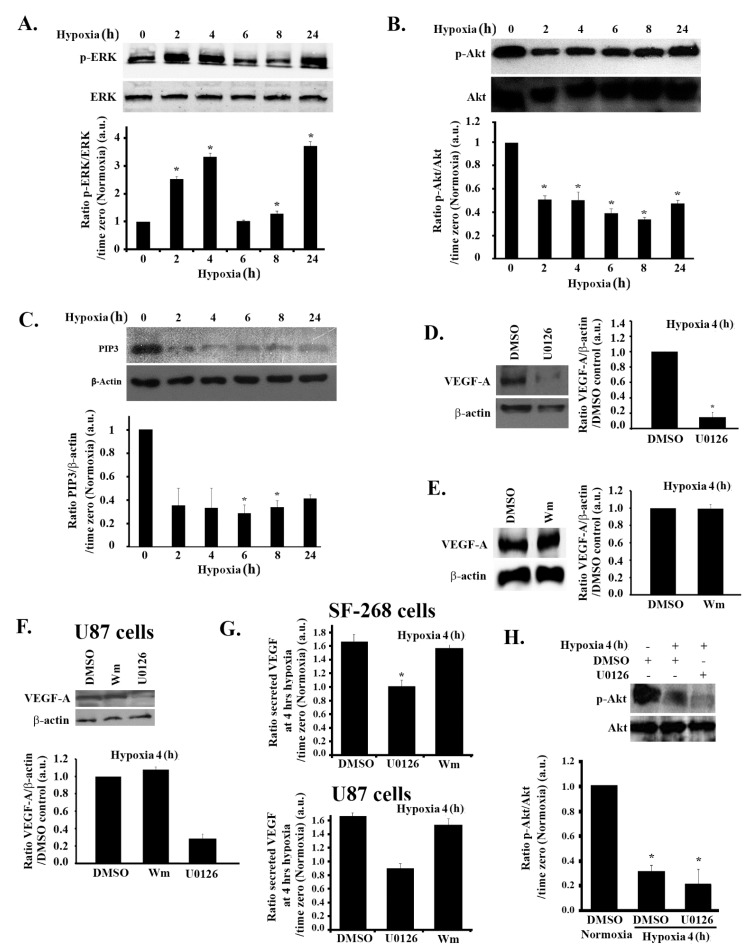
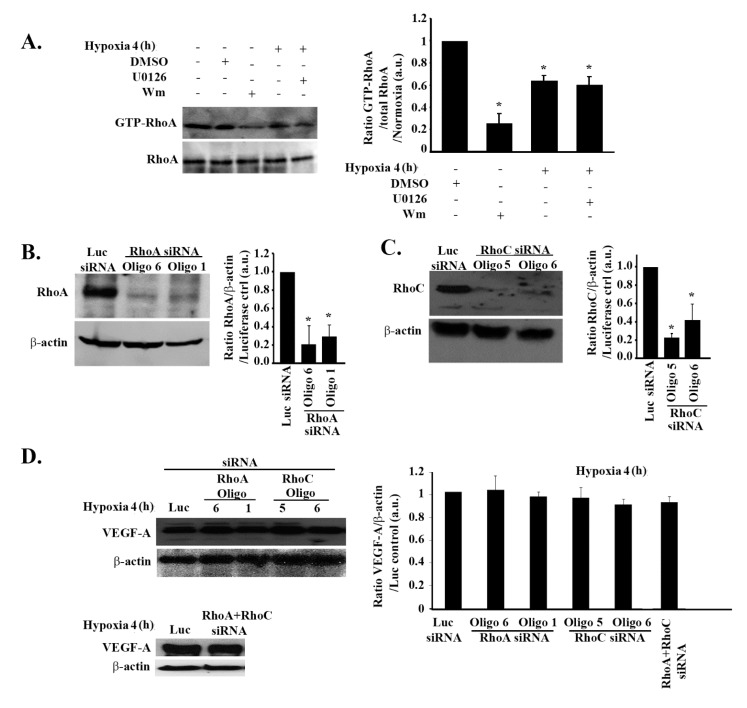
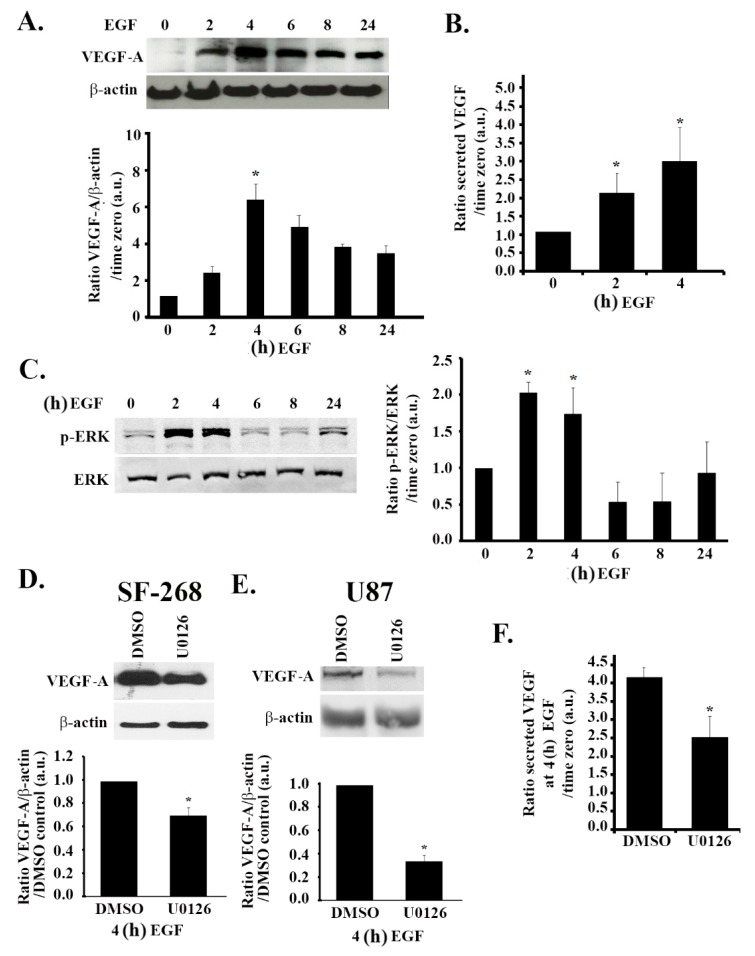
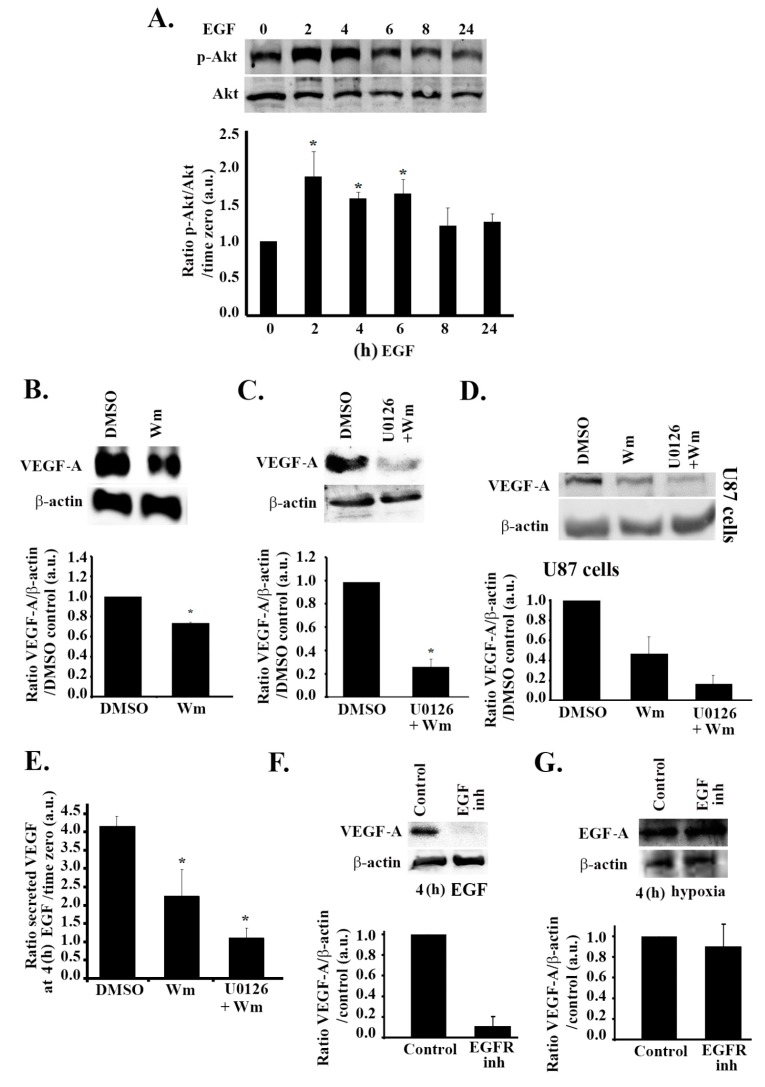
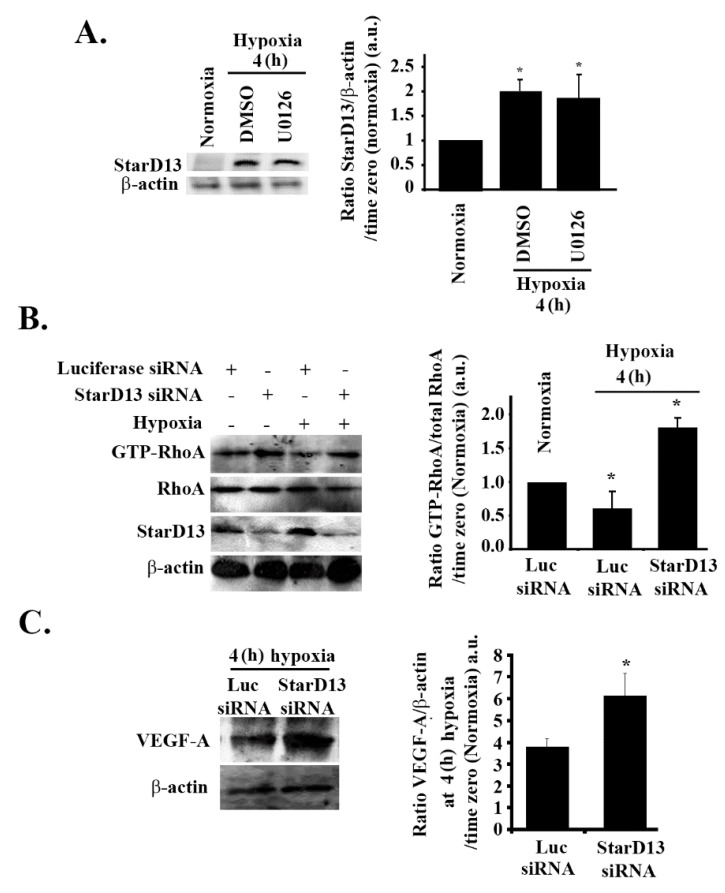
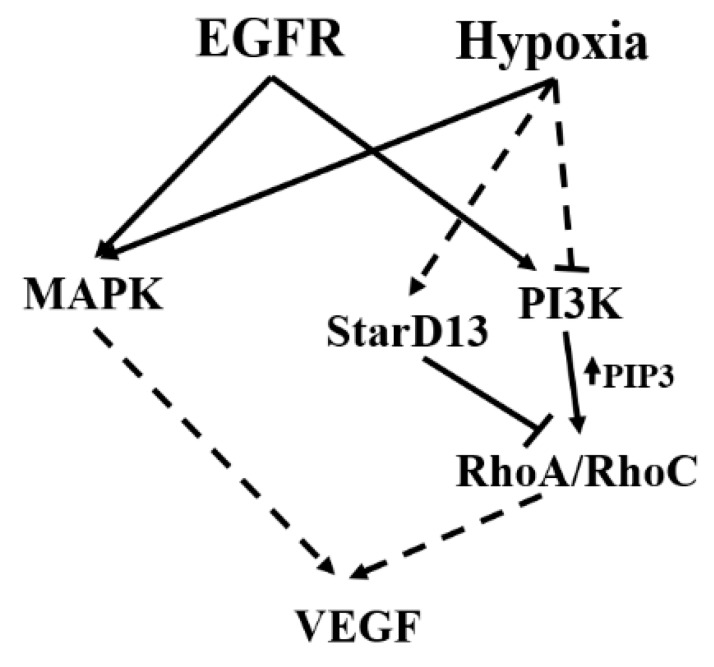
Glioblastoma multiforme (GBM) is one of the most common and deadly cancers of the central nervous system (CNS). It is characterized by the presence of hypoxic regions, especially in the core, leading to an increase in vascularity. This increased vascularization is driven by the expression of the major angiogenic inducer VEGF and the indirect angiogenic inducer Epidermal growth factor (EGF), which stimulates VEGF expression. In this study, we examine the regulation of VEGF by both hypoxia and the EGF signaling pathway. We also examine the involvement of pathways downstream from EGF signaling, including the mitogen-activated protein kinase/extracellular regulated kinase (MAPK/ERK) pathway and the Phosphatidylinositol-3-kinase/RhoA/C (PI3K/RhoA/C) pathway in this regulation. Our results show that VEGF expression and secretion levels increase following either hypoxia or EGF stimulation, with the two stimuli signaling in parallel. We also observed an increase in ERK and protein kinase B (Akt) phosphorylation, in response to EGF stimulation, with kinetics that correlated with the kinetics of the effect on VEGF. Using pharmacological inhibitors against ERK and PI3K and small interfering RNAs (siRNAs) against RhoA and RhoC, we found that both the ERK and the PI3K/RhoA/C pathways have to cooperate in order to lead to an increase in VEGF expression, downstream from EGF. In response to hypoxia, however, only ERK was involved in the regulation of VEGF. Hypoxia also led to a surprising decrease in the activation of PI3K and RhoA/C. Finally, the decrease in the activation of these Rho-GTPases was found to be mediated through a hypoxia-driven overexpression of the Rho-GTPase GTPase activating protein (GAP), StarD13. Therefore, while under normoxic conditions, EGF stimulates the activation of both the PI3K and the MAPK pathways and the induction of VEGF, in glioblastoma cells, hypoxic conditions lead to the suppression of the PI3K/RhoA/C pathway and an exclusive switch to the MAPK pathway.

Keywords: EGF; MAPK; PI3K; Rho-GTPases; VEGF; glioblastoma; hypoxia.


Conflict of interest statement

The authors declare no competing interests.

Figures

Figure 1
Figure 1
Hypoxia mimicking increases the expression of hypoxia-inducible factor (HIF-1a) and the expression and secretion of vascular endothelial growth factor (VEGF) in glioblastoma cells. (A) SF-268 cells subjected to hypoxia using cobalt(II) chloride hexahydrate (CoCl2) up to 24 h. The total cell lysates were collected at different time intervals (2, 4, 6, 8, and 24 h post hypoxia or normoxia), as indicated, and the samples were blotted against HIF-1α, VEGF-A, or β-actin antibodies. Quantitation of HIF-1α (B) or VEGF-A (C) using ImageJ. The bands were normalized to β- actin and expressed as fold change compared to the control (normoxia). (D) SF-268 cells were subjected to hypoxia using cobalt(II) chloride hexahydrate (CoCl2) for 2 or 4 h or left in normoxic conditions. The supernatant was collected and measured for VEGF-A secretion (compared to standards) according to the manufacturer’s guidelines (described in Section 2). The data are means ± standard error of the mean (SEM) from three different experiments (n = 3); * p < 0.05 indicates statistically significant differences.
Figure 2
Figure 2
Hypoxia-induced increase in VEGF expression is ERK-dependent but PI3K-independent in glioblastoma cells. (A/B/C) SF-268 cells were subjected to hypoxia using cobalt(II) chloride hexahydrate (CoCl2) for the indicated time. Cells were then lysed, and the lysates were blotted for p-ERK and ERK (A) and p-Akt and Akt (B), as well as PIP3 and β-actin for loading control (C). The graphs in each panel are densitometric analysis of the Western blots using Image J. Values are normalized to the loading control (ERK, Akt, and β-actin for p-ERK, p-Akt, and PIP3, respectively) and expressed as fold change compared to time zero (normoxia). (D/E) SF-268 cells were treated with 50 μM U0126 (with DMSO as a carrier) for 24 h (D) or with wortmannin 100 nM (Wm) (with DMSO as a carrier) for 4 h (E) or with DMSO as a control. Cells were then subjected to 4 h hypoxia and lysed, and cell lysates were blotted for VEGF-A or β-actin for loading control. The graphs are quantitations for the VEGF bands in (D/E) normalized to actin and expressed as fold change compared to control (DMSO). (F) U87 cells were treated with 50 μM U0126 for 24 h or with wortmannin 100 nM (Wm) for 4 h (with DMSO as a carrier). Cells were then subjected to 4 h hypoxia and lysed, and cell lysates were blotted for VEGF-A or β-actin for loading control. The graphs are quantitations for the VEGF bands in (F) normalized to actin and expressed as fold change compared to control (DMSO). (G) ELISA for supernatants from SF-268 cells (upper graph) or U87 cells (lower graph), treated with U0126 or wortmannin or DMSO alone and then kept in normoxia or subjected to 4 h hypoxia. Supernatants were collected and measured for VEGF-A secretion according to the manufacturer’s guidelines. Values are expressed as fold change at every treatment to normoxia. (H) (+ indicates addition of the treatment) SF-268 cells were treated with DMSO or with 50 μM U0126 for 24 h, subjected to hypoxia for 4 h. Cells were then lysed, and the lysates were blotted for p-Akt and Akt. The graph is a quantitation of the gels. Values are normalized to Akt and expressed as fold change compared to control (normoxia + DMSO alone). The data are means ± SEM from three different experiments; * p < 0.05 indicates statistically significant differences.
Figure 3
Figure 3
Hypoxia-induced increase in VEGF expression is independent of RhoA and RhoC in glioblastoma cells. (A) (+ indicates addition of the treatment) SF-268 cells were treated with DMSO alone or U0126 or Wm, subjected to hypoxia for 4 h, or left in normoxia and lysed. The lysates were then subjected to a RhoA pull-down assay. The upper gel shows the active (GTP-loaded) RhoA that was pulled down with the GST-RBD beads blotted with anti-RhoA, and the lower gel shows the total lysates blotted for anti-RhoA for loading control. The graph is a quantitation of the bands in the upper gel normalized to total RhoA and expressed as fold change compared to time zero (normoxia). (B/C) SF-268 cells were transfected with luciferase siRNA for control of with two RhoA small interfering RNA (siRNA) oligos (oligos 6 and 1) (B) or two RhoC siRNA oligos (oligos 5 and 6) (C) for 72 h. Cells were then lysed, and cell lysates were blotted for RhoA or β-actin for loading control (B) or RhoC and β-actin (C). The graphs are quantitations of the bands in (B/C) normalized to actin and expressed as fold change compared to luciferase siRNA control. (D) SF-268 cells were transfected with different siRNA oligos as indicated (or doubly transfected with RhoA and RhoC siRNA for double knock down; lower gel), then subjected to 4 h hypoxia or kept in normoxia. Cells were then lysed, and cell lysates were blotted for VEGF-A or β-actin for loading control. The graphs are quantitations of the VEGF bands normalized to actin and expressed as fold change compared to control (luciferase siRNA). The data are means ± SEM from three different experiments (n = 3); * p < 0.05 indicates statistically significant differences.
Figure 4
Figure 4
EGF-induced increase in VEGF expression and secretion is ERK-dependent. (A/C) SF-268 cells were starved in serum-free media for 3 h, then stimulated with 15 nM EGF for the indicated times. Cells were then lysed, and the lysates were blotted for VEGF-A and β-actin (A) or p-ERK and ERK (C). The graphs in each panel are densitometric analysis of the Western blots using Image J. Values are normalized to the loading control (β-actin and ERK for VEGF and p-ERK, respectively) and expressed as fold change compared to time zero (− EGF). (B) ELISA for supernatants from SF-268 cells treated with EGF for 2 or 4 h or left untreated and measured for VEGF-A secretion according to the manufacturer’s guidelines. Values are expressed as fold change compared to time zero. (D) SF-268 cells were treated with 50 μM U0126 for 24 h (with DMSO as carrier). Cells were then treated with 15 nM EGF for 4 h and lysed, and cell lysates were blotted for VEGF-A or β-actin for loading control. The graphs are quantitations of the VEGF bands normalized to actin and expressed as fold change compared to control (DMSO). E) U87 cells were treated with 50 μM U0126 for 24 h (with DMSO as a carrier). Cells were then treated with 15 nM EGF for 4 h and lysed, and cell lysates were blotted for VEGF-A or β-actin for loading control. The graphs are quantitations of the VEGF bands normalized to actin and expressed as fold change compared to control (DMSO). (F) Supernatants from SF-268 cells treated with U0126 or DMSO alone and then treated with EGF for 4 h (after 3 h starvation) were collected and measured for VEGF-A secretion according to the manufacturer’s guidelines. Values are expressed as fold change at every treatment to time zero (− EGF). The data are means ± SEM from three different experiments; * p < 0.05 indicates statistically significant differences.
Figure 5
Figure 5
EGF stimulation leads to an increase in VEGF expression and secretion through PI3K and ERK in parallel to hypoxia. (A) SF-268 cells were starved in serum-free media for 3 h, then stimulated with 15 nM EGF for the indicated times. Cells were then lysed, and the lysates were blotted for p-Akt and Akt. The graph is a densitometric analysis of the Western blots using Image J. Values are normalized to Akt and expressed as fold change compared to time zero (− EGF). (B/C) SF-268 cells were treated with either DMSO alone or Wm (100 nM) (B) or with DMSO alone or U0126 (50 μM) + Wm (100 nM) (C). Cells were then treated with 15 nM EGF for 4 h (treatment detailed in Section 2) and lysed, and cell lysates were blotted for VEGF-A or β-actin for loading control. The graphs are quantitations of the VEGF bands normalized to actin and expressed as fold change compared to control (DMSO). (D) U87 cells were treated with either DMSO alone or Wm (100 nM) or U0126 (50 μM) + Wm (100 nM), treated with 15 nM EGF for 4 h (treatment detailed in Section 2), and lysed, and cell lysates were blotted for VEGF-A or β-actin for loading control. The graphs are quantitations of the VEGF bands normalized to actin and expressed as fold change compared to control (DMSO). (E) Supernatants from SF-268 cells treated with DMSO alone, Wm alone, or Wm + U0126 and then treated with EGF for 4 h (after 3 h starvation) were collected and measured for VEGF-A secretion according to the manufacturer’s guidelines. Values are expressed as fold change at every treatment to time zero (− EGF). (F) SF-268 cells were treated with 10 μM EGFR inhibitor AG1478 or left untreated, and then treated with EGF for 4 h. Cells were then lysed and blotted with anti-VEGF-A and anti-β-actin. The graph is a quantitation where the values were normalized to actin and expressed as fold change compared to control (− AG1478). (G) SF-268 cells were treated with 10 μM EGFR inhibitor AG1478 or left untreated and then subjected to 4 h hypoxia, or left in normoxia. Cells were then lysed and blotted with anti-VEGF-A and anti-β-actin. The graph is a quantitation where the values were normalized to actin and expressed as fold change compared to control (− AG1478). The data are means ± SEM from three different experiments; * p < 0.05 indicates statistically significant differences.
Figure 6
Figure 6
RhoA and RhoC mediate PI3K-regulated increase in VEGF expression and secretion in response to EGF stimulation in glioblastoma cells. (A) (+ indicates addition of the treatment) SF-268 cells were starved in serum-free media, then stimulated with 15 nM EGF for 4 h and treated with DMSO alone, U0126 (50 μM), or Wm (100 nM) (treatment sequence explained in Section 2). The lysates were then subjected to a RhoA pull-down assay. The upper gel shows the active (GTP-loaded) RhoA that was pulled down with the GST-RBD beads blotted with anti-RhoA, and the lower gel shows the total lysates blotted for anti-RhoA for loading control. The graph is a quantitation of the bands in the upper gel normalized to total RhoA and expressed as fold change compared to time zero (− EGF). (B) SF-268 cells were transfected with different siRNA oligos as indicated, starved, and stimulated with EGF for 4 h. Cells were then lysed, and cell lysates were blotted for VEGF-A or β-actin for loading control. The graphs are quantitations of the VEGF bands normalized to actin and expressed as fold change compared to control (luciferase siRNA). (C) ELISA for supernatants from SF-268 cells transfected with the indicated oligos, treated with DMSO, Wm, or U0126, then starved and stimulated with EGF for 4 h or left unstimulated and measured for VEGF-A secretion. Values are expressed as fold change compared to time zero (− EGF). The data are means ± SEM from three different experiments (n = 3); * p < 0.05 indicates statistically significant differences.
Figure 7
Figure 7
Hypoxia suppresses RhoA/C through StarD13. (A) SF-268 cells were treated with either DMSO or U0126 and subjected to hypoxia for 4 h or kept in normoxia. Cells were then lysed, and the lysates were blotted for StarD13 and β-actin for loading control. The graph is a densitometric analysis of the Western blots using Image J. Values are normalized to the loading control and expressed as fold change compared to time zero (normoxia). (B) (+ indicates addition of the treatment) SF-268 cells were transfected with either luciferase or StarD13 siRNA and subjected to hypoxia for 4 h, or left in normoxia and lysed. The lysates were then subjected to a RhoA pull-down assay, and the total lysates were blotted for anti-RhoA, anti-StarD13, and anti-β-actin. The graph is a quantitation of the bands in the upper gel normalized to total RhoA and expressed as fold change compared to control (luciferase siRNA/normoxia). (C) SF-268 cells transfected with luciferase or StarD13 siRNA and subjected to 4 h hypoxia. Cells were then lysed, and cell lysates were blotted for VEGF-A or β-actin. The graphs are quantitations of the VEGF bands normalized to actin and expressed as fold change compared to normoxia control. Values are expressed as fold change at every treatment to normoxia. The data are means ± SEM from three different experiments (n = 3); * p < 0.05 indicates statistically significant differences.
Figure 8
Figure 8
Model showing the pathways involved in VEGF-A expression and secretion in brain tumor cells following hypoxia and EGF stimulation. Hypoxia leads to an increase in VEGF expression and secretion in glioblastoma cells. This is through the EGF receptor and the activation of the MAPK pathway. Hypoxia also suppresses the PI3K/Rho-GTPase pathway, potentially through an increase in the expression of the RhoA GAP, StarD13.

References

    1. Abou-Antoun T.J., Hale J.S., Lathia J.D., Dombrowski S.M. Brain Cancer Stem Cells in Adults and Children: Cell Biology and Therapeutic Implications. Neurotherapeutics. 2017;14:372–384. doi: 10.1007/s13311-017-0524-0. - DOI - PMC - PubMed
    1. Lathia J.D., Mack S.C., Mulkearns-Hubert E.E., Valentim C.L.L., Rich J.N. Cancer stem cells in glioblastoma. Genes Dev. 2015;29:1203–1217. doi: 10.1101/gad.261982.115. - DOI - PMC - PubMed
    1. Vaupel P., Thews O., Kelleher D.K., Hoeckel M. Current status of knowledge and critical issues in tumor oxygenation. Results from 25 years research in tumor pathophysiology. Adv. Exp. Med. Biol. 1998;454:591–602. - PubMed
    1. Musah-Eroje A., Watson S. Adaptive Changes of Glioblastoma Cells Following Exposure to Hypoxic (1% Oxygen) Tumour Microenvironment. Int. J. Mol. Sci. 2019;20:2091. doi: 10.3390/ijms20092091. - DOI - PMC - PubMed
    1. Carmeliet P., Jain R.K. Angiogenesis in cancer and other diseases. Nature. 2000;407:249–257. doi: 10.1038/35025220. - DOI - PubMed

Publication types

MeSH terms

Substances

LinkOut - more resources