Review
. 2020 Jan 7;92(1):49-66.
doi: 10.1021/acs.analchem.9b04718. Epub 2019 Dec 2.

Challenging Bioanalyses with Capillary Electrophoresis

Affiliations
Review

Challenging Bioanalyses with Capillary Electrophoresis

Courtney J Kristoff et al. Anal Chem. .

Abstract


Figures

Figure 1
Figure 1
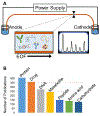
(A) is a conceptual depiction of biomolecular analyses with CE. (B) summarizes the results of a search using the SciFinder Scholar® database to estimate the frequency of publications from January 2018 through October 2019 that contained the term capillary electrophoresis and the biomolecular classes listed in the figure.
Figure 2
Figure 2
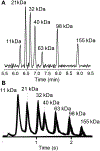
illustrates the utility of CE for protein separations under conditions of high efficiency and high throughput. (A) depicts size-based sieving of the Benchmark protein size standard separated with packed capillary electrophoresis utilizing colloidal silica particles as the packing material. (B) depicts the separation of a protein standard using SDS and a physical gel composed of a polymer. (A) Adapted with permission from Electrophoresis of megaDalton proteins inside colloidal silica, Ragland, T.S.; Gossage, M.D.; Furtaw, M.D.; Anderson, J.P.; Steffens, D.L.; Wirth, M.J. Electrophoresis. Vol. 40, Issue 5 (ref 7). Copyright 2019 Wiley. (B) Adapted by permission from Springer, Anal. Bioanal. Chem., Vol. 411 pp. 6155–6163, Droplet sample introduction to microchip gel and zone electrophoresis for rapid analysis of protein-protein complexes and enzymatic reactions, Ouimet, C.M., C.I. D’Amico, and R.T. Kennedy (ref 8). Copyright 2019.
Figure 3
Figure 3
illustrates a multi-dimensional separation platform that incorporates capillary electrophoresis to increase the identification of proteins and proteoforms. (A) size exclusion chromatography chromatogram. (B) chromatogram using reversed phase liquid chromatography. (C) Total ion current chromatogram after CE-MS/MS. (D) fragmentation pattern of an identified proteoform using TopPIC software. Reprinted with permission from McCool, E. N.; Lubeckyj, R. A.; Shen, X.; Chen, D.; Kou, Q.; Liu, X.; Sun, L. Anal. Chem. 2018, 90, 5529–5533 (ref 19). Copyright 2018 American Chemical Society.
Figure 4
Figure 4
illustrates an automated platform coupling capillary isoelectric focusing and high resolution mass spectrometry for antibody and protein analyses. The automated platform can provide structural information and isoelectric points. Reprinted with permission from Wang, L.; Bo, T.; Zhang, Z.; Wang, G.; Tong, W.; Da Yong Chen, D. Anal Chem. 2018, 90, 9495–9503 (ref 33). Copyright 2018 American Chemical Society.
Figure 5
Figure 5
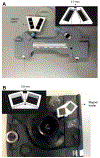
illustrates a 3D printed magnet holder for (A) a liquid based cooled commercial capillary electrophoresis instrument and for (B) an air based cooled capillary system for the control of magnetic microparticles in immobilized enzymatic assays performed on-line. Reproduced with permission from An improved design to capture magnetic microparticles for capillary electrophoresis based immobilized microenzyme reactors, Ramana, P.; Schejbal, J.; Houthoofd, K.; Martens, J.; Adams, E.; Augustijns, P.; Glatz, Z.; Schepdael, A. V. Electrophoresis., Vol. 39, (ref 51). Copyright 2018 Wiley
Figure 6
Figure 6
depicts a capillary electrophoresis-electrospray ionization-mass spectrometry platform for the identification of anionic and cationic species from a live embryonic frog cell. The left ventricle, V1, of the cell was identified using a 10 nL portion of its cellular content for analysis. Reproduced from Portero, E.P.; Nemes, P. Analyst 2019, 144, 892–900 (ref 128), with permission of The Royal Society of Chemistry.
Figure 7
Figure 7
is an electropherogram of N-glycans with α2–3 and α2–6 linked sialic acids from human urinary exosomes. The trace is obtained using microfluidic electrophoresis. Reproduced from Song, W.; Zhou, X.; Benktander, J.D.; Gaunitz, S.; Zou, G.; Wang, Z.; Novotny, M.V.; Jacobson, S.C. Anal. Chem. 2019, (ref 146). Copyright 2019 American Chemical Society.
Figure 8
Figure 8
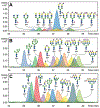
is an electropherogram of N-glycans with α2–3 and α2–6 linked sialic acids from human plasma. The traces are obtained using CE-MS. The upper trace (A) is of N-glycans at high abundance (> 2%). The middle trace (B) is of intermediate abundance (from 0.5% to 1%). The lower trace (C) is of N-glycans at low abundance (< 0.25%). Adapted by permission from Macmillan Publishers Ltd: Nature Communications, Lageveen-Kammeijer, G. S.M.; de Haan, N.; Mohaupt, P.; Wagt, S.; Filius, M.; Nouta, J.; Falck, D.; Wuhrer, M., Nature Communications 2019, 10(1), 2137 (ref #147). Copyright 2019. <https://www.nature.com/articles/s41467-019-09910-7
Figure 9
Figure 9
depicts the layout of a microfluidic device capable of modeling in vivo circulation to investigate cell-cell interactions. Coupled with electrophoresis, this body-on-chip microfluidic device was used to investigate the effects of adipocytes on insulin secretion from islets of Langerhans. Reproduced from Lu, S.; Dugan, C.E.; Kennedy, R.T. Anal. Chem. 2018. 90(8), 5171–5178 (ref 181). Copyright 2018 American Chemical Society.
Figure 10
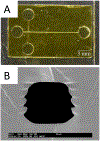
Figure 10
is an image of (A) a 3D printed microfluidic device. (B) contains an SEM image of a channel cross section. Adapted from Beauchamp, M. J.; Nielsen, A. V.; Gong, H.; Nordin, G. P.; Woolley, A. T., Anal Chem. 2019, 91 (11), 7418–7425 (ref 188). Copyright 2019 American Chemical Society.

References

    1. Mora MF; Jones SM; Creamer J; Willis PA Electrophoresis 2018, 39, 620–625. - PubMed
    1. Ferreira Santos MS; Cordeiro TG; Noell AC; Garcia CD; Mora MF Electrophoresis 2018, 39, 2890–2897. - PubMed
    1. Creamer JS; Mora MF; Willis PA Electrophoresis 2018, 39, 2864–2871. - PubMed
    1. Creamer JS; Mora MF; Noell AC; Willis PA Electrophoresis 2019, Early View 10.1002/elps.201900268. - DOI - PubMed
    1. McCord BR; Gauthier Q; Cho S; Roig MN; Gibson-Daw GC; Young B; Taglia F; Zapico SC; Mariot RF; Lee SB; Duncan G Anal. Chem 2019, 91, 673–688. - PubMed

Publication types