

Adult validation of a self-administered tablet audiometer
- PMID: 31699157
- PMCID: PMC6839098
- DOI: 10.1186/s40463-019-0385-0
Adult validation of a self-administered tablet audiometer
Abstract
Background: There is evidence to suggest that rates of hearing loss are increasing more rapidly than the capacity of traditional audiometry resources for screening. A novel innovation in tablet, self-administered portable audiometry has been proposed as a solution to this discordance. The primary objective of this study was to validate a tablet audiometer with adult patients in a clinical setting. Secondarily, word recognition with a tablet audiometer was compared against conventional audiometry.
Methods: Three distinct prospective adult cohorts underwent testing. In group 1 and group 2 testing with the automated tablet audiometer was compared to standard sound booth audiometry. In Group 1, participants' pure tone thresholds were measured with an automated tablet audiometer in a quiet clinic exam room. In Group 2, participants completed monosyllabic word recognition testing using the NU-6 word lists. In Group 3, internal reliability was tested by having participants perform two automated tablet audiometric evaluation in sequence.
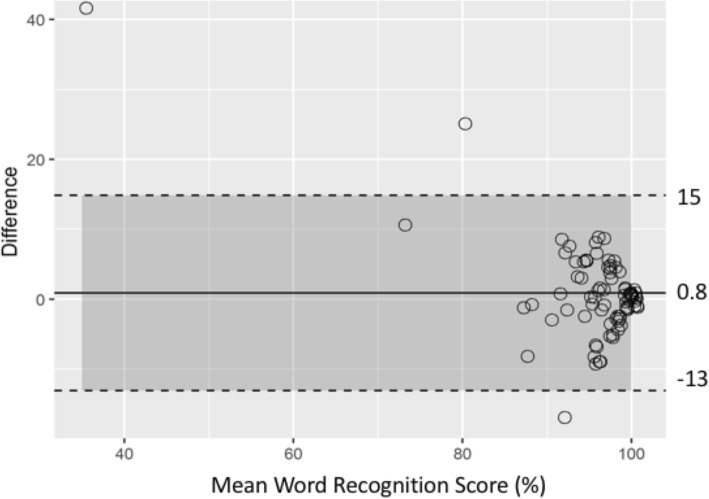
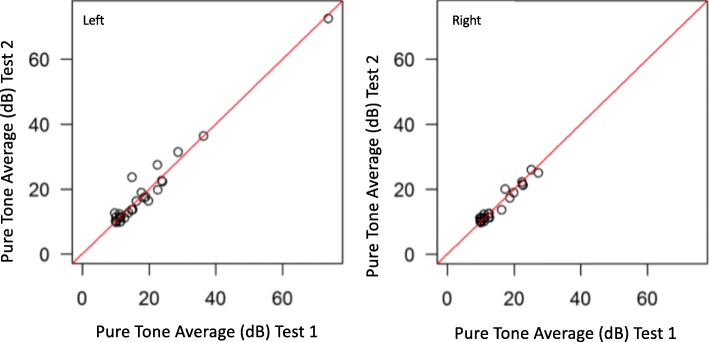
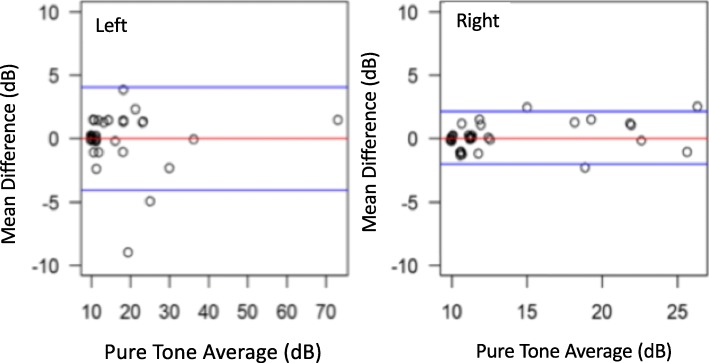
Results: Group 1 included 40 patients mean age was 54.7 ± 18.4 years old and 60% female; Group 2 included 44 participants mean age was 55.2 ± 14.8 years old and 68.2% female; Group 3 included 40 participants with mean age of 39.4 + 15.9 years old and 60.5% female. In Group 1, compared to standard audiometry, 95.7% (95% CI: 92.6-98.9%) of thresholds were within 10 dB. In Group 2, comparing word recognition results, 96.2% (95% CI: 89.5-98.7%) were clinically equivalent and within a critical difference range. In Group 3, One-way Intraclass Correlation for agreement for the both left- and right-ear pure tone average was 0.98. The mean difference between repeat assessments was 0 (SD = 2.1) in the left ear, and 0.1 (SD = 1.1) in the right ear.
Conclusion: Puretone audiometry and word recognition testing appears valid when performed by non-healthcare experts using a tablet audiometer outside a sound booth in a quiet environment.
Trial registration: ClinicalTrials.gov Identifier: NCT02761798. Registered April, 2016 < https://clinicaltrials.gov/ct2/show/NCT02761798>.
Keywords: Audiology; Automated audiometry; Hearing loss; Screening audiometry; Tablet audiometry.
Conflict of interest statement
Dr. Matthew Bromwich is Co-Founder and Chief Medical Officer SHOEBOX Inc. Amy E Mark holds a joint Clinical Research Associate position with SHOEBOX Inc. and the Children’s Hospital of Eastern Ontario. Renée Lefrançois is the Director of Audiology at SHOEBOX Inc.
Figures
References
-
- Statistics Canada. Canadian Health Measures Survey: Household and Physical Measures Data, 2012 to 2013: Body Mass Index of Children and Youth.; 2014. http://www.statcan.gc.ca/pub/82-625-x/2014001/article/14105-eng.htm.
-
- Statistics Canada. Population Projections for Canada, Provinces and Territories: 2013–2036.; 2014. doi:91–520-X.
MeSH terms
Associated data
LinkOut - more resources
Full Text Sources
Medical
Research Materials
Miscellaneous
