. 2020 Apr 1;87(7):645-655.
doi: 10.1016/j.biopsych.2019.08.029. Epub 2019 Sep 13.

Convergent Evidence for Predispositional Effects of Brain Gray Matter Volume on Alcohol Consumption

Affiliations

Convergent Evidence for Predispositional Effects of Brain Gray Matter Volume on Alcohol Consumption

David A A Baranger et al. Biol Psychiatry. .

Abstract

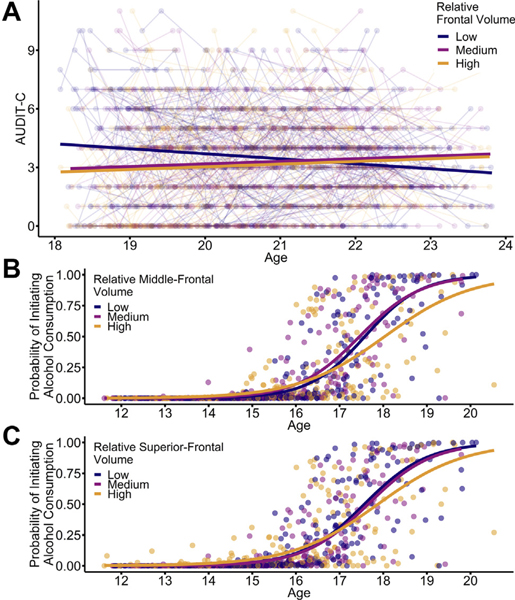
Background: Alcohol use has been reliably associated with smaller subcortical and cortical regional gray matter volumes (GMVs). Whether these associations reflect shared predisposing risk factors or causal consequences of alcohol use remains poorly understood.

Methods: Data came from 3 neuroimaging samples (N = 2423), spanning childhood or adolescence to middle age, with prospective or family-based data. First, we identified replicable GMV correlates of alcohol use. Next, we used family-based and longitudinal data to test whether these associations may plausibly reflect a predispositional liability for alcohol use or a causal consequence of alcohol use. Finally, we used heritability, gene-set enrichment, and transcriptome-wide association study approaches to evaluate whether genome-wide association study-defined genomic risk for alcohol consumption is enriched for genes that are preferentially expressed in regions that were identified in our neuroimaging analyses.

Results: Smaller right dorsolateral prefrontal cortex (DLPFC) (i.e., middle and superior frontal gyri) and insula GMVs were associated with increased alcohol use across samples. Family-based and prospective longitudinal data suggest that these associations are genetically conferred and that DLPFC GMV prospectively predicts future use and initiation. Genomic risk for alcohol use was enriched in gene sets that were preferentially expressed in the DLPFC and was associated with replicable differential gene expression in the DLPFC.

Conclusions: These data suggest that smaller DLPFC and insula GMV plausibly represent genetically conferred predispositional risk factors for, as opposed to consequences of, alcohol use. DLPFC and insula GMV represent promising biomarkers for alcohol-consumption liability and related psychiatric and behavioral phenotypes.

Keywords: Alcohol; Gene expression; Heritability; Imaging; Longitudinal; Structure.


Figures

Figure 1.
Figure 1.
Identification of replicable volumetric associations with alcohol consumption. This statistical parametric map illustrates regions of reduced brain volume associated with increased alcohol consumption (Table S1 in Supplement 1), which are overlaid onto a canonical structural brain image Montreal Neurological Institute coordinates and statistics (Duke Neurogenetics Study [DNS]: p < .05, familywise error whole-brain corrected, ≥10 contiguous voxels; Human Connectome Project [HCP]: p < .05, familywise error region-of-interest corrected, ≥10 contiguous voxels). Alcohol consumption was not associated with increased volume in any region. Notably, in the HCP dataset, the superior frontal gyrus cluster extended into the right middle frontal gyrus and was located relatively far (34 mm dorsal) from the original right superior frontal cluster identified in the DNS. In contrast, this peak in the HCP was located 11.6 mm away from the right middle frontal peak identified in the DNS. Thus, for the purposes of post hoc analyses, the combined volume of both the right middle and superior frontal gyri cortices was extracted from both samples. Cluster overlap at an uncorrected threshold and comparison of effect sizes are shown in Figures S2 and S3 in Supplement 1.
Figure 2.
Figure 2.
Shared genetic predisposition between alcohol consumption and brain volume. In the Human Connectome Project (HCP) sample, (A) alcohol consumption scores (approximated Alcohol Use Disorders Identification Test consumption subscale scores [aAUDIT-C]) and gray matter volume of the right insula and right middle and superior frontal cortices were all observed to be heritable (aAUDIT-C: 51.79%, p < 2.2 × 10⁻¹⁶; insula: 68.83%, p < 2.2 × 10⁻¹⁶; frontal: 74.46%, p < 2.2 × 10⁻¹⁶) (Table S1 in Supplement 1). (B) Significant phenotypic correlations between aAUDIT-C scores and volumes of the right insula and middle and superior frontal gyri are attributable to shared genetic factors (insula: −0.2314, p = .0022; frontal: −0.2192, p = .0054) but not unique environmental factors (Table S1 in Supplement 1). Distribution of (C) right insula and (D) right middle and superior frontal volumes by alcohol exposure group. High = aAUDIT-C score > sample mean + 0.5 SD (i.e., > 4.67); Low = aAUDIT-C score < sample mean − 0.5 SD (i.e., < 1.54); Concordant = both siblings are in the same alcohol exposure group; Discordant = one sibling is in the high group, while the other is in the low group. Contrast comparisons found evidence for predispositional effects of brain volume on alcohol consumption in both cases (insula: graded liability: β = −0.0037, p = .049, predispositional: β = 0.0037, p = .0006; frontal: predispositional: β = 0.0019, p = .029) (Table S2 in Supplement 1).
Figure 3.
Figure 3.
Frontal volume prospectively predicts alcohol use and initiation of consumption. (A) In the Duke Neurogenetics Study, participants with reduced volume of the right middle and superior frontal cortices reported elevated alcohol consumption before 20.85 years of age following the neuroimaging scan, and after accounting for baseline drinking (frontal × age interaction: β = 0.150, false discovery rate–corrected p = .008) (Table S3 in Supplement 1). (B, C) In the Teen Alcohol Outcomes Study, participants with increased volume of the right middle and superior frontal cortices report initiation of alcohol consumption at an older age (midfrontal × age interaction: β = − 57.042, false discovery rate–corrected p = .036; superior frontal × age interaction: β = −60.74, false discovery rate–corrected p = .036) (Table S4 in Supplement 1). Analyses were conducted with continuous data; the partition into 3 equally sized groups according to volume was done for display purposes only. AUDIT-C, Alcohol Use Disorders Identification Test consumption subscale.
Figure 4.
Figure 4.
Tissue-specific enrichment of alcohol-consumption genomic risk. Enrichment of alcohol-consumption genome-wide association study (UK Biobank, N = 112,117) (A) associations and (B, C) heritability, in gene sets defined by the relative expression of genes (A, B) across all tissues and (C) within the brain, in the Genotype-Tissue Expression project dataset (Supplemental Data). The x-axis and color scale represent the significance of the enrichment (negative logarithmic scale of the p value). Solid, dashed, and dotted lines represent Bonferroni-corrected, false discovery rate–corrected, and nominally significant p values, respectively. BA, Brodmann area; EBV, Epstein-Barr virus.
Figure 5.
Figure 5.
Transcriptome-wide association study of alcohol consumption predicting gene expression. Genetic risk for alcohol consumption according to the UK Biobank genome-wide association study (n = 112,117) is associated with differences in human postmortem gene expression (Genotype-Tissue Expression project; ns = 81–103), including frontal cortex Brodmann area (BA) 9 (Supplemental Data). Notably, associations in the liver (far-right panel) do not survive Bonferroni correction for multiple comparisons, though 4 are significant at a less-stringent false discovery rate–based correction. The y-axis represents the significance of the association. Solid, dashed, and dotted lines represent Bonferroni-corrected, false discovery rate–corrected, and nominally significant p values, respectively.

References

    1. World Health Organization (2014): Global status report on alcohol and health. Geneva, Switzerland: World Health Organization Press.
    1. Grant BF, Goldstein RB, Saha TD, Chou SP, Jung J, Zhang H, et al. (2015): Epidemiology of DSM-5 alcohol use disorder results from the National Epidemiologic Survey on Alcohol and Related Conditions III. JAMA Psychiatry 72:757–766. - PMC - PubMed
    1. Substance Abuse and Mental Health Services Administration (2018): Key Substance Use and Mental Health Indicators in the United States: Results from the 2017 National Survey on Drug Use and Health. Rockville, MD: Center for Behavioral Health Statistics and Quality, Substance Abuse and Mental Health Services Administration; Available at: https://www.samhsa.gov/data/sites/default/files/cbhsq-reports/NSDUHFFR20.... Accessed February 22, 2018.
    1. Mackey S, Allgaier N, Chaarani B, Spechler P, Orr C, Bunn J, et al. (2018): Mega-analysis of gray matter volume in substance dependence: general and substance-specific regional effects. Am J Psychiatry 17:19–128. - PMC - PubMed
    1. Lange EHH, Nerland S, Jørgensen KNN, Mørch-Johnsen L, Nesvåg R, Hartberg CBB, et al. (2017): Alcohol use is associated with thinner cerebral cortex and larger ventricles in schizophrenia, bipolar disorder and healthy controls. Psychol Med 4:55–668. - PubMed

Publication types