. 2019 Nov 26;116(48):24231-24241.
doi: 10.1073/pnas.1908129116. Epub 2019 Nov 7.

Trisomy 21 dysregulates T cell lineages toward an autoimmunity-prone state associated with interferon hyperactivity

Affiliations

Trisomy 21 dysregulates T cell lineages toward an autoimmunity-prone state associated with interferon hyperactivity

Paula Araya et al. Proc Natl Acad Sci U S A. .

Abstract

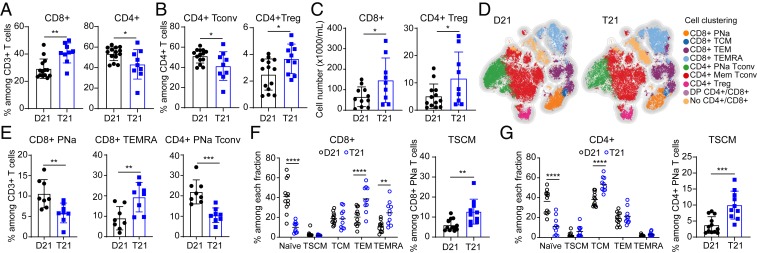
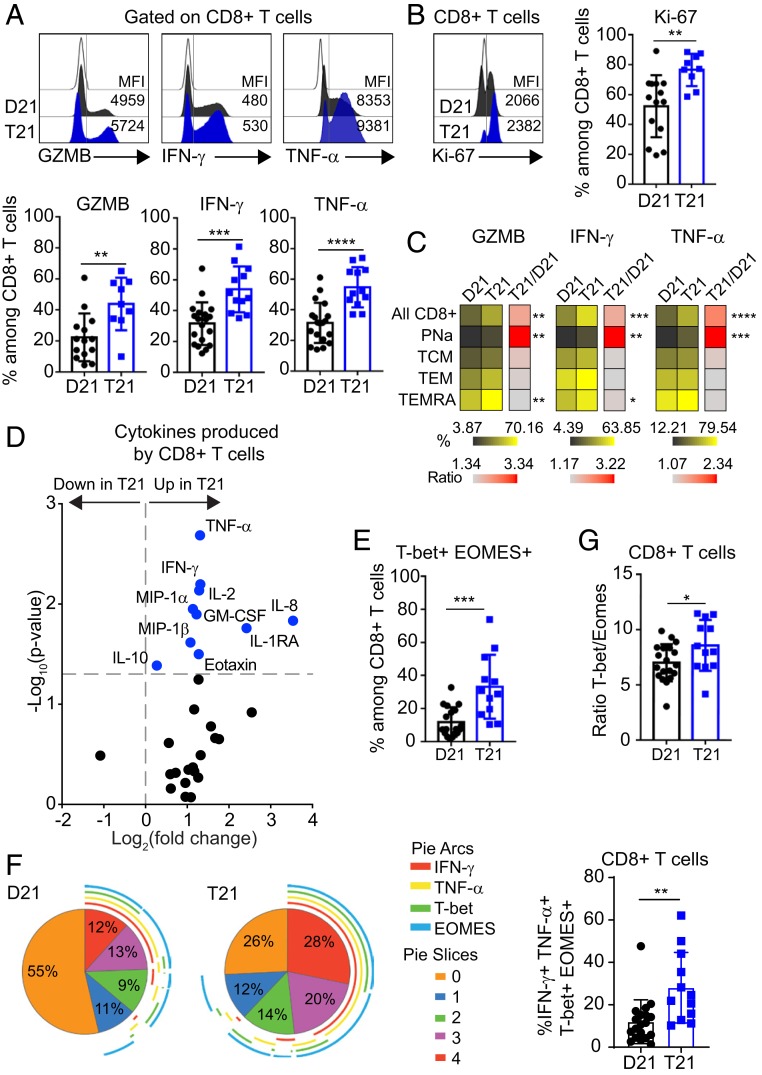
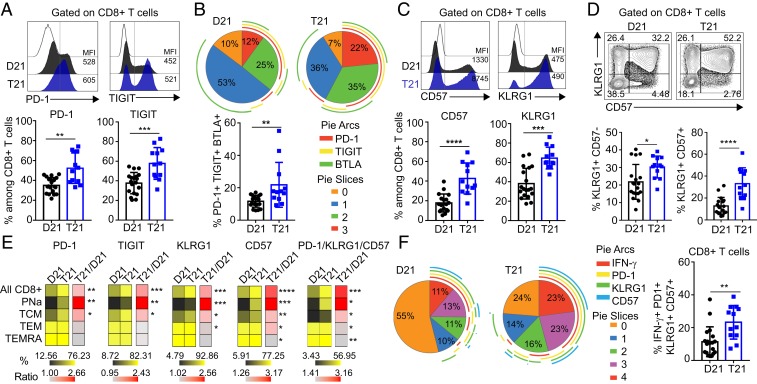
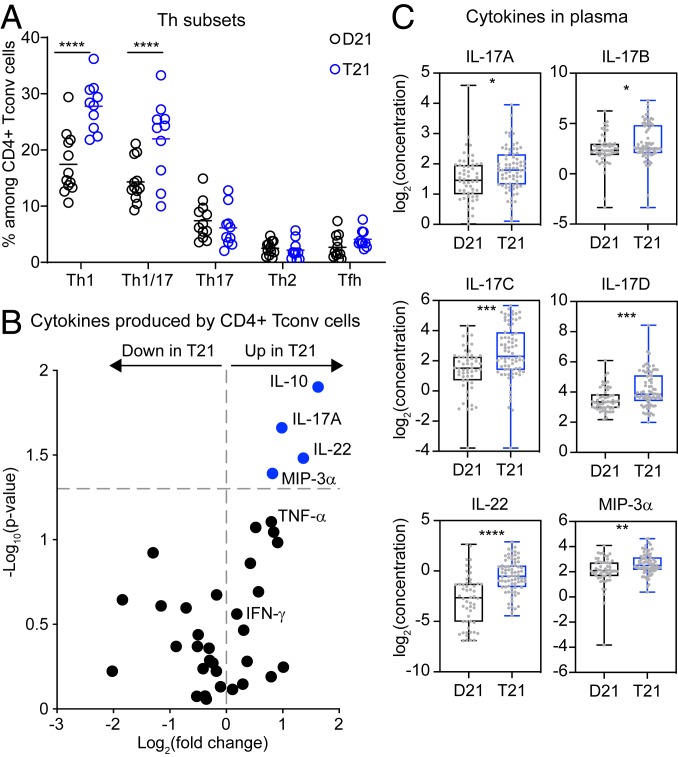
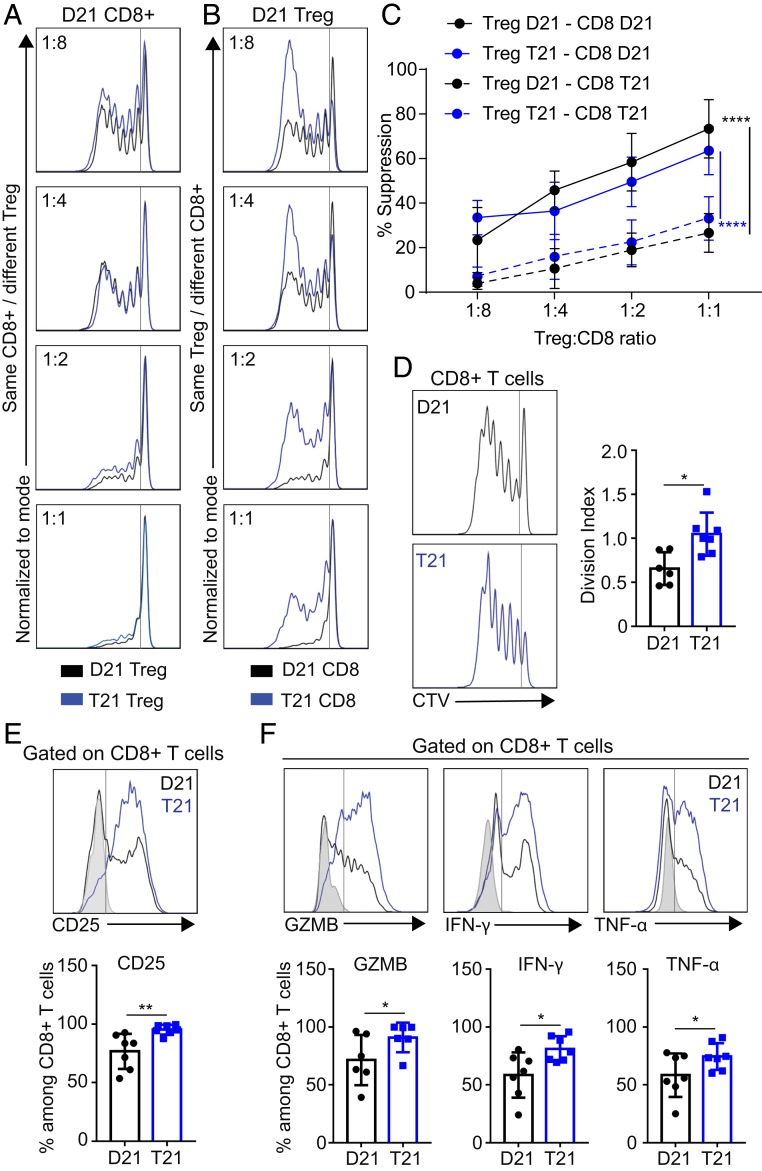
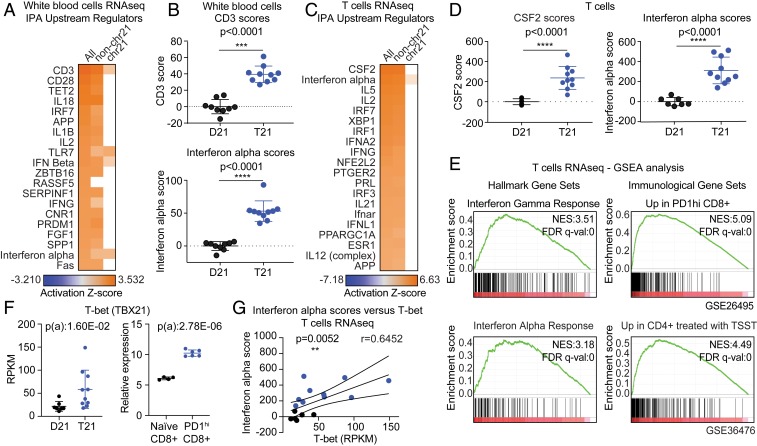
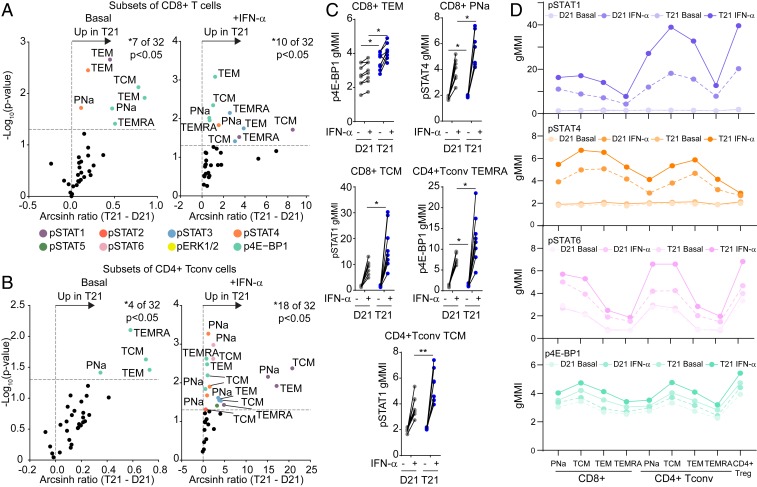
Trisomy 21 (T21) causes Down syndrome (DS), a condition characterized by high prevalence of autoimmune disorders. However, the molecular and cellular mechanisms driving this phenotype remain unclear. Building upon our previous finding that T cells from people with DS show increased expression of interferon (IFN)-stimulated genes, we have completed a comprehensive characterization of the peripheral T cell compartment in adults with DS with and without autoimmune conditions. CD8+ T cells from adults with DS are depleted of naïve subsets and enriched for differentiated subsets, express higher levels of markers of activation and senescence (e.g., IFN-γ, Granzyme B, PD-1, KLRG1), and overproduce cytokines tied to autoimmunity (e.g., TNF-α). Conventional CD4+ T cells display increased differentiation, polarization toward the Th1 and Th1/17 states, and overproduction of the autoimmunity-related cytokines IL-17A and IL-22. Plasma cytokine analysis confirms elevation of multiple autoimmunity-related cytokines (e.g., TNF-α, IL17A-D, IL-22) in people with DS, independent of diagnosis of autoimmunity. Although Tregs are more abundant in DS, functional assays show that CD8+ and CD4+ effector T cells with T21 are resistant to Treg-mediated suppression, regardless of Treg karyotype. Transcriptome analysis of white blood cells and T cells reveals strong signatures of T cell differentiation and activation that correlate positively with IFN hyperactivity. Finally, mass cytometry analysis of 8 IFN-inducible phosphoepitopes demonstrates that T cell subsets with T21 show elevated levels of basal IFN signaling and hypersensitivity to IFN-α stimulation. Therefore, these results point to T cell dysregulation associated with IFN hyperactivity as a contributor to autoimmunity in DS.

Keywords: T cells; autoimmunity; inflammation; trisomy 21; type I interferon.


Conflict of interest statement

The authors declare no competing interest.

Figures

Fig. 1.
Fig. 1.
Adults with trisomy 21 show dysregulated T cell homeostasis. (A) Frequencies of CD8+ and CD4+ T cells within the CD3+ T cells in euploid controls (D21) versus people with trisomy 21 (T21) (n = 14 D21; n = 9 T21). (B) Percentage of CD4+ Tconv (CD4+ CD25low CD127high) and CD4+ Treg (CD4+ CD25high CD127low FOXP3+) cells among CD4+ T cells. (C) Numbers of CD8+ and CD4+ Treg cells in peripheral blood in people with and without T21. (D) A t-SNE map showing a random subsample of circulating T cells from individuals with and without T21, analyzed with FlowSOM clustering. (E) Frequencies of CD8+ PNa, CD8+ TEMRA, and CD4+ PNa Tconv cells within the CD3+ T cells obtained by FlowSOM clustering. (F and G) (Left) Frequencies of (F) CD8+ and (G) CD4+ T cells subsets based on expression of CCR7, CD45RA, CD45RO, CD27, and CD95 as shown in SI Appendix, Fig. S2C. (Right) Proportion of TSCMs among potentially naïve CD8+ and CD4+ T cells (n = 12 D21; n = 10 T21). Data in AC, E, F, Right, and G, Right are shown as mean ± SEM with significance determined by unpaired t test; data in Left F and G are shown as mean ± SEM with significance determined by 2-way ANOVA with Sidak’s posttest. *P < 0.05; **P < 0.01; ***P < 0.001; ****P < 0.0001.
Fig. 2.
Fig. 2.
CD8+ T cells from adults with trisomy 21 show signs of hyperactivation. Fresh PBMCs from individuals with and without DS were stimulated ex vivo with PMA/Ionomycin before flow cytometry analysis. (A) (Top) Representative histograms showing the expression levels (mean fluorescence intensity [MFI]) of GZMB, IFN-γ, and TNF-α on total CD8+ T cells from individuals with T21 (blue) and typical controls (D21, black) compared to fluorescence minus one (FMO) on CD8+ T cells (white). (Bottom) Scatter plots display frequencies of GZMB (n = 14 D21; n = 9 T21), IFN-γ, and TNF-α (n = 19 D21; n = 12 T21) positive events among CD8+ T cells. (B) (Left) Representative histogram and (Right) frequencies of Ki-67 expression among CD8+ T cells (n = 14 D21; n = 9 T21). (C) Heatmap showing the frequencies of GZMB, IFN-γ, and TNF-α positive events within the CD8+ T cell subsets, as defined in SI Appendix, Fig. S2C, in individuals with and without T21. (D) Volcano plot showing fold changes (log2 T21 over D21) and P values (log10) for cytokine levels produced by CD8+ T cells after being stimulated with anti-CD3/CD28, detected by MSD. Vertical dashed line represents the no-change midline. Horizontal dashed line represents P value of 0.05 as calculated by Student t test. (E) Scatter plot showing the coexpression of T-bet and EOMES among total CD8+ T cells (n = 19 D21; n = 12 T21). (F) (Left) Pie charts illustrating the expression pattern of IFN-γ, TNF-α, T-bet, and EOMES within the CD8+ T cell population. Pie-section colors correspond to the number of markers expressed on a cell. Arcs around the pie represent which marker(s) are expressed. (Right) Coexpression of IFN-γ, TNF-α, T-bet, and EOMES among CD8+ T cells. (G) Ratio of T-bet+ to EOMES+ among CD8+ T cells in people with and without T21 (n = 19 D21; n = 12 T21). Data in AG are shown as mean ± SEM with significance determined by unpaired t test. *P < 0.05; **P < 0.01; ***P < 0.001; ****P < 0.0001.
Fig. 3.
Fig. 3.
CD8+ T cells from adults with trisomy 21 show increased expression of inhibitory receptors and senescence markers. Fresh PBMCs from individuals with and without DS were stimulated ex vivo with PMA/Ionomycin before flow cytometry analysis. (A) (Top) Representative histograms showing the expression levels (MFI) of PD-1 and TIGIT on total CD8+ T cells from individuals with T21 (blue) and typical controls (D21, black) compared to FMO on CD8+ T cells (white). (Bottom) Display frequencies of PD-1 and TIGIT positive events among CD8+ T cells (n = 19 D21; n = 12 T21). (B) (Top) Pie charts illustrating the mean percentage of inhibitory receptor coexpression on total CD8+ T cells from people with and without T21 (n = 19 D21; n = 12 T21). Pie chart colors correspond to the number of inhibitory receptors expressed on a cell. Arcs around the pie represent which inhibitory receptor(s) are expressed. (Bottom) Coexpression of PD-1, TIGIT, and BTLA among CD8+ T cells. (C) Representative (Top) histograms and (Bottom) frequencies of CD57 and KLRG1 expression among CD8+ T cells (n = 19 D21; n = 12 T21). (D) Representative (Top) flow cytometric data and (Bottom) frequencies for coexpression of the senescence markers KLRG1 and CD57 among CD8+ T cells. (E) Heatmap showing the frequencies of PD-1, TIGIT, KLRG1, CD57, and PD1/KLRG1/CD57 positive events within the different subsets of CD8+ T cells, as defined in SI Appendix, Fig. S2C, in individuals with and without T21. (F) (Left) Pie charts as in B showing the coexpression pattern of the effector molecule IFN-γ and the indicated inhibitory receptors and senescence markers on the CD8+ T cell population (n = 19 D21; n = 12 T21). (Right) Coexpression of IFN-γ with PD-1, KLRG1, and CD57 among CD8+ T cells. Data in AF are shown as mean ± SEM with significance determined by unpaired t test. *P < 0.05; **P < 0.01; ***P < 0.001; ****P < 0.0001.
Fig. 4.
Fig. 4.
Conventional CD4+ T cells from adults with trisomy 21 are polarized toward the Th1 and Th1-like Th17 states. Fresh PBMCs from individuals with and without DS were stained and analyzed by flow cytometry. (A) Scatter plots showing the frequencies of cells expressing the indicated chemokine receptor combinations among CD4+ Tconv cells (n = 12 D21; n = 10 T21). (B) Volcano plot showing fold changes (log2 T21 over D21) and P values (log10) for cytokines produced by CD4+ Tconv cells after being stimulated with anti-CD3/CD28 detected by MSD. Vertical dashed line represents the no-change midline. Horizontal dashed line represents P value of 0.05 as calculated by Student t test. (C) Box and whisker plots showing the levels (log2 concentration) of IL-17A, IL-17B, IL-17C, IL-17D, IL-22, and MIP-3α in plasma of individuals with and without T21 (n = 54 D21; n = 74 T21) measured by MSD. Data in A are shown as mean ± SEM with significance determined by 2-way ANOVA with Sidak’s posttest; data in B and C are shown as mean ± SEM with significance determined by unpaired t test. *P < 0.05; **P < 0.01; ***P < 0.001; ****P < 0.0001.
Fig. 5.
Fig. 5.
Effector T cells from people with trisomy 21 are resistant to Treg suppression. CD4+ Treg and CD8+ T cells from individuals with and without DS were titrated in criss-cross combinations in anti-CD3/CD28-stimulated cultures, and proliferation of CD8+ T cells was subsequently measured based on CellTrace Violet (CTV) dilution. (A and B) Representative examples comparing (A) CD4+ Treg from D21 and T21 samples titrated against the same violet-labeled D21 CD8+ T cells and (B) same CD4+ Treg from D21 titrated against violet-labeled T21 or D21 CD8+ T cells. (C) Percentage of suppression in the criss-cross combinations cultured for 5 d in the presence of anti-CD3/CD28 at the indicated ratios of Treg:CD8+ T cells. (D) Representative histogram showing (Left) CTV dilution and (Right) division indices of CD8+ T cells from individuals with and without DS, after 5 d of culture in presence of anti-CD3/CD28. (E and F) Representative (Top) flow cytometric analysis and (Bottom) frequency of (E) CD25 and (F) GZMB, IFN-γ, and TNF-α among gated CD8+ T cells, after 5 d of culture in presence of anti-CD3/CD28 and stimulated for the last 4 h with PMA/Ionomycin. Data in C are shown as mean ± SEM with significance determined by 2-way ANOVA with Tukey’s posttest; data in DF are shown as mean ± SEM with significance determined by unpaired t test (n = 7 D21 and 7 T21). *P < 0.05; **P < 0.01; ****P < 0.0001.
Fig. 6.
Fig. 6.
Transcriptome analysis reveals gene expression signatures indicative of T cell activation in adults with trisomy 21. RNAseq analysis was performed using bulk WBCs (n = 9 D21; n = 10 T21). (A) Heatmap displaying the results of examining the RNAseq data using the Upstream Regulator tool of the IPA software. Factors predicted to drive the gene expression changes observed are labeled to the left of the heatmap, with CD3 on top. From left to right, the analysis was performed using all DEGs, DEGs not encoded on chr21 (non-chr21), and DEGs encoded on chr21. (B) Dot and whisker plots showing (Top) CD3 activation scores and (Bottom) IFN alpha scores derived from WBC samples with and without T21. (C) Upstream regulator analysis as in A using RNAseq data derived from bulk T cells (n = 7 D21; n = 10 T21). (D) Dot and whisker plots of (Left) CSF2 scores and (Right) IFN alpha scores derived from T cells with and without T21. (E) Enrichment plots from GSEA of T cell RNAseq data, using (Left) the Hallmarks gene sets or (Right) Immunological Signature gene sets. Normalized Enrichment Score (NES) and FDR-corrected q values are shown. (F) Dot and whisker plots for T-bet mRNA levels from (Left) T cell RNAseq data and (Right) the GSE26495 dataset. Benjamini−Hochberg adjusted P values were calculated using DESeq2 and GEO2R (ebayes), respectively. (G) Pearson correlation analysis for IFN alpha scores versus T-bet mRNA expression in T cells. Data in B, D, and F are shown as mean ± SD with significance determined by unpaired t test; data in G are shown as correlation with significance determined by Pearson’s correlation. **P < 0.01; ***P < 0.001 ****P < 0.0001.
Fig. 7.
Fig. 7.
T cells of people with trisomy 21 are hypersensitive to IFN-α stimulation. Whole blood was incubated directly ex vivo for 30 min with (+IFN-α) or without (basal) IFNα-2A, before being processed for mass cytometry analysis of 8 different phosphoepitopes in 9 different T cell subsets (see SI Appendix, Fig. S8A for gating strategy). (A and B) Volcano plots showing fold changes by karyotype (T21 versus D21) either (Left) under basal conditions or (Right) after stimulation with IFNα-2A on subsets of (A) CD8+ T cells and (B) CD4+ Tconv cells. Fold change was calculated as the arcsinh ratio of samples from people with T21 minus that of samples of typical people (D21). All data represent one Helios run containing a total of n = 8 biologically independent replicates per group. Vertical dashed line represents the no-change midline. Horizontal dashed line represents P value of 0.05 as calculated by Student t test. (C) Dot plots displaying geometric mean metal intensity (gMMI) for the indicated epitopes and cell types, with lines connecting the basal and IFN-α−stimulated values for each sample. (D) Scatter plots showing the gMMI of pSTAT1, pSTAT4, pSTAT6, and p4E-BP1 among the indicated T cell subsets in people with and without T21 before and after stimulation with IFNα-2A. Data in C are shown as mean ± SEM with significance determined by 2-way ANOVA with Sidak’s posttest. *P < 0.05; **P < 0.01.

References

    1. de Graaf G., Buckley F., Skotko B. G., Estimation of the number of people with Down syndrome in the United States. Genet. Med. 19, 439–447 (2017). - PubMed
    1. Hasle H., Friedman J. M., Olsen J. H., Rasmussen S.A., Low risk of solid tumors in persons with Down syndrome. Genet. Med. 18, 1151–1157 (2016). - PubMed
    1. Hartley D., et al. , Down syndrome and Alzheimer’s disease: Common pathways, common goals. Alzheimers Dement. 11, 700–709 (2015). - PMC - PubMed
    1. Madan V., Williams J., Lear J. T., Dermatological manifestations of Down’s syndrome. Clin. Exp. Dermatol. 31, 623–629 (2006). - PubMed
    1. Mårild K., et al. , Down syndrome is associated with elevated risk of celiac disease: A nationwide case-control study. J. Pediatr. 163, 237–242 (2013). - PubMed

Publication types

MeSH terms