. 2020 Feb 3;217(2):e20191520.
doi: 10.1084/jem.20191520.

ILC2s are the predominant source of intestinal ILC-derived IL-10

Affiliations

ILC2s are the predominant source of intestinal ILC-derived IL-10

Jennifer K Bando et al. J Exp Med. .

Abstract

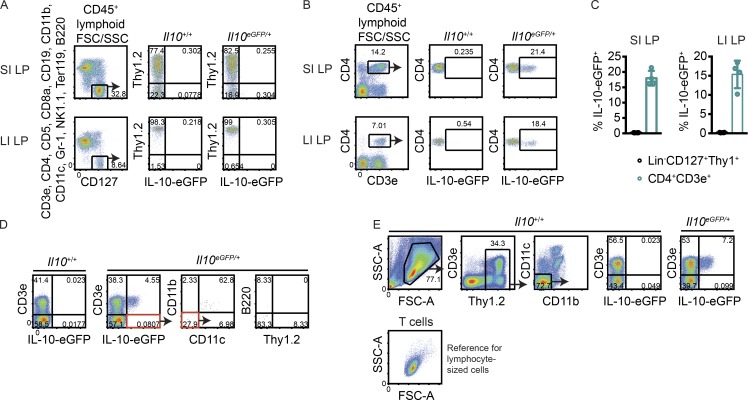
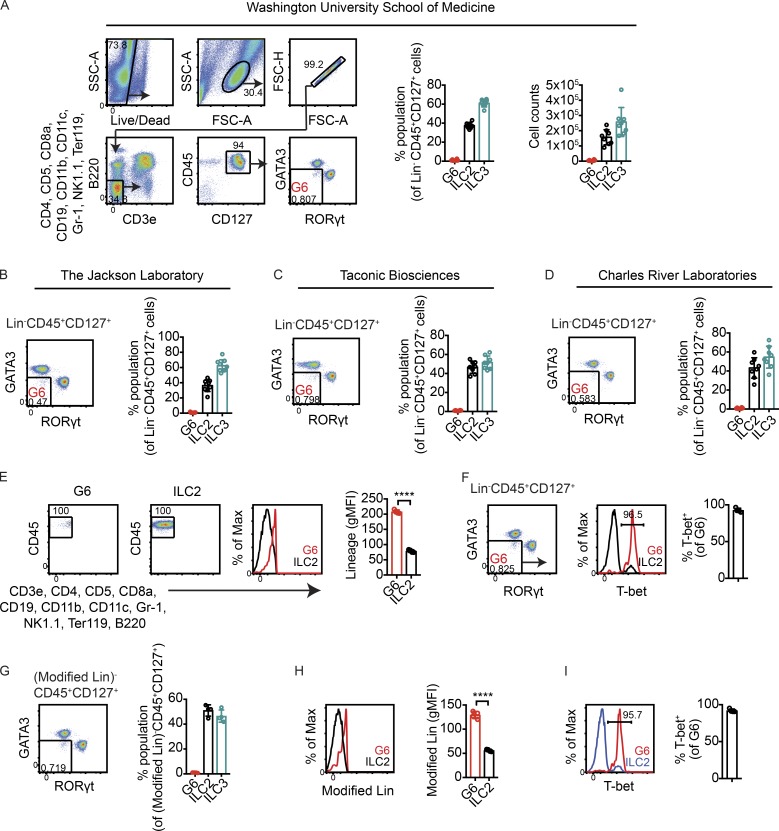
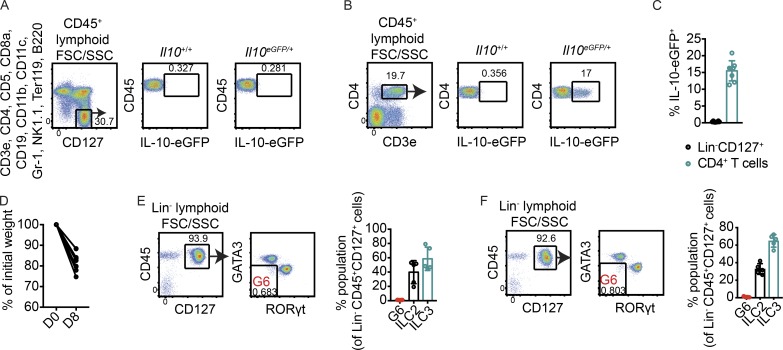
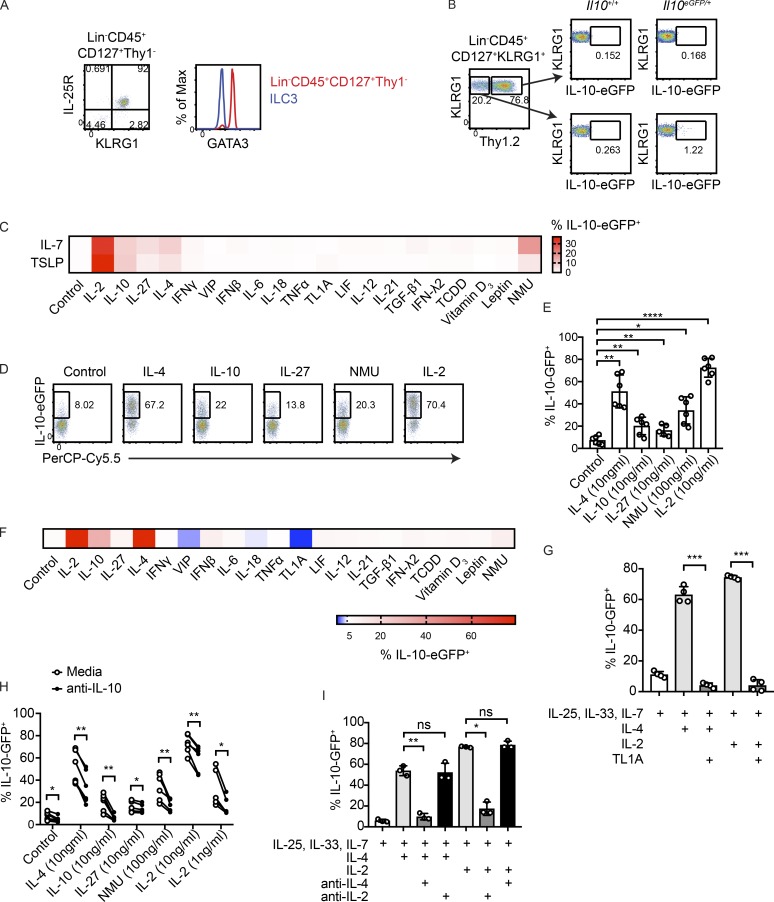
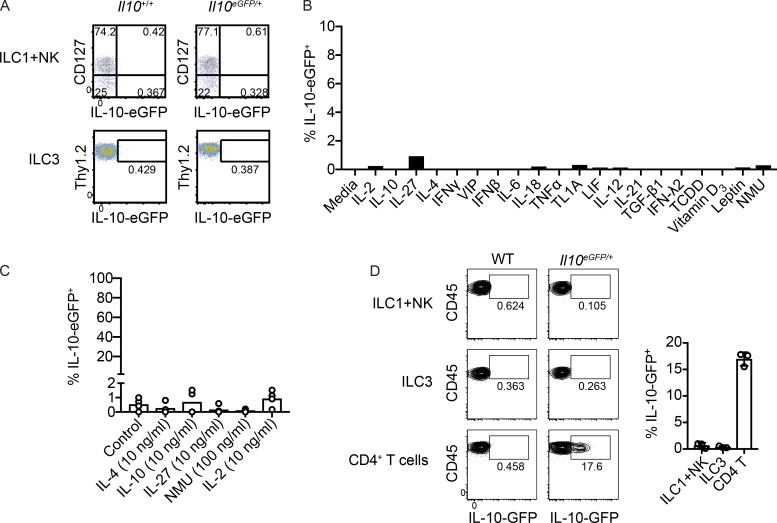
Although innate lymphoid cells (ILCs) functionally analogous to T helper type 1 (Th1), Th2, and Th17 cells are well characterized, an ILC subset strictly equivalent to IL-10-secreting regulatory T cells has only recently been proposed. Here, we report the absence of an intestinal regulatory ILC population distinct from group 1 ILCs (ILC1s), ILC2s, and ILC3s in (1) mice bred in our animal facility; (2) mice from The Jackson Laboratory, Taconic Biosciences, and Charles River Laboratories; and (3) mice subjected to intestinal inflammation. Instead, a low percentage of intestinal ILC2s produced IL-10 at steady state. A screen for putative IL-10 elicitors revealed that IL-2, IL-4, IL-27, IL-10, and neuromedin U (NMU) increased IL-10 production in activated intestinal ILC2s, while TL1A suppressed IL-10 production. Secreted IL-10 further induced IL-10 production in ILC2s through a positive feedback loop. In summary, ILC2s provide an inducible source of IL-10 in the gastrointestinal tract, whereas ILCregs are not a generalizable immune cell population in mice.


Figures

Figure 1.
Figure 1.
No evidence for IL-10–producing LinCD127+Thy1+ cells in naive small and large intestine. (A and B) Representative FACS plots showing IL-10–eGFP expression in small intestine (SI) and large intestine (LI) lamina propria (LP) CD45+ lymphocyte-sized LinCD45+CD127+ cells (A) and CD4+ T cells (B). (C) Frequencies of eGFP+ cells among lymphocyte-sized LinCD45+CD127+Thy1+ cells and CD4+ T cells in small intestine and large intestine lamina propria in multiple mice (n = 4). (D) Modified gating scheme to account for all cell lineages that expressed eGFP within the lymphocyte-based FSC/SSC gate. (E) Modified gating scheme to include cells with an expanded FSC/SSC profile. Below, the FSC/SSC profile of CD3e+ cells is shown as a reference for where lymphocytes lie in the plot. Bars indicate means ± SD. Data are representative of two independent experiments.
Figure 2.
Figure 2.
No evidence for lineage-negative ILCs distinct from ILC2s and ILC3s in small intestines of mice bred at WUSM and mice purchased from commercial vendors. (A) Left: Gating strategy to identify lineage-negative events that lacked markers for ILC2s and ILC3s. Right: Frequencies and total numbers of LinCD45+CD127+ cells that were GATA3hi (ILC2s) or RORγt+ (ILC3s) or that lacked markers for both ILC2s and ILC3s (G6) in small intestine lamina propria of WT mice bred at WUSM (n = 8). (B–D) Frequencies of LinCD45+CD127+ cells that lacked ILC2 and ILC3 markers in mice purchased from JAX (n = 8; B), Taconic Biosciences (n = 8; C), and Charles River Laboratories (n = 8; D). (E) Representative flow cytometry plots showing backgated G6. ILC2s are shown as a reference for lineage-negative cells. Right, quantified gMFI of lineage staining in G6 and ILC2s (n = 4). (F) T-bet staining in G6 (n = 4). (G) Frequencies of G6, ILC2s, and ILC3s using a modified lineage staining panel (Modified Lin) in which anti-F4/80 antibodies were added while anti-B220 antibodies were excluded (n = 4). (H) gMFI of Modified Lin staining in G6 and ILC2s (n = 4). (I) Frequencies of T-bet+ cells within G6 obtained using Modified Lin staining (n = 4). Bars indicate means ± SD. Data were pooled from two independent experiments (A–D) or are representative of two independent experiments (D–I). ****, P < 0.0001.
Figure 3.
Figure 3.
No evidence for ILCreg induction during intestinal inflammation. (A and B) Representative flow cytometry plots showing IL-10–eGFP expression in LinCD45+CD127+ cells (A) and CD4+ T cells (B) on day 8 of DSS treatment. (C) Frequencies of LinCD45+CD127+ cells and CD4+ T cells expressing eGFP in small intestine lamina propria in multiple mice (n = 8). (D) Body weight loss as a percentage of initial weight at day 8 of DSS treatment (n = 6). D0, day 0; D8, day 8. (E and F) Frequencies of LinCD45+CD127+ cells that lacked markers for both ILC2s and ILC3s in small intestine lamina propria of mice treated with DSS in drinking water for 8 d (n = 5; E) or in mice infected for 8 d with C. rodentium (n = 5; F). Frequencies of ILC2s and ILC3s are shown as controls. Bars indicate means ± SD. Data were pooled from two independent experiments (C) or are representative of two independent experiments (D–F).
Figure 4.
Figure 4.
IL-10 production by intestinal ILC2s is induced by IL-2, IL-4, IL-10, IL-27, and NMU, and suppressed by TL1A. (A) Representative flow cytometry plots showing IL-25R, KLRG1, and GATA3 staining in LinCD45+CD127+Thy1 cells. (B) Representative flow cytometry plots showing expression of eGFP in LinCD45+CD127+KLRG1+ ILC2s that are Thy1+ and Thy1. (C) Heatmap depicting frequencies of eGFP+ cells obtained by flow cytometric analysis of ILC2s cultured 2 d with IL-33, IL-25, and either IL-7 or TSLP, in combination with the indicated molecules. (D and E) Validation of results in C. Cells were cultured for 3 d with IL-33, IL-25, IL-7, and the indicated conditions (n = 5–6). (F) ILC2s cultured as in C using pre-activated ILC2s. (G) IL-4- or IL-2-elicited eGFP expression in ILC2s treated with TL1A (n = 4). (H and I) Isolated ILC2s were treated with IL-25, IL-33, IL-7, and the indicated molecules in the presence or absence of IL-10–blocking antibodies (n = 5–6; H) or in the presence or absence of IL-2- and IL-4–blocking antibodies (n = 3; I). Bars indicate means ± SD. Data from D, E, and H were analyzed from the same experiments. Data were pooled from two independent experiments (E and H) or are representative of two independent experiments (A, B, G, and I). *, P < 0.05; **, P < 0.01; ***, P < 0.001; ****, P < 0.0001.
Figure S1.
Figure S1.
IL-10 production in NK cells, ILC1s, and ILC3s. (A) Expression of IL-10–eGFP in NK1.1+ cells (pooled ILC1s and NK cells) and ILC3s isolated from naive small intestine lamina propria. (B) Screen for IL-10 elicitors using sorted small intestine ILC3s cultured for 2 d with IL-23, IL-1β, IL-7, and a candidate mediator. (C) Expression of IL-10–eGFP in small intestine lamina propria ILC3s sorted from biological replicates and cultured for 2 d with IL-23, IL-1β, IL-7, and molecules that were found to induce IL-10 in ILC2s (n = 4). (D) Expression of IL-10–eGFP in NK1.1+ cells (pooled ILC1s and NK cells), ILC3s, and CD4+ T cells isolated from small intestine lamina propria of mice 4 d after inoculation with 108 CFU of C. difficile VPI 10463 (n = 3). Bars indicate means ± SD. Data from A, C, and D are representative of two independent experiments.

References

    1. Bando J.K., and Colonna M.. 2016. Innate lymphoid cell function in the context of adaptive immunity. Nat. Immunol. 17:783–789. 10.1038/ni.3484 - DOI - PMC - PubMed
    1. Bando J.K., Gilfillan S., Song C., McDonald K.G., Huang S.C., Newberry R.D., Kobayashi Y., Allan D.S.J., Carlyle J.R., Cella M., and Colonna M.. 2018. The tumor necrosis factor superfamily member RANKL suppresses effector cytokine production in group 3 innate lymphoid cells. Immunity. 48:1208–1219.e4. 10.1016/j.immuni.2018.04.012 - DOI - PMC - PubMed
    1. Berg D.J., Davidson N., Kühn R., Müller W., Menon S., Holland G., Thompson-Snipes L., Leach M.W., and Rennick D.. 1996. Enterocolitis and colon cancer in interleukin-10-deficient mice are associated with aberrant cytokine production and CD4(+) TH1-like responses. J. Clin. Invest. 98:1010–1020. 10.1172/JCI118861 - DOI - PMC - PubMed
    1. Branzk N., Gronke K., and Diefenbach A.. 2018. Innate lymphoid cells, mediators of tissue homeostasis, adaptation and disease tolerance. Immunol. Rev. 286:86–101. 10.1111/imr.12718 - DOI - PubMed
    1. Brown E.M., Kenny D.J., and Xavier R.J.. 2019. Gut microbiota regulation of T cells during inflammation and autoimmunity. Annu. Rev. Immunol. 37:599–624. 10.1146/annurev-immunol-042718-041841 - DOI - PubMed

Publication types

MeSH terms