. 2019 Nov 22;366(6468):1013-1021.
doi: 10.1126/science.aav2588. Epub 2019 Nov 7.

Glutamine blockade induces divergent metabolic programs to overcome tumor immune evasion

Affiliations

Glutamine blockade induces divergent metabolic programs to overcome tumor immune evasion

Robert D Leone et al. Science. .

Abstract

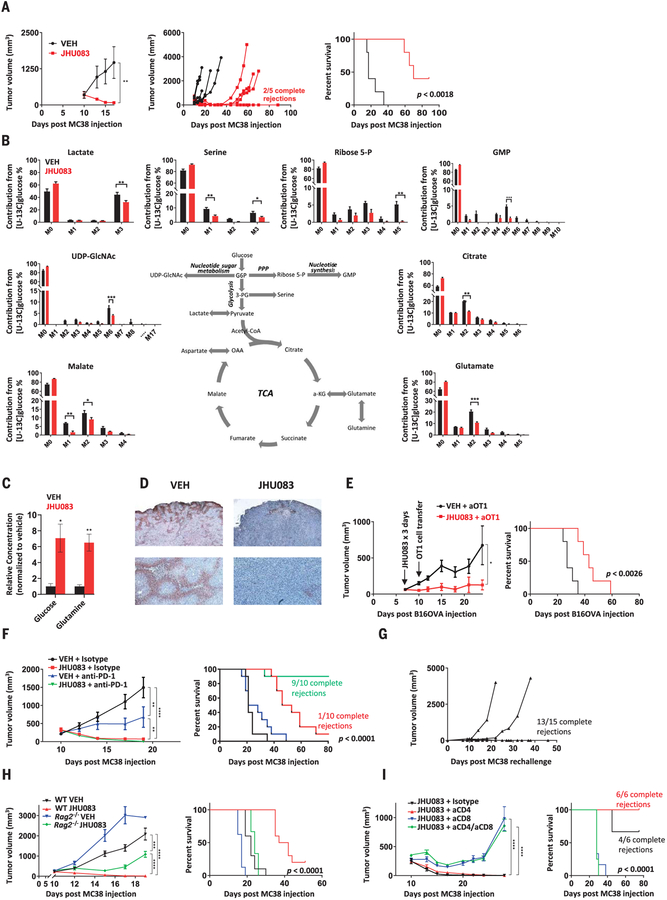
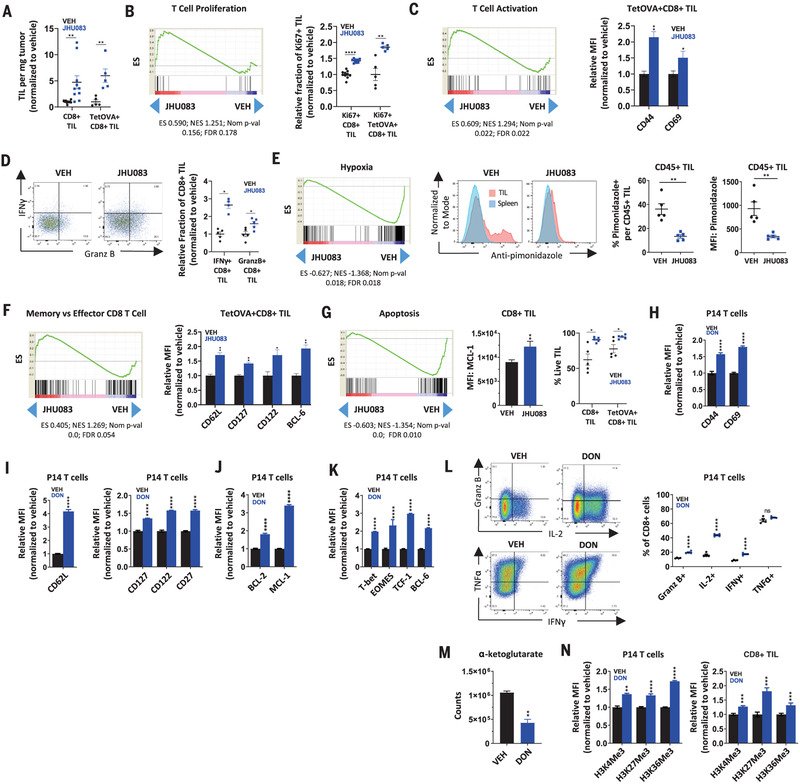
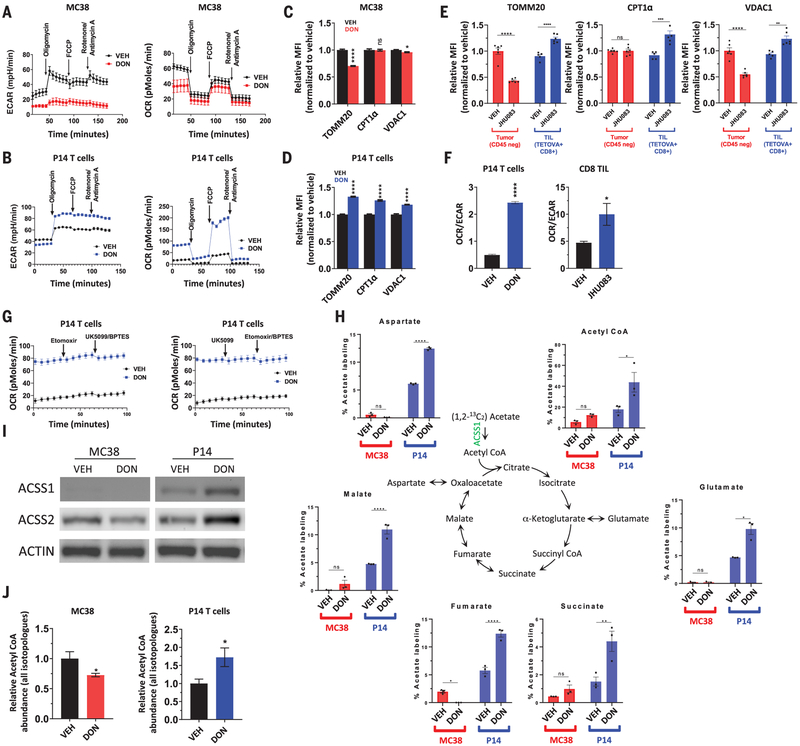
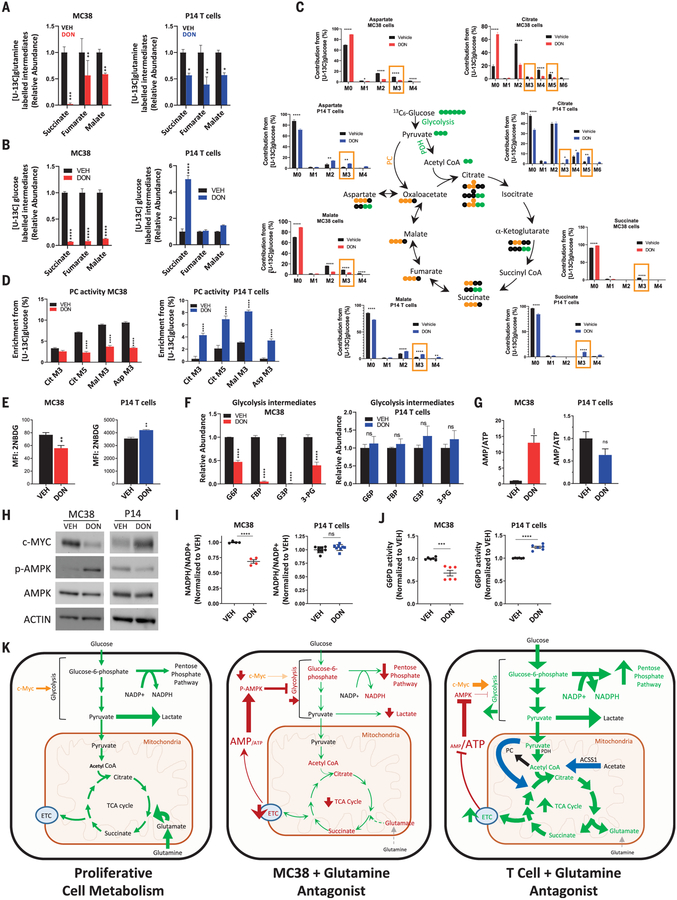
The metabolic characteristics of tumors present considerable hurdles to immune cell function and cancer immunotherapy. Using a glutamine antagonist, we metabolically dismantled the immunosuppressive microenvironment of tumors. We demonstrate that glutamine blockade in tumor-bearing mice suppresses oxidative and glycolytic metabolism of cancer cells, leading to decreased hypoxia, acidosis, and nutrient depletion. By contrast, effector T cells responded to glutamine antagonism by markedly up-regulating oxidative metabolism and adopting a long-lived, highly activated phenotype. These divergent changes in cellular metabolism and programming form the basis for potent antitumor responses. Glutamine antagonism therefore exposes a previously undefined difference in metabolic plasticity between cancer cells and effector T cells that can be exploited as a "metabolic checkpoint" for tumor immunotherapy.


Conflict of interest statement

Competing interests: J.D.P., B.S.S., and R.R. are scientific founders, paid consultants (J.D.P. and B.S.S.), and have equity in Dracen Pharmaceuticals. Technology arising in part from the studies described herein were patented by Johns Hopkins University and subsequently licensed to Dracen Pharmaceuticals (JHU083 is currently labeled as DRP-083). R.D.L., J.M.E., B.S.S., R.R., J.A., and J.D.P. are inventors for pending patent application no. PCT/US16/44829, submitted by Johns Hopkins University that covers the use of glutamine analogs, such as JHU083 (DRP-083), for cancer immunotherapy.

Figures

Fig. 1.
Fig. 1.. Glutamine blockade suppresses cancer cell metabolic programs and enhances antitumor immune response.
(A) Average tumor growth curve (left), spider plots (center), and survival curve (right) from vehicle (VEH)– and JHU083-treated MC38-bearing mice. (B) In vivo 13C-glucose tracing experiment in MC38 tumor–bearing mice. M, unlabeled mass of isotope; M+n, native metabolite mass (M) plus number of isotopically labeled carbons (n); UDP-GlcNAc, uridine diphosphate N-acetylglucosamine; G6P, glucose-6-phosphate; GMP, guanosine monophosphate; 3-PG, d-glycerate 3-phosphate; OAA, oxaloacetate; α-KG, α-ketoglutarate. (C) Relative mass spectrometric quantification of glucose and glutamine in MC38 tumors from vehicle- and JHU083-treated mice (per milligram tumor tissue, normalized to vehicle group). (D) Pimonidazole immunohistochemistry staining for hypoxia in tumor sections from vehicle- and JHU083-treated mice. (E) B16OVA-bearing C57BL/6 mice treated with JHU083 or vehicle on days 7 to 9 after tumor inoculation received 1.5 × 10⁶ activated OTI T cells on day 10. Tumor growth curve (left) and survival curve (right) are shown. (F) MC38-bearing C57BL/6 mice treated with vehicle, JHU083, anti– PD-1, or combination JHU083 and anti–PD-1 beginning on day 10 after tumor inoculation. Tumor growth curve (left) and survival curve (right) are shown. (G) Mice initially cured with 14 days of JHU083 treatment were rechallenged ≥30 days after last dose of JHU083; spider plots of tumor volume are shown. (H) MC38-bearing C57BL/6 wild-type (WT) and Rag2−/− mice treated with 14 days of vehicle or JHU083. Average tumor volume (until first sacrifice in WT VEH group) (left) and survival curve (right) are shown. (I) MC38-bearing C57BL/6 mice treated with JHU083 after depletion of CD8 cells, CD4 cells, or both compared with isotype control. Tumor growth curve (left) and survival curve (right) are shown. Error bars represent SEM. Data are representative of one (B), three [(A), (E) and (F)], or five (D) independent experiments with n = 3 to 10 mice per group. Tumor growth curves were assessed by two-way analysis of variance (ANOVA). Log-rank (Mantel-Cox) tests were performed for survival data. Metabolite data assessed with two-tailed Student’s t test for multiple comparisons. *p < 0.05, **p < 0.01, ***p < 0.001, and ****p < 0.0001 using two-tailed Student’s t test.
Fig. 2.
Fig. 2.. Glutamine blockade conditions CD8+ TILs toward a highly proliferative, activated, and long-lived phenotype.
C57BL/6 mice with MC38 or MC38OVA tumors were treated on days 14 to 18 with vehicle or JHU083 (0.3 mg per kilogram of body weight per day) and sacrificed on day 18 for analysis. (A) Percentage of live CD8+ or TetOVA+CD8+ TILs per tumor weight for MC38 and MC38OVA models, respectively. TetOVA, tetramer-OVA. (B) GSEA tracing for positive regulation of αβ T cell proliferation (left) and percentage of Ki67+ cells per CD8+ in MC38 model or TetOVA+CD8+ in MC38OVA model (right). ES, enrichment score; NES, normalized enrichment score; FDR, false discovery ratio. (C) GSEA tracing for αβ T cell activation (left) and mean fluorescence intensity (MFI) of CD44 and CD69 of TetOVA+CD8+ TILs in MC38OVA model (right). (D) Relative fraction (normalized to vehicle) of IFN-g+ and granzyme B+ per CD8+ TILs from the MC38OVA model after ex vivo stimulation with SIINFEKL peptide for 4 hours. (E) GSEA tracing for hypoxic exposure (left) and FACS plots (center) and data summary (right) showing percentage of pimonidazole positive and pimonidazole MFI of CD45+ TILs in the MC38 model. (F) GSEA tracings for memory versus KLRG1high effector CD8+ T cells (left) and relative MFI of CD62L, CD127, CD122, and BCL-6 of TetOVA+CD8+ TILs (right). (G) GSEA tracing for apoptosis (left), MFI of MCL-1 on CD8+ in MC38 model (center), and live-cell percentage of CD8+ TILs in MC38 model and TetOVA+CD8+ in MC38OVA model (right). (H to K) Naïve P14 T cells activated in the presence of vehicle or DON (1 mM) for 2 days, rested in IL-2 for two additional days with vehicle or DON, and analyzed by FACS for activation markers (H), memory markers (I), survival markers (J), and transcription factors (K). (L) P14 T cells activated for 2 days as described and rested for 4 days in the presence of vehicle or DON before restimulation (with no drug present) for 4 hours. Flow plots (left) and data summary (right) for intracellular cytokines are shown. (M) Relative α-ketoglutarate levels at 36 hours post–P14 activation. (N) H3 histone trimethylation levels in P14 T cells 3 days post-activation (left) and CD8+ TILs (right). H3K4Me3, trimethylated histone H3 lysine 4; H3K27Me3, trimethylated histone H3 lysine 27; H3K36Me3, trimethylated histone H3 lysine 36. Error bars represent SEM. For MC38OVA experiments, FACS data are representative of two or three independent experiments with n = 5 mice per group. For MC38 experiments, FACS summary plots are combination data from two independent experiments with n = 5 mice per group. For RNA-seq, data are from treated and untreated groups of five mice in each group. In vitro experiments are representative of three to five independent experiments with n = 3 to 6. *p < 0.05, **p < 0.01, ***p < 0.001, ****p < 0.0001, and ns is not significant using two-tailed Student’s t test.
Fig. 3.
Fig. 3.. Activated CD8+ T cells and MC38 tumor cells enact distinct metabolic programs in response to glutamine antagonist treatment.
(A to D) Differential metabolic characteristics of vehicle- versus DON-treated MC38 cells and vehicle- versus DON-treated activated P14 CD8+ T cells in vitro. ECAR and OCR from metabolic flux analyses [(A) and (B)]. FCCP, carbonyl cyanide-4-(trifluoromethoxy)phenylhydrazone. Relative expression of mitochondrial proteins [(C) and (D)]. (E) Differential expression of mitochondrial proteins in CD8+ TILs and CD45-negative tumor cells from explanted MC38 tumors. (F) OCR/ECAR ratio in vehicle- and DON-treated activated P14 CD8+ T cells in vitro (left) and in CD8+ TILs harvested from MC38 murine tumors after vehicle or JHU083 treatment (right). (G) OCR response to etomoxir, UK5099, and BPTES in vehicle-versus DON-treated activated P14 CD8+ T cells in vitro. (H to J) Vehicle-versus DON-treated MC38 cells and vehicle- and DON-treated activated T CD8+ T cells in vitro. Liquid chromatography–mass spectrometry (LC-MS) analysis of TCA intermediates after stable isotope tracing with [1,2-13C] acetate (H). Western blot analysis of ACSS1 and ACSS2 expression. ACTIN is used as a loading control (I). LC-MS analysis of relative acetyl-CoA abundance (J). Error bars represent SEM. Data are representative of three [(A), (C), (D), (E), (G), and (I)] or six [(B) and (F)] independent experiments with n = 3 to 8 mice per group. *p < 0.05, **p < 0.01, ***p < 0.001, ****p < 0.0001, and ns is not significant using two-tailed Student’s t test.
Fig. 4.
Fig. 4.. In response to glutamine blockade, activated CD8+ T cells, but not MC38 tumor cells, replenish TCA intermediates by up-regulating glucose anaplerosis.
(A to J) Metabolic characteristics of vehicle- versus DON-treated MC38 cells (red) and vehicle- versus DON-treated activated P14 CD8+ T cells (blue) in vitro. Relative abundance of labeled intermediates of the TCA cycle during [U-13C] glutamine (A) and [U-13C] glucose (B) tracing experiments. LC-MS analysis of TCA intermediates with [U-13C] glucose tracing (C). For (C), in the bar graphs, M3 and M5 values enclosed in yellow rectangles correspond to isotopologs indicative of PC activity, and in the TCA cycle diagram, PDH is pyruvate dehydrogenase; green and yellow circles indicate carbon atoms derived from PDH and PC activity, respectively; and black circles indicate unlabeled carbon atoms. Relative labeling of TCA isotopologues characteristic of PC activity (D). 2-NBDG uptake by flow cytometry analysis (E). Relative abundance of glycotic intermediates in MC38 (left) and P14 T cells (right) (F). G6P, glucose-6-phosphate; FDP, fructose-1,6-bis-phosphate; G3P, d-glyceraldehyde 3-phosphate; 3-PG, d-glycerate 3-phosphate. Relative AMP/ATP ratio (G). Western blot of c-MYC, phospho-AMPK, and total AMPK expression (H). ACTIN is used as a loading control. Relative NADP+/NADPH ratio (I). Relative G6PD activity (J). Error bars represent SEM. Data are representative of three or four independent experiments [(E), (H), (I), and (J)] with n = 3 or 4 [(E), (I), and (J)]. (G) is abundance data compiled from three independent tracing studies. *p < 0.05, **p < 0.01, ***p < 0.001, ****p < 0.0001, and ns is not significant using two-tailed Student’s t test. (K) Model depicting relative activity of fundamental metabolic pathways in highly proliferative cells (left), glutamine-inhibited MC38 cancer cells (center), and glutamine-inhibited effector CD8+ T cells (right). Highly proliferative cells in nutrient-rich microenvironments engage high levels of aerobic glycolysis (Warburg physiology), PPP activity, and glutaminolysis to maintain energy, redox, and metabolite homeostasis. Disruption of glutamine metabolism in MC38 cells leads to increased AMP/ATP ratio and decreased c-MYC, such that proximal glycolytic metabolism is suppressed and cells can no longer rely on Warburg physiology, the PPP, or TCA cycle activity. By contrast, activated T cells adapt to glutamine blockade and maintain redox and energy homeostasis by up-regulating OXPHOS through acetate catabolism, generating high levels of acetyl-CoA as a two-carbon source for the TCA cycle, and up-regulating PC activity for glucose anaplerosis. ETC, electron transport chain.

Comment in

References

    1. Pavlova NN, Thompson CB, Cell Metab 23, 27–47 (2016). - PMC - PubMed
    1. Wolpaw AJ, Dang CV, Trends Cell Biol 28, 201–212 (2018). - PMC - PubMed
    1. Altman BJ, Stine ZE, Dang CV, Nat. Rev. Cancer 16, 619–634 (2016). - PMC - PubMed
    1. Zhang J, Pavlova NN, Thompson CB, EMBO J 36, 1302–1315 (2017). - PMC - PubMed
    1. Frauwirth KA et al. , Immunity 16, 769–777 (2002). - PubMed

Publication types

MeSH terms