. 2019 Nov 7;10(1):5052.
doi: 10.1038/s41467-019-12969-x.

Quantitating the epigenetic transformation contributing to cholesterol homeostasis using Gaussian process

Affiliations

Quantitating the epigenetic transformation contributing to cholesterol homeostasis using Gaussian process

Chao Wang et al. Nat Commun. .

Abstract

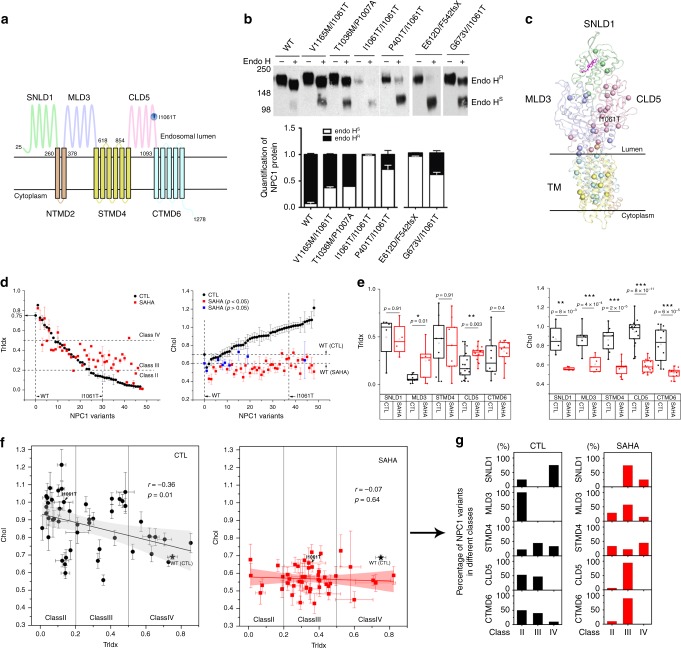
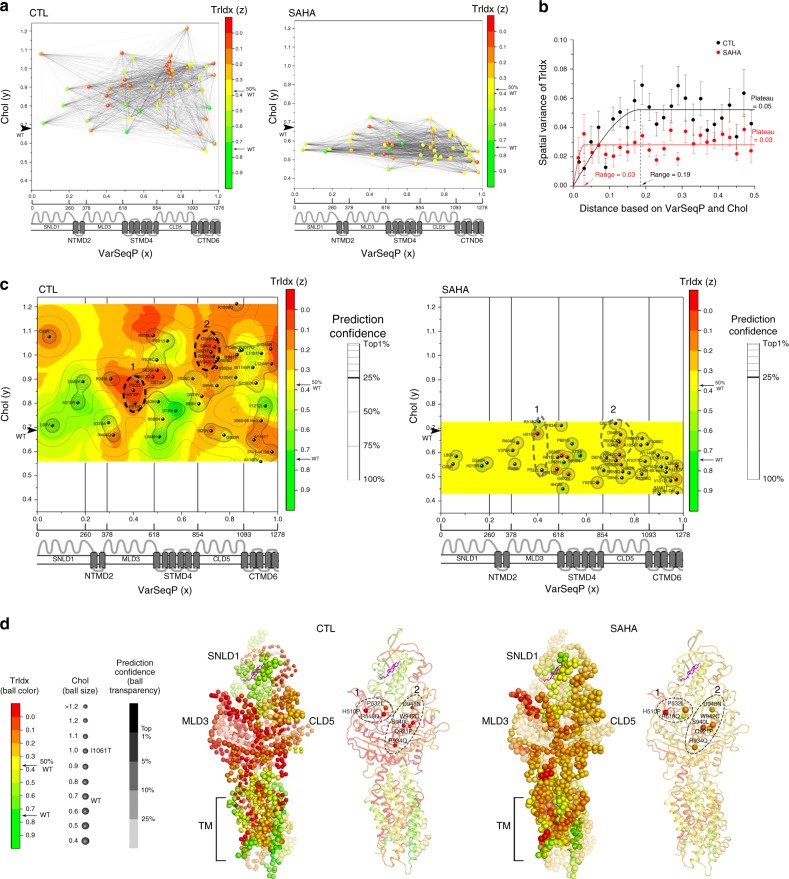
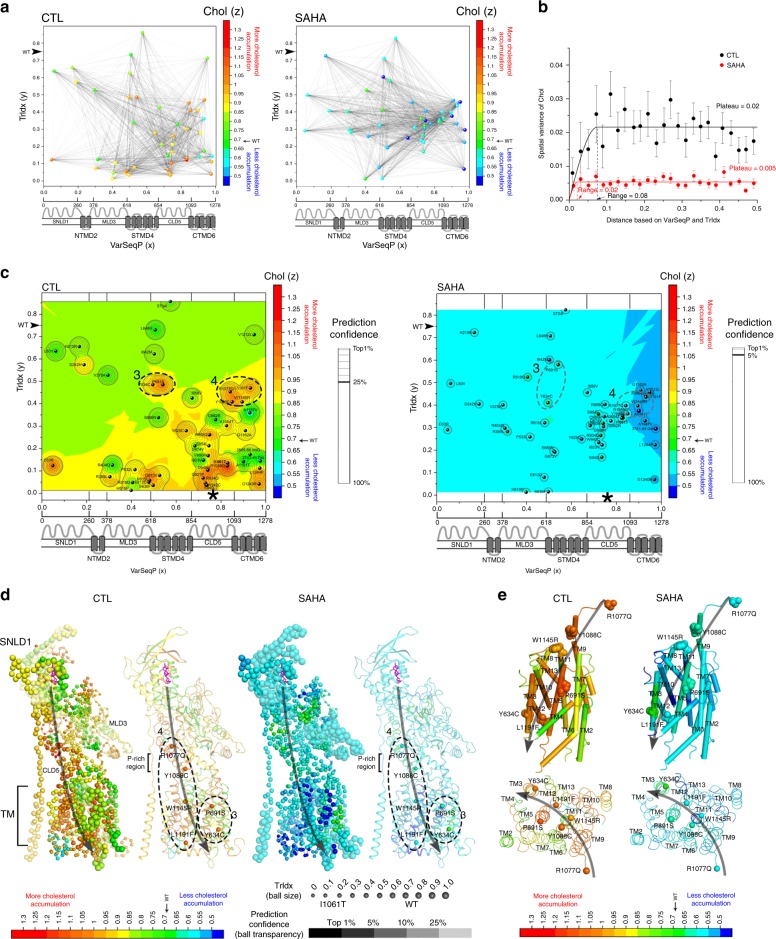
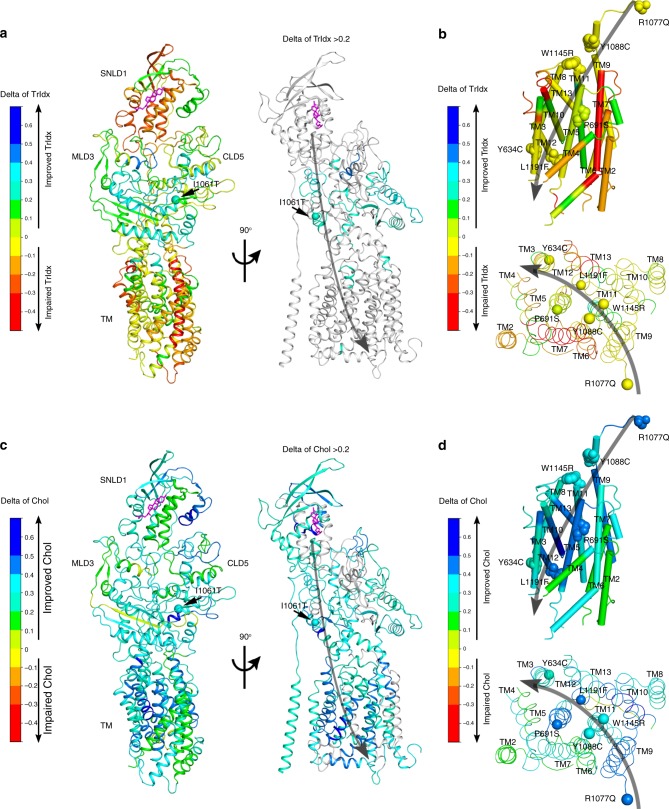
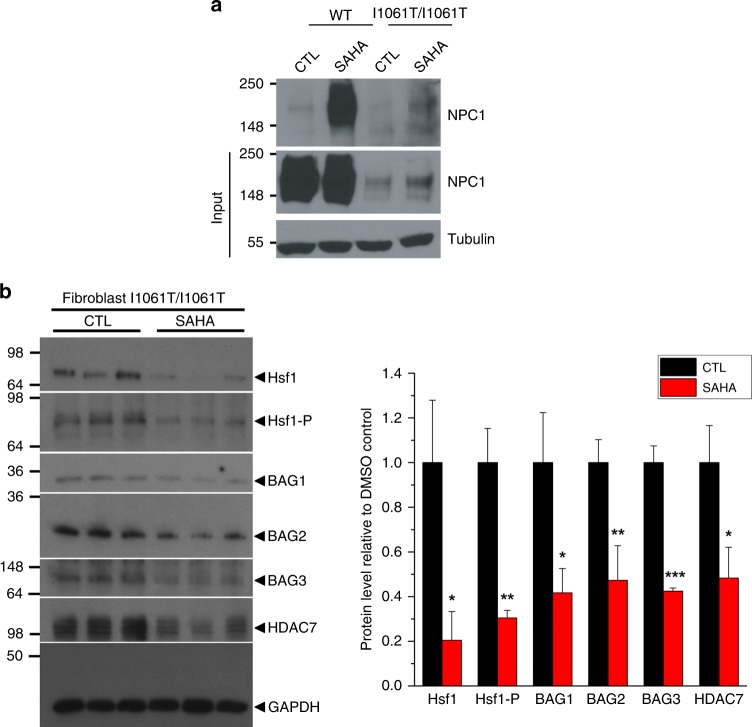
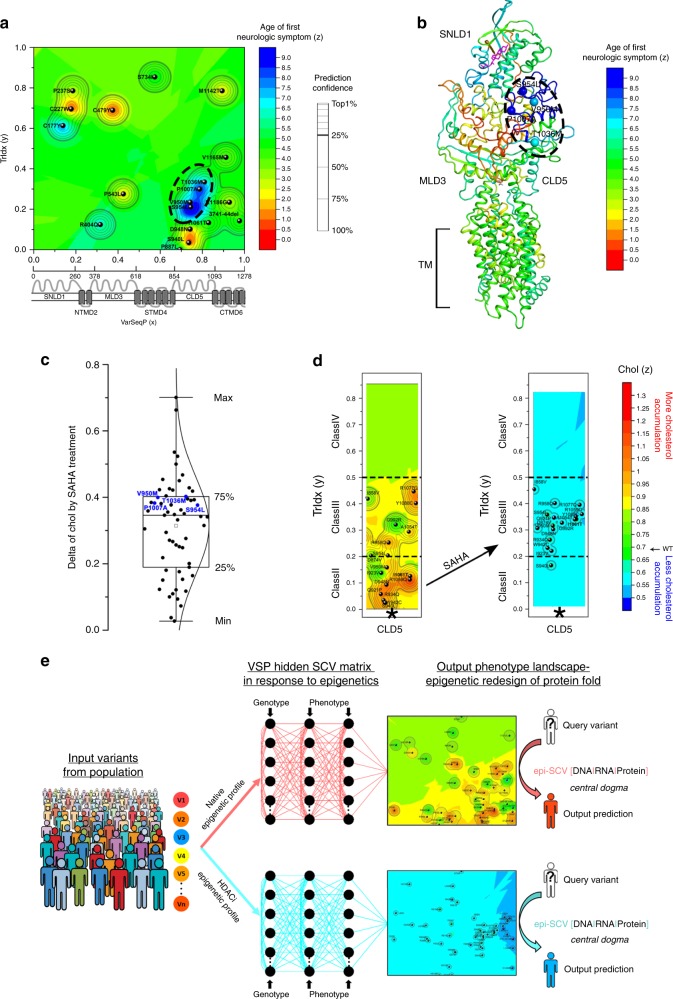
To understand the impact of epigenetics on human misfolding disease, we apply Gaussian-process regression (GPR) based machine learning (ML) (GPR-ML) through variation spatial profiling (VSP). VSP generates population-based matrices describing the spatial covariance (SCV) relationships that link genetic diversity to fitness of the individual in response to histone deacetylases inhibitors (HDACi). Niemann-Pick C1 (NPC1) is a Mendelian disorder caused by >300 variants in the NPC1 gene that disrupt cholesterol homeostasis leading to the rapid onset and progression of neurodegenerative disease. We determine the sequence-to-function-to-structure relationships of the NPC1 polypeptide fold required for membrane trafficking and generation of a tunnel that mediates cholesterol flux in late endosomal/lysosomal (LE/Ly) compartments. HDACi treatment reveals unanticipated epigenomic plasticity in SCV relationships that restore NPC1 functionality. GPR-ML based matrices capture the epigenetic processes impacting information flow through central dogma, providing a framework for quantifying the effect of the environment on the healthspan of the individual.


Conflict of interest statement

The authors declare no competing interests. The authors declare no advisory, management, or consulting positions. C.W. and W.E.B. have filed PCT Application Serial No. PCT/US2019/046028.

Figures

Fig. 1
Fig. 1
Response of NPC1 variants to SAHA. a Schematic representation of domains in NPC1 (sterol-binding luminal N-terminal domain 1 (SNLD1), N-terminal transmembrane domain 2 (NTMD2), middle luminal domain 3 (MLD3), sterol-sensing transmembrane domain 4 (STMD4), C-terminal luminal domain 5 (CLD5), C-terminal transmembrane domain 6 (CTMD6)). b (Upper panel) Trafficking of NPC1 variants from the ER (Endo H sensitive (Endo HS)) to post-ER LE/LY compartments (Endo H resistant (Endo HR)) glycoforms in wild-type (WT) and NPC1 patient fibroblasts. (Bottom panel) Fraction of total of NPC1 in Endo HR (black) and Endo HS (white) glycoforms (mean ± s.d.). c NPC1 variants are mapped as balls on the C-alpha position in the NPC1 structure,. The cholesterol molecule is shown in magenta,. d (Left panel) Trafficking index (TrIdx) of 48 NPC1 variants in the absence (black circles as control (CTL)) or presence of SAHA (red squares). WT, I1061T variants are indicated by vertical dash lines and trafficking classes (II, III, IV) by horizontal dash lines. (Right panel) Cholesterol (Chol) homeostasis of 48 NPC1 variants in the absence (black circles as control (CTL)) or presence of SAHA (red squares for p-value < 0.05; blue squares for p-value > 0.05; student’s two tailed t-test). WT and I1061T variants are indicated by vertical dash lines. Chol of WT in the absence or presence of SAHA highlighted by horizontal dashed lines. Data are presented as mean ± s.e.m. (Source data are provided as a Source Data file). e Domain specific response to SAHA. NPC1 variants are clustered into different domains for TrIdx (left panel) and Chol (right panel) comparison (box and whisker plot: box = 25th and 75th, whiskers extend from minimum to maximum of the data; p-value (Student’s two tailed t-test)). f Correlation between TrIdx and Chol of NPC1 variants in the absence (left panel) or presence (right panel) of SAHA. Pearson’s r and the p-value (ANOVA test) with null hypothesis as the coefficient equal to zero is indicated. g Redistribution of different trafficking classes in response to SAHA. The percentage of variants in different classes in absence (f, left panel) or presence (f, right panel) of SAHA is shown
Fig. 2
Fig. 2
TrIdx-phenotype landscape and TrIdx-structure in the absence and presence of SAHA. a NPC1 variants are positioned by their variant sequence position (VarSeqP) (x-axis) normalized to the full-length sequence and measured Chol values of NPC1 variants (y-axis normalized to I1061T) in the absence (left panel) or presence (right panel) of SAHA. The projected z-axis (color gradient) is defined by the absolute measured TrIdx of each variant. The spatial relationships of pairwise comparisons of variants are illustrated as black lines. b The molecular variogram illustrating the spatial variance of measured TrIdx for distance values defined by VarSeqP and Chol in the absence (black line) or presence (red line) of SAHA (see Methods; Supplementary Fig. 6a). c VSP predicted TrIdx-phenotype landscape is shown as a heatmap in the absence (left panel) or presence (right panel) of SAHA. Confidence relationships (see Supplementary Fig. 6b) within the molecular variogram range are plotted as contour lines and the top 25% confidence quartile is shown as a bold line. Color-scale values: defective trafficking (red); ~50% WT trafficking (yellow); WT trafficking (green). I1061T ER-restricted variant is bolded. Dashed ovals 1 and 2 highlight two SCV clusters found in the top 25% confidence quartiles that have defective trafficking in the absence of SAHA. d Mapping the TrIdx-phenotype landscape on the NPC1 structure,. The highest confident prediction of the TrIdx value and the corresponding Chol value is assigned for each residue with ball color representing TrIdx, ball size representing Chol, and transparency representing prediction confidence. SCV cluster 1 and 2 are selectively highlighted as balls in cartoon presentation of the structure
Fig. 3
Fig. 3
Chol-phenotype landscape and Chol-structure in the absence and presence of SAHA. a NPC1 variants are positioned by their variant sequence position (VarSeqP) (x-axis) normalized to the full-length sequence and the measured TrIdx values of NPC1 variants (y-axis) in the absence (left panel) or presence (right panel) of SAHA. The projected z-axis (color gradient) is defined by the measured Chol of each variant normalized to I1061T. The spatial relationships of pairwise comparisons of variants are illustrated as black lines. b The molecular variogram illustrating the spatial variance of measured Chol for distance values defined by VarSeqP and TrIdx in the absence (black line) or presence (red line) of SAHA (see Methods; Supplementary Fig. 7a). c The VSP predicted Chol-phenotype landscape is shown as a heatmap in the absence (left panel) or presence (right panel) of SAHA. Confidence relationships (see Supplementary Fig. 7b) within the molecular variogram range are plotted as contour lines with the top 25% confidence quartile shown as a bold line in control condition (left panel) and top 5% confidence level shown as bold in SAHA condition (right panel). Color-scale values: severe Chol accumulation (red); WT Chol accumulation (green). I1061T ER-restricted variant is bolded. Dashed ovals 3 and 4 highlight two SCV clusters defined by the top 25% quartile that have good TrIdx but defective Chol. d Mapping the Chol-phenotype landscape on the NPC1 structure,. The highest confident prediction of the Chol value and the corresponding TrIdx value is assigned for each residue with ball color representing Chol, ball size representing TrIdx, and transparency representing prediction confidence. SCV clusters 3 and 4 are selectively highlighted as balls in cartoon presentation of the structure. The proposed cholesterol flow path is shown in gray arrow. e Transmembrane region is shown in side view as cylinders (upper panel) or in top view as loops (lower panel) colored by predicted Chol value. Transmembrane helices 1–13 are labeled. The variants in SCV clusters 3 and 4 are labeled and shown in spheres (upper panel) or with C-alpha shown in balls (lower panel)
Fig. 4
Fig. 4
The SAHA responsive structures for TrIdx and Chol. NPC1 structure is colored by the predicted delta value of TrIdx (a, b) or delta value of Chol (c, d) in response to SAHA. Color-scale values: impair of TrIdx or Chol homeostasis (red-orange), no change (yellow), improve of TrIdx or Chol homeostasis (cyan-blue). In the right panel of (a) and (c), regions with delta value < 0.2 are shown in gray to highlight the regions corrected by HDACi (i.e., delta value > 0.2). Transmembrane helices 1–13 are labeled in panels (b) and (d). Variants critical for predicted cholesterol flow path are highlighted and labeled in panels (b) and (d)
Fig. 5
Fig. 5
Hyperacetylation of NPC1 and proteostasis impact by SAHA. a SAHA leads hyperacetylation of both WT and I1061T-NPC1. Cell lysate of WT or I1061T/I1061T patient fibroblast was immunoprecipitated by acetylated-lysine (AcK) antibody and then recognized by NPC1 antibody through western blot. b SAHA impacts the expression of proteostasis components. Immunoblot analysis of SAHA-treated (10 µM for 48 h) I1061T/I1061T homozygous fibroblast (left panel) and quantification of total Hsf1, Hsf1 phosphorylated (Hsf1-P), BAG1, BAG2, BAG3, and HDAC7 (right panel) are shown. GAPDH was used as Western blot loading control. Data is presented as fold change to DMSO treatment (mean ± s.d., n = 3). P-values are indicated using student’s two tailed t-test (*p < 0.05, **p<0.01, ***p<0.001)
Fig. 6
Fig. 6
VSP links bench to bedside. a 19 variants from 27 patients with natural history information (Supplementary Table 3) are used as input value for VSP to generate the ANO-phenotype landscape that uses variant position information (x-axis) and cell-based TrIdx measurement (y-axis) to predict the ANO in the clinic (z-axis, color scale). The SCV cluster with late ANO (cyan-blue) in top 25% quartile of prediction confidence is highlighted by dashed oval. b The predicted ANO with highest confidence for each residue is mapped on the structure with the color code the same as panel (a). Variants with late ANO are shown in balls and labeled. c Distribution of the delta value of cholesterol homeostasis in response to SAHA for all the variants tested. The variants with late ANO in the SCV cluster are shown in blue and labeled. d The Chol-phenotype landscape of CLD5 (Fig. 3c, asterisks) are shown with the TrIdx classes highlighted by dash lines. Black arrow indicates the TrIdx and Chol shift of class II CLD5 variants to class III in response to SAHA. e HDACi remodels the SCV relationships to manage genotype to phenotype transformation. Addition of HDACi to the same collection of variants from NPC1 population creates a new SCV matrix linking genotype to phenotype. VSP captures the impact of these epigenetic changes through SCV matrices to interpret and predict the dynamics of protein fold for its function in the context of local epigenetic environment. The epigenetic modulation of SCV (epi-SCV in the figure) provides a quantitative platform to characterize the ability of the environment to manage the information flow through central dogma (epi-SCV[DNA|RNA|Protein])

Similar articles

Cited by

References

    1. Wang C, Balch WE. Bridging genomics to phenomics at atomic resolution through variation spatial profiling. Cell Rep. 2018;24:2013–2028 e6. doi: 10.1016/j.celrep.2018.07.059. - DOI - PMC - PubMed
    1. Hindorff LA, et al. Prioritizing diversity in human genomics research. Nat. Rev. Genet. 2018;19:175–185. doi: 10.1038/nrg.2017.89. - DOI - PMC - PubMed
    1. Torkamani A. Drilling for insight: forecasting phenotype from genotype. Trends Genet. 2018;34:821–822. doi: 10.1016/j.tig.2018.09.001. - DOI - PubMed
    1. Balch WE, Morimoto RI, Dillin A, Kelly JW. Adapting proteostasis for disease intervention. Science. 2008;319:916–919. doi: 10.1126/science.1141448. - DOI - PubMed
    1. Ali I, Conrad RJ, Verdin E, Ott M. Lysine acetylation goes global: from epigenetics to metabolism and therapeutics. Chem. Rev. 2018;118:1216–1252. doi: 10.1021/acs.chemrev.7b00181. - DOI - PMC - PubMed

Publication types

MeSH terms