

Intracellular K+ and water content in human blood lymphocytes during transition from quiescence to proliferation
- PMID: 31700012
- PMCID: PMC6838062
- DOI: 10.1038/s41598-019-52571-1
Intracellular K+ and water content in human blood lymphocytes during transition from quiescence to proliferation
Abstract
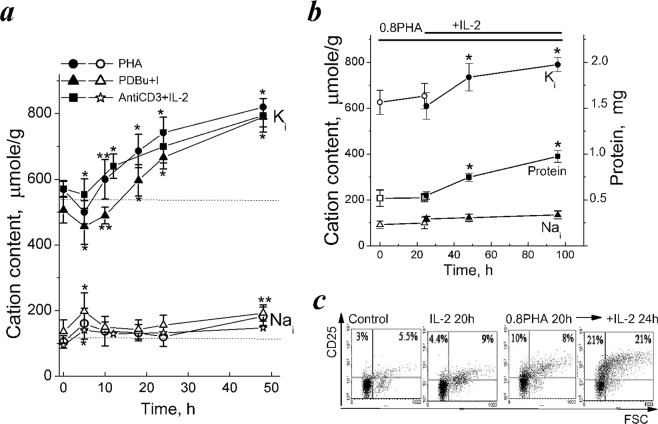
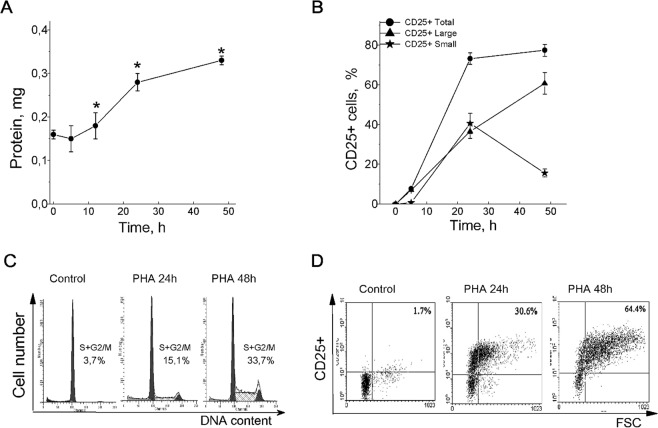
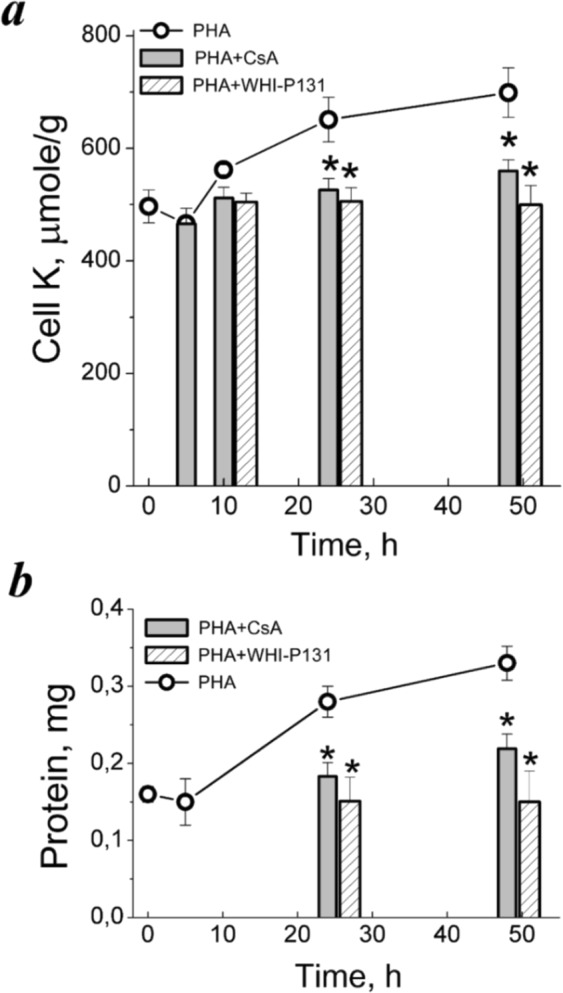
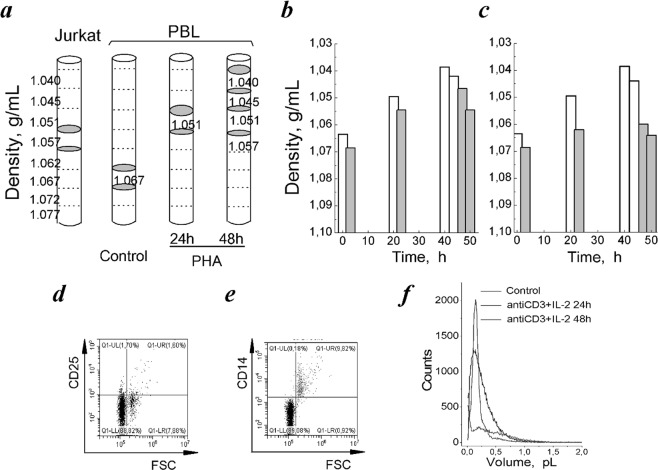
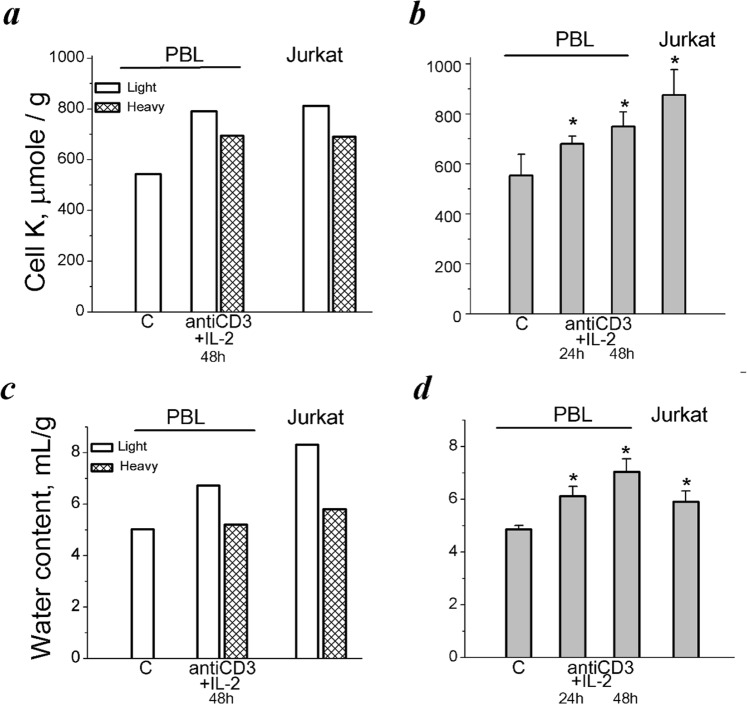
Many evidence shows that K+ ions are required for cell proliferation, however, changes in intracellular K+ concentration during transition of cells from quiescence to cycling are insufficiently studied. Here, we show using flame emission assay that a long-term increase in cell K+ content per g cell protein is a mandatory factor for transition of quiescent human peripheral blood lymphocytes (PBL) to proliferation induced by phytohemagglutinin, phorbol ester with ionomycin, and anti-CD3 antibodies with interleukin-2 (IL-2). The long-term increase in K+ content is associated with IL-2-dependent stage of PBL activation and accompanies the growth of small lymphocytes and their transformation into blasts. Inhibition of PBL proliferation with drugs specific for different steps of G0/G1/S transit prevented both blast-transformation and an increase in K+ content per cell protein. Determination of the water content in cells by measuring the density of cells in the Percoll gradient showed that, unlike the K+ content, the concentration of K+ in cell water remains unchanged, since water and K+ change in parallel. Correlation of proliferation with high cell K+ and water content has been confirmed by the data obtained in comparative study of PBL and permanently cycling Jurkat cells. Our data suggest that K+ is important for successful proliferation as the main intracellular ion that participates in regulation of cell water content during cell transition from quiescence to proliferation. We concluded that high K+ content in cells and the associated high water content is a characteristic feature of proliferating cells.
Conflict of interest statement
The authors declare no competing interests.
Figures
Similar articles
-
The Role of Intracellular Potassium in Cell Quiescence, Proliferation, and Death.Int J Mol Sci. 2024 Jan 10;25(2):884. doi: 10.3390/ijms25020884. Int J Mol Sci. 2024. PMID: 38255956 Free PMC article. Review.
-
[Comparative study of the functional expression of the Na/K-pump in human lymphocytes, activated by phytohemagglutinin, phorbol ester, ionomycin, and interleukin-2].Tsitologiia. 2001;43(2):148-55. Tsitologiia. 2001. PMID: 11347470 Russian.
-
Functional expression of the Na/K pump is controlled via a cyclosporin A-sensitive signalling pathway in activated human lymphocytes.FEBS Lett. 1999 Aug 6;456(2):285-9. doi: 10.1016/s0014-5793(99)00955-2. FEBS Lett. 1999. PMID: 10456325
-
Lymphokine regulation of human lymphocyte proliferation: formation of resting G0 cells by removal of interleukin 2 in cultures of proliferating T lymphocytes.Cell Immunol. 1984 Jul;86(2):337-46. doi: 10.1016/0008-8749(84)90388-5. Cell Immunol. 1984. PMID: 6610479
-
Effect of camptothecin on mitogenic stimulation of human lymphocytes: involvement of DNA topoisomerase I in cell transition from G0 to G1 phase of the cell cycle and in DNA replication.J Cell Physiol. 1992 Jun;151(3):478-86. doi: 10.1002/jcp.1041510306. J Cell Physiol. 1992. PMID: 1338332
Cited by
-
GDF15, an Emerging Player in Renal Physiology and Pathophysiology.Int J Mol Sci. 2024 May 29;25(11):5956. doi: 10.3390/ijms25115956. Int J Mol Sci. 2024. PMID: 38892145 Free PMC article. Review.
-
The Role of Intracellular Potassium in Cell Quiescence, Proliferation, and Death.Int J Mol Sci. 2024 Jan 10;25(2):884. doi: 10.3390/ijms25020884. Int J Mol Sci. 2024. PMID: 38255956 Free PMC article. Review.
-
Monovalent ions and stress-induced senescence in human mesenchymal endometrial stem/stromal cells.Sci Rep. 2022 Jul 1;12(1):11194. doi: 10.1038/s41598-022-15490-2. Sci Rep. 2022. PMID: 35778548 Free PMC article.
-
Mesenchymal Stem/Stromal Cells in Three-Dimensional Cell Culture: Ion Homeostasis and Ouabain-Induced Apoptosis.Biomedicines. 2023 Jan 21;11(2):301. doi: 10.3390/biomedicines11020301. Biomedicines. 2023. PMID: 36830836 Free PMC article.
-
Role of NKCC1 Activity in Glioma K+ Homeostasis and Cell Growth: New Insights With the Bumetanide-Derivative STS66.Front Physiol. 2020 Jul 31;11:911. doi: 10.3389/fphys.2020.00911. eCollection 2020. Front Physiol. 2020. PMID: 32848856 Free PMC article.
References
Publication types
MeSH terms
Substances
LinkOut - more resources
Full Text Sources
Medical
Research Materials
