. 2019 Nov 7;9(1):16229.
doi: 10.1038/s41598-019-52834-x.

Genetic Ablation of Calcium-independent Phospholipase A2γ Exacerbates Glomerular Injury in Adriamycin Nephrosis in Mice

Affiliations

Genetic Ablation of Calcium-independent Phospholipase A2γ Exacerbates Glomerular Injury in Adriamycin Nephrosis in Mice

Hanan Elimam et al. Sci Rep. .

Abstract

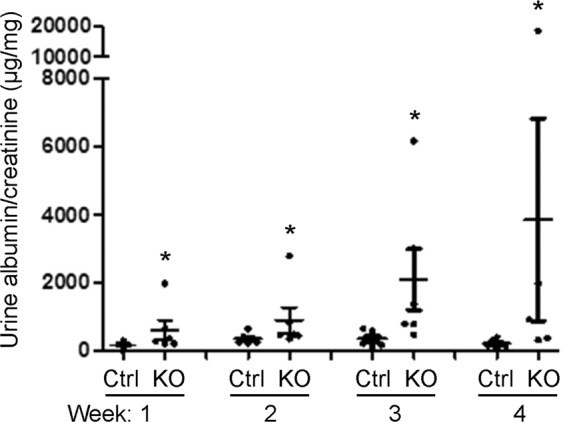
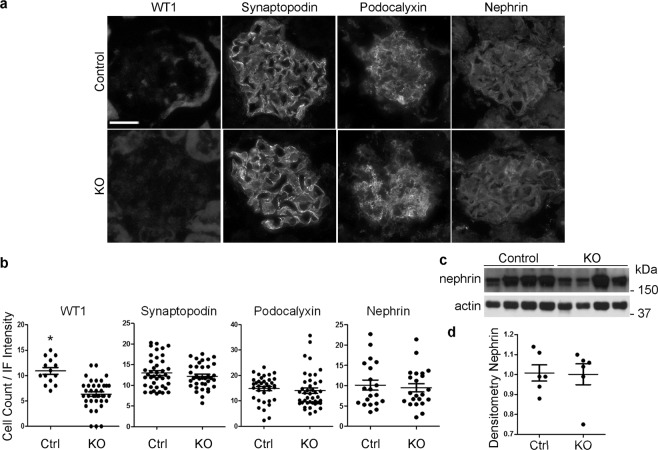
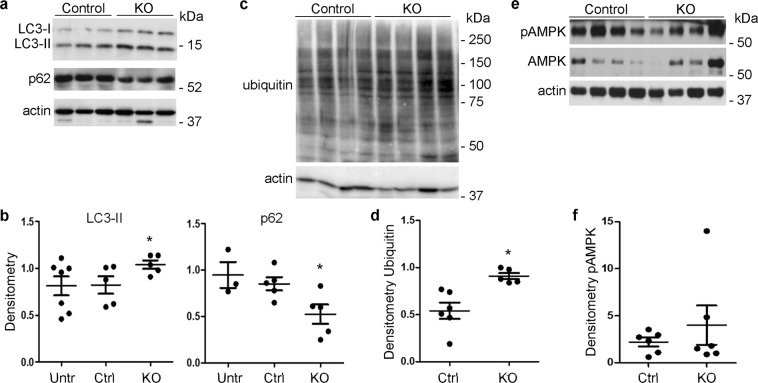
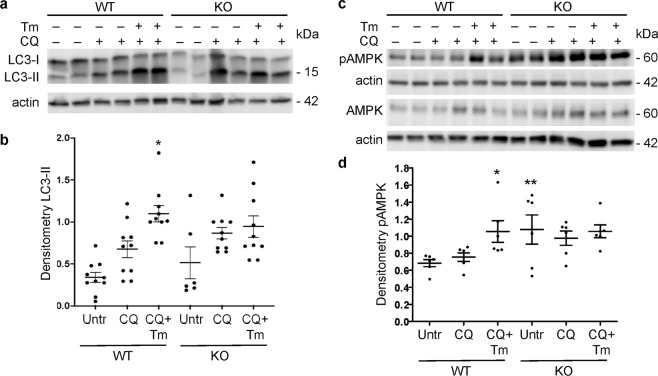
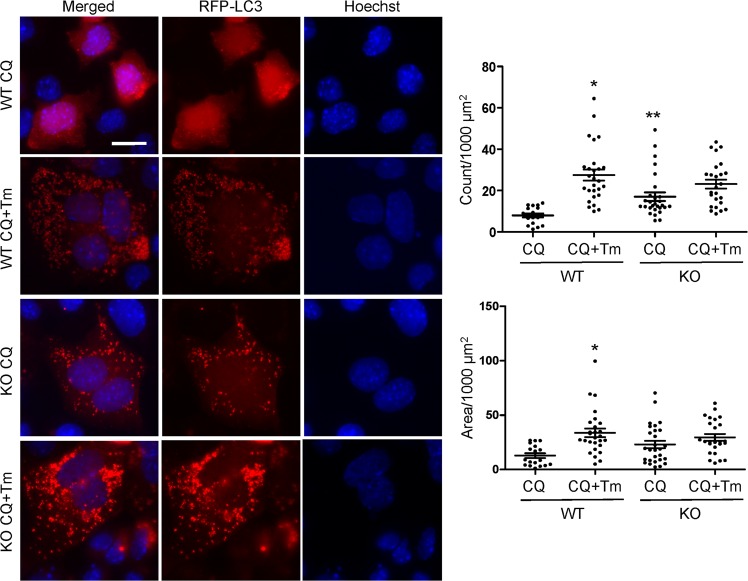
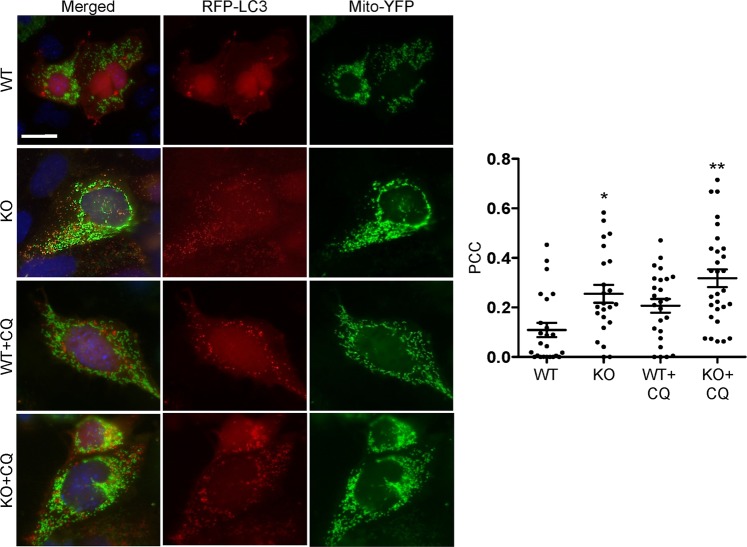
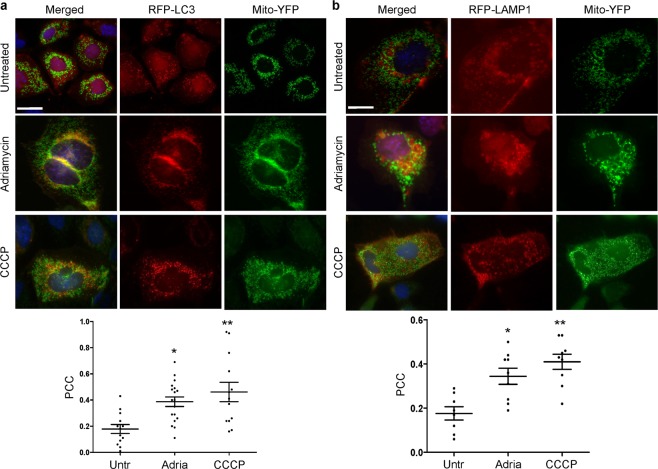
Genetic ablation of calcium-independent phospholipase A2γ (iPLA2γ) in mice results in marked damage of mitochondria and enhanced autophagy in glomerular visceral epithelial cells (GECs) or podocytes. The present study addresses the role of iPLA2γ in glomerular injury. In adriamycin nephrosis, deletion of iPLA2γ exacerbated albuminuria and reduced podocyte number. Glomerular LC3-II increased and p62 decreased in adriamycin-treated iPLA2γ knockout (KO) mice, compared with treated control, in keeping with increased autophagy in KO. iPLA2γ KO GECs in culture also demonstrated increased autophagy, compared with control GECs. iPLA2γ KO GECs showed a reduced oxygen consumption rate and increased phosphorylation of AMP kinase (pAMPK), consistent with mitochondrial dysfunction. Adriamycin further stimulated pAMPK and autophagy. After co-transfection of GECs with mito-YFP (to label mitochondria) and RFP-LC3 (to label autophagosomes), or RFP-LAMP1 (to label lysosomes), there was greater colocalization of mito-YFP with RFP-LC3-II and with RFP-LAMP1 in iPLA2γ KO GECs, compared with WT, indicating enhanced mitophagy in KO. Adriamycin increased mitophagy in WT cells. Thus, iPLA2γ has a cytoprotective function in the normal glomerulus and in glomerulopathy, as deletion of iPLA2γ leads to mitochondrial damage and impaired energy homeostasis, as well as autophagy and mitophagy.


Conflict of interest statement

The authors declare no competing interests.

Figures

Figure 1
Figure 1
Deletion of iPLA2γ exacerbates albuminuria in adriamycin nephrosis. Control (Ctrl) and iPLA2γ KO mice were injected with adriamycin (12 mg/kg). Urine was collected at weekly intervals for up to 4 weeks. *P < 0.001 KO vs control; 6 mice per group.
Figure 2
Figure 2
Effect of iPLA2γ on podocyte number and differentiation in adriamycin nephrosis. Kidneys were harvested from control (Ctrl) and iPLA2γ KO mice 4 weeks after adriamycin administration. (a,b) Kidney sections were stained with antibodies to WT1, synaptopodin, podocalyxin and nephrin. (a) Representative IF staining. (b) WT1 counts and quantification of IF intensity. The number of WT1 positive nuclei (reflecting number of podocytes) was lower in KO mice. *P < 0.0001 KO vs control, 14 measurements in control group (4 mice) and 39 in KO group (5 mice). There are no significant differences between control and KO mice in IF staining intensity of synaptopodin (41 measurements in control group, 6 mice, and 36 in KO group, 6 mice), podocalyxin (36 measurements in control group, 6 mice, and 42 in KO group, 6 mice), and nephrin (20 measurements in control group, 4 mice, and 22 in KO group, 4 mice). Bar = 25 µm. (c,d) Glomeruli were isolated from mouse kidneys, and lysates were immunoblotted with anti-nephrin antibody. (c) Immunoblot. An uncropped immunoblot is presented in Supplementary Fig. 5. (d) Densitometric quantification. There are no significant differences in nephrin expression between control and KO (6 mice per group).
Figure 3
Figure 3
Deletion of iPLA2γ enhances autophagy and polyubiquitination in adriamycin nephrosis. Glomeruli were isolated from control (Ctrl) and iPLA2γ KO mice 4 weeks after adriamycin administration. (a,c,e) Representative immunoblots. Uncropped immunoblots are presented in Supplementary Fig. 5. (b,d,f) Densitometric quantification. (a,b) Glomerular lysates were immunoblotted with antibodies to LC3 and p62. LC3-II/actin was increased and p62/actin was decreased in iPLA2γ KO mice. *P < 0.035 KO vs control (adriamycin); 5 mice per group. In panel b, glomerular LC3-II levels in 6 untreated (Untr) mice (2 control and 4 KO) and p62 levels in 3 untreated mice (1 control and 2 KO) are shown for comparison. (c,d) Glomerular lysates were immunoblotted with anti-ubiquitin antibody. *P = 0.005 KO vs control, 6 control mice and 5 KO mice. (e,f) Lysates were immunoblotted with antibodies to pAMPK and AMPK. Levels of AMPK were highly variable among mice, and while there was an upward trend, there was not a significant difference in pAMPK/AMPK between control and KO mice (6 mice per group).
Figure 4
Figure 4
Role of iPLA2γ in basal and ER stress-induced changes in LC3 and pAMPK. WT and iPLA2γ KO GECs were untreated (Untr), or incubated with or without chloroquine (CQ, 25 µM) and tunicamycin (Tm, 5 µg/ml) for 18 h. Lysates were immunoblotted with antibodies to LC3 (a) or AMPK and pAMPK (b). (a,c) Representative immunoblots. Uncropped immunoblots are presented in Supplementary Fig. 5. (b,d) Densitometric quantification. (b) LC3-II/actin *P < 0.0001 KO vs WT (CQ + Tm), P = 0.08 KO vs WT (CQ). LC3-II/actin in KO/CQ was 146 ± 16% of WT/CQ (P < 0.01). 5 experiments performed in duplicate. (d) pAMPK/AMPK *P < 0.05 CQ + Tm vs Untr (WT), **P < 0.05 KO vs WT (Untr). 3 experiments performed in duplicate.
Figure 5
Figure 5
Role of iPLA2γ in basal and ER stress-induced changes in LC3-II puncta. WT and iPLA2γ KO GECs were transfected with RFP-LC3, and were incubated with or without chloroquine (CQ, 25 µM) and tunicamycin (Tm, 5 µg/ml) for 18 h. Representative photomicrographs and quantification of LC3-II puncta are presented. Bar = 25 µm. Puncta count: *P < 0.001 CQ + Tm vs CQ (WT), **P < 0.05 KO vs WT (CQ). Puncta area: *P < 0.001 CQ + Tm vs CQ (WT). 18–28 cells per group in 2 experiments.
Figure 6
Figure 6
Effect of CCCP on pAMPK and LC3. WT and iPLA2γ KO GECs were untreated (Untr), or incubated with CCCP (10 µM) for 18 h. Lysates were immunoblotted with antibodies to AMPK and pAMPK (a) or LC3 (b). (a,c) Representative immunoblots. Uncropped immunoblots are presented in Supplementary Fig. 5. (b,d) Densitometric quantification. (b) pAMPK/AMPK *P < 0.05 CCCP vs Untr (WT), **P < 0.05 CCCP vs Untr (KO). 3 experiments performed in duplicate. (d) LC3-II/actin *P = 0.001 CCCP vs Untr (WT), **P < 0.0001 CCCP vs Untr (KO). 3 experiments performed in duplicate.
Figure 7
Figure 7
Effect of iPLA2γ on delivery of mitochondria to autophagosomes. WT and iPLA2γ KO GECs were co-transfected with RFP-LC3 and mito-YFP cDNAs. Cells were then incubated with or without chloroquine (CQ) for 6 h. Representative photomicrographs and the Pearson correlation coefficient (PCC) for the colocalization of RFP-LC3 and mito-YFP are presented. Bar = 25 µm. *P < 0.01 KO vs WT, **P < 0.05 KO + CQ vs WT + CQ. 23–29 cells per group in 4 experiments.
Figure 8
Figure 8
Effect of iPLA2γ on delivery of mitochondria to lysosomes. WT and iPLA2γ KO GECs were co-transfected with RFP-LAMP1 and mito-YFP cDNAs. Cells were then incubated with or without chloroquine (CQ) for 6 h. Representative photomicrographs and the Pearson correlation coefficient (PCC) for the colocalization of RFP-LAMP1 and mito-YFP are presented. Bar = 25 µm. *P < 0.05 KO + CQ vs WT + CQ. 7–8 cells per group in 2 experiments.
Figure 9
Figure 9
Induction of mitophagy by adriamycin and CCCP. WT GECs were co-transfected with RFP-LC3 and mito-YFP (a) or RFP-LAMP1 and mito-YFP cDNAs. (b) Cells were then untreated (Untr), or incubated with CCCP (10 µM) or adriamycin (Adria; 1 µM) in the presence of chloroquine (CQ) for 24 h. Representative photomicrographs and the Pearson correlation coefficient (PCC) for colocalization are presented. Bars = 25 µm. (a) *P < 0.05 Adriamycin vs Untreated, **P < 0.01 CCCP vs Untreated. 13–18 cells per group in 3 experiments. (b) *P < 0.01 Adriamycin vs Untreated, **P < 0.001 CCCP vs Untreated. 7–8 cells per group in 2 experiments.

References

    1. Pavenstadt H, Kriz W, Kretzler M. Cell biology of the glomerular podocyte. Physiol Rev. 2003;83:253–307. doi: 10.1152/physrev.00020.2002. - DOI - PubMed
    1. Greka A, Mundel P. Cell biology and pathology of podocytes. Annu Rev Physiol. 2012;74:299–323. doi: 10.1146/annurev-physiol-020911-153238. - DOI - PMC - PubMed
    1. Cohen D, et al. Role of calcium-independent phospholipase A2 in complement-mediated glomerular epithelial cell injury. Am J Physiol Renal Physiol. 2008;294:F469–79. doi: 10.1152/ajprenal.00372.2007. - DOI - PubMed
    1. Elimam H, et al. Genetic ablation of calcium-independent phospholipase A2gamma induces glomerular injury in mice. J Biol Chem. 2016;291:14468–82. doi: 10.1074/jbc.M115.696781. - DOI - PMC - PubMed
    1. Kinsey GR, McHowat J, Beckett CS, Schnellmann RG. Identification of calcium-independent phospholipase A2gamma in mitochondria and its role in mitochondrial oxidative stress. Am J Physiol Renal Physiol. 2007;292:F853–60. doi: 10.1152/ajprenal.00318.2006. - DOI - PubMed

Publication types

MeSH terms