. 2019 Nov;25(11):1715-1720.
doi: 10.1038/s41591-019-0639-4. Epub 2019 Nov 7.

Evolutionary divergence of HLA class I genotype impacts efficacy of cancer immunotherapy

Affiliations

Evolutionary divergence of HLA class I genotype impacts efficacy of cancer immunotherapy

Diego Chowell et al. Nat Med. 2019 Nov.

Abstract

Functional diversity of the highly polymorphic human leukocyte antigen class I (HLA-I) genes underlies successful immunologic control of both infectious disease and cancer. The divergent allele advantage hypothesis dictates that an HLA-I genotype with two alleles with sequences that are more divergent enables presentation of more diverse immunopeptidomes1-3. However, the effect of sequence divergence between HLA-I alleles-a quantifiable measure of HLA-I evolution-on the efficacy of immune checkpoint inhibitor (ICI) treatment for cancer remains unknown. In the present study the germline HLA-I evolutionary divergence (HED) of patients with cancer treated with ICIs was determined by quantifying the physiochemical sequence divergence between HLA-I alleles of each patient's genotype. HED was a strong determinant of survival after treatment with ICIs. Even among patients fully heterozygous at HLA-I, patients with an HED in the upper quartile respond better to ICIs than patients with a low HED. Furthermore, HED strongly impacts the diversity of tumor, viral and self-immunopeptidomes and intratumoral T cell receptor clonality. Similar to tumor mutation burden, HED is a fundamental metric of diversity at the major histocompatibility complex-peptide complex, which dictates ICI efficacy. The data link divergent HLA allele advantage to immunotherapy efficacy and unveil how ICI response relies on the evolved efficiency of HLA-mediated immunity.


Figures

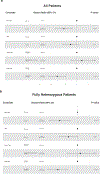
Extended Data Fig. 1 |
Extended Data Fig. 1 |. Hierarchical clustering of HLA-I evolutionary divergences at individual HLA class I loci.
a, Hierarchical clustering of HED at HLA-A using all HLA-A alleles from all patient cohorts. b, Hierarchical clustering of HED at HLA-B using all HLA-B alleles. c, Hierarchical clustering of HED at HLA-C using all HLA-C alleles. Heat maps shows z-score normalized HED across all alleles. Color gradient of blue to red indicates low HED between allele pairs to high HED between allele pairs, respectively.
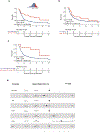
Extended Data Fig. 2 |
Extended Data Fig. 2 |. Mean HLA-I evolutionary divergence is associated with improved benefit from immune checkpoint inhibitors.
a, Association of high mean HED (red) with improved efficacy of anti-CTLA-4 treatment in a cohort of patients with metastatic melanoma; P = 0.0072; two-sided log-rank test. Density plots indicate the distribution of mean HED and cutoff used in the survival curves. T.Q.C. = top quartile cutoff, HR = hazard ratio, CI = confidence interval. b, Association of high (top quartile) tumor mutational burden (TMB) with overall survival after anti-CTLA-4 treatment; P = 0.20; two-sided log-rank test. c, Association of high mean HED and high TMB (red) with improved overall survival after anti-CTLA4 treatment; P = 0.024; two-sided log-rank test. d, Multivariable Cox proportional-hazards model including mean HED and other clinical variables. Data show independent effect of mean HED associated with improved survival after anti-CTLA-4. HED, TMB, and fraction of copy number alterations (FCNA) are dichotomized into high (1) and low (0) groups based on the top quartile for each variable. P values calculated using two-sided log-rank test. Horizontal lines represent the 95% confidence interval.
Extended Data Fig. 3 |
Extended Data Fig. 3 |. Effect of mean HLA-I evolutionary divergence on hazard ratio from survival across all possible cutpoints.
Cutpoint analysis showing the relationship between mean HED and hazard ratio. Data show a negative relationship between mean HED and hazard ratio across all possible cutpoints for mean HED, indicating improved overall survival as mean HED increases.
Extended Data Fig. 4 |
Extended Data Fig. 4 |. Neither HLA-I heterozygosity nor HLA-I evolutionary divergence is associated with prognosis in TCGA melanoma patients.
a, Full heterozygosity at HLA-I (red) is not associated with prognosis in TCGA melanoma patients; P = 0.14, two-sided log-rank test. b, High patient mean HED (red) is not associated with prognosis in TCGA melanoma patients; P = 0.80, two-sided log-rank test. c, High mean HED (red) is not associated with prognosis in TCGA melanoma patients fully heterozygous at HLA-I; P = 0.54; two-sided log-rank test.
Extended Data Fig. 5 |
Extended Data Fig. 5 |. Neither HLA-I heterozygosity nor HLA-I evolutionary divergence is associated with prognosis in TCGA lung cancer patients.
a, Full heterozygosity at HLA-I (red) is not associated with prognosis in TCGA lung cancer patients; P= 0.38, two-sided log-rank test. b, High mean HED is not associated with prognosis in patients from Extended Data Fig. 4a; P = 0.48, log-rank test. c, High mean HED (red) is not associated with prognosis in TCGA lung cancer patients fully heterozygous at HLA-I; P = 0.51, two-sided log-rank test
Extended Data Fig. 6 |
Extended Data Fig. 6 |. The effects of mean HLA-I evolutionary divergence and tumor mutational burden are independent of cancer type and drug class.
a, Multivariable Cox proportional-hazards model including mean HED and other clinical variables using all patients. Data show independent effect of mean HED in predicting response to ICI. Drug class P = 8.14e-06. P values calculated using two-sided log-rank test. Horizontal lines indicate 95% confidence interval. b, Multivariable Cox proportional-hazards model including mean HED and other clinical variables using patients fully heterozygous at HLA-I. Data show independent effect of mean HED associated with improved survival after ICI therapy. Mean HED P = 7.25e-04; Drug Class P = 9.32e-05. HED and TMB are dichotomized into high (1) and low (0) groups using the top quartile for each variable. P values calculated using two-sided log-rank test. Horizontal lines represent the 95% confidence interval.
Extended Data Fig. 7 |
Extended Data Fig. 7 |. Oncoprint showing mutations in genes in our patient cohorts.
Data show no difference in proportion of patients with mutations in the presented genes between patients with high mean HLA-I evolutionary divergence (HED) and low mean HED. LOH = loss of heterozygosity at HLA-I.
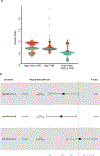
Extended Data Fig. 8 |
Extended Data Fig. 8 |. Combined effect of HED and TMB on survival after ICI administration and multivariable analysis of HED at individual loci.
a, Cutpoint analysis showing the association of both high mean HED and high TMB with improved survival after ICI (same distributions as Fig. 3g; n = 248). Data show a reduction in hazard ratio when combining HED and TMB compared to either variable alone. Green indicates two-sided log-rank p-value < 0.05; red indicates non-significant log-rank p-value. b, Multivariable cox regression analysis demonstrating the effect of HED at individual loci on overall survival after ICI administration. Data indicate that high HED at HLA-A and HLA-B are each associated with improved overall survival after ICI. P values calculated using two-sided log-rank test. Horizontal lines represent the 95% confidence interval.
Extended Data Fig. 9 |
Extended Data Fig. 9 |. Effect of mean HLA-I evolutionary divergence and tumor mutational burden on efficacy of immune checkpoint inhibitor treatment in an independent set of patients.
a, Association of high mean HED (red) with improved overall survival after ICI in an independent pan-cancer dataset of patients described in Chowell et al. These patients do not overlap with those presented in Figs. 2 & 3. Cutoff was determined using the median mean HED across the cohort. P = 0.02; two-sided log-rank test. HR = hazard ratio, CI = confidence interval. b, Association of high mean HED (red) with improved overall survival after ICI in an independent, pan-cancer dataset of patients described in Chowell et al. These patients do not overlap with those presented in Figs. 2 & 3. Patients in the red curve have mean HED greater than or equal to the top quartile; patients in the blue curve have mean HED less than or equal to the first quartile. P = 0.04; two-sided log-rank test c, Association of high mean HED (red) with improved overall survival after ICI in all patients described in Chowell et al. Cutoff was determined using the median mean HED across the cohort. P = 0.0012; two-sided log-rank test. d, Association of high mean HED (red) with improved overall survival after ICI in all patients described in Chowell et al. Patients in the red curve have mean HED greater than or equal to the top quartile; patients in the blue curve have mean HED less than or equal to the first quartile. P = 0.0037; two-sided log-rank test. e, Multivariable Cox proportional-hazards model including mean HED and other variables. Data show independent effect of mean HED on improved survival after ICI administration when adjusting for TMB and cancer type. Mean HED is dichotomized into high (1) and low (0) groups using the median; TMB is treated as a continuous variable. TMB P = 0.0008. P values calculated using two-sided log-rank test. Horizontal lines represent the 95% confidence interval.
Extended Data Fig. 10 |
Extended Data Fig. 10 |. Association of HLA-I evolutionary divergence at each class I locus with diversity of tumor and human immunopeptidomes.
a, Correlation of HED at HLA-A with number of unique neopeptides bound to HLA-A alleles of each patient genotype using all patients heterozygous at HLA-A from Fig. 2 (n = 118) for whom neopeptide data were available; P = 0.15; one-sided Kendall’s rank correlation. b, Correlation of HED at HLA-B with number of unique neopeptides bound to HLA-B alleles of each patient genotype using patients heterozygous at HLA-B (n = 129); P = 0.001; one-sided Kendall’s rank correlation c, Correlation of HED at HLA-C with number of unique neopeptides bound to HLA-C alleles of each patient genotype using patients heterozygous at HLA-C (n = 118); P = 0.03; one-sided Kendall’s rank correlation. d, Correlation of HED at HLA-A with number of unique viral peptides bound to HLA-A alleles of each patient genotype using patients heterozygous at HLA-A (n = 118); P = 0.01; one-sided Kendall’s rank correlation. d, Correlation of HED at HLA-B with number of unique viral peptides bound to HLA-B alleles of each patient genotype using patients heterozygous at HLA-B (n = 129); P < 0.0001; one-sided Kendall’s rank correlation. f, Correlation of HED at HLA-C with number of unique viral peptides bound to HLA-C alleles of each patient genotype using patients heterozygous at HLA-C; P < 0.0001. g, Correlation of HED at HLA-A with number of unique self peptides bound to HLA-A alleles of each patient genotype using patients heterozygous at HLA-A (n = 118); P = 0.79; two-sided Kendall’s rank correlation. h, Correlation of HED at HLA-B with number of unique self peptides bound to HLA-B alleles of each patient genotype using patients heterozygous at HLA-B (n = 129); P < 0.0001; two-sided Kendall’s rank correlation. i, Correlation of HED at HLA-C with number of unique self peptides bound to HLA-C alleles of each patient genotype using patients heterozygous at HLA-C (n = 118); P < 0.0001; two-sided Kendall’s rank correlation. Red line indicates line of best linear fit.
Fig. 1 |
Fig. 1 |. Landscape of HEDs at HLA-A, -B and -C.
a, Schematic of experimental design. HEDs are calculated between peptide-binding domains using the Grantham distance and then used to stratify patients treated with ICI s. Predicted neopeptides are called using whole-exome sequencing from the patient’s tumor, counted and correlated with HED. Predicted viral and self peptides were also correlated with HED. b, Hierarchical clustering of HED at HLA-A, HLA-B and HLA-C (HLA-I). The heatmap shows z score-normalized HED across all alleles in all patient cohorts. The color gradient of blue to red indicates low HED between allele pairs to high HED between allele pairs, respectively. c, Distributions of HED for each HLA-A, HLA-B and HLA-C heterozygous genotype. HLA-A (n = 279 patients; minimum= 1.08, median = 7.62, maximum = 13.20) versus HLA-B (n = 300 patients; minimum = 0.53, median = 8.10, maximum = 14.33) (P = 0.001); HLA-A versus HLA-C (n = 281 patients; minimum = 0.56, median = 5.60, maximum = 7.58; P < 0.0001); HLA-B versus HLA-C (P < 0.0001; two-sided Mann-Whitney test). d, Distribution of patient mean HED across all melanoma cohorts treated with ICIs (ICI melanoma) and TCGA (TCGA melanoma). e, Distribution of patient mean HED across all lung cancer cohorts treated with ICIs (ICI lung) and TCGA (TCGA lung).
Fig. 2 |
Fig. 2 |. High mean HED is associated with improved response and survival to ICIs.
a, Association of high mean HED (red) with improved survival after anti-CTLA-4 treatment in a cohort of metastatic melanoma patients fully heterozygous at HLA-I (P = 0.0094; two-sided log-rank test). Density plots indicate the distribution and cutoff for mean HED used in the survival curves. TQC, top quartile cutoff. b, Association of high mean HED (red) with improved survival after anti-PD-1 treatment in an independent cohort of patients with NSCLC fully heterozygous at HLA-I (P = 0.049; two-sided log-rank test). c, Association of high mean HED (red) with improved overall survival in an independent cohort of patients with melanoma fully heterozygous at HLA-I treated with anti-PDI (P = 0.025; two-sided log-rank test). d, Association of high patient mean HED with clinical response (red) to ICIs, including all patients (both homozygous and heterozygous at HLA-I) for whom clinical response data were available from a-c (P = 0.003; OR = 0.35; two-sided Fisher’s exact test). Numbers on pie charts indicate number of patients deriving clinical or no clinical benefit. e, Association of high mean HED with clinical response (red) to ICIs, including only patients fully heterozygous at HLA-I for whom clinical response data were available from a-c (P = 0.03, OR = 0.44; two-sided Fisher’s exact test). Numbers on pie charts indicate number of patients deriving clinical or no clinical benefit.
Fig. 3 |
Fig. 3 |. Effect of high mean HED and high TMB on efficacy of ICI treatment.
a, Association of high mean HED (red) with improved overall survival after ICIs in all patients (HLA-I homozygous or heterozygous) from Fig. 2 for whom the TMB was available (P = 0.0034; two-sided log-rank test). Density plot indicates the distribution and cutoff for mean HED used in the survival curves. b, Association of high TMB (red) with improved overall survival after ICIs among all patients P = 0.03; two-sided log-rank test). The density plot indicates the distribution and cutoff for TMB used in the survival curves. c, Survival of patients with both high mean HED and high TMB (red) after ICI treatment among all patients (P = 0.01; two-sided log-rank test). d, Association of high mean HED (red) with improved overall survival after ICIs in patients fully heterozygous at HLA-I from Fig. 2 for whom TMB was available (P = 0.001; two-sided log-rank test). e, Association of high TMB with improved overall survival after ICIs among fully heterozygous patients (P = 0.02; two-sided log-rank test). f, Survival of patients with both high mean HED and high TMB after ICI treatment among fully heterozygous patients (P = 0.007; log-rank test). g, Cut-point analysis showing the association of both high mean HED and high TMB with improved survival after ICIs (n = 248; high mean HED: minimum = 0.27; median = 0.67; maximum= 1.01; high TMB: minimum = 0.42; median = 0.64; maximum = 2.38; high mean HED and TMB: minimum = 0.11; median = 0.47; maximum = 1.02). Data show a reduction in HR when combining HED and TMB compared with either variable alone. h, Univariable Cox regression analysis showing the association of high HED (top quartile) at individual HLA-I loci with improved survival after ICIs (‘all’, HLA-I homozygous or heterozygous; ‘fully het.’, fully heterozygous at HLA-I; n = number of patients). P values were calculated using a two-sided log-rank test. Horizontal lines represent 95% Cl.
Fig. 4 |
Fig. 4 |. Mean HED is positively correlated with diversity of the tumor, viral and human immunopeptidomes.
a, Correlation of mean HED with number of unique neopeptides bound to alleles of each patient genotype using all patients fully heterozygous at HLA-I from Fig. 2 for whom neopeptide data were available (n = 103; P = 0.04; one-sided Kendall’s rank correlation). Each point represents a patient HLA-I genotype (HLA-A, -B and -C); the y axis depicts the mean number of neopeptides bound across HLA-A, -B and -C (see Methods). b, Correlation of mean HED with TMB (n = 103; P = 0.46; two-sided Kendall’s rank correlation). c, Correlation of mean HED with number of unique viral peptides bound to alleles of each HLA-I genotype (n = 103; P = 2.41 × 10⁻⁹; one-sided Kendall’s rank correlation). d, Correlation of mean HED with number of unique self-peptides from the human proteome bound to alleles of each HLA-I genotype (n = 103; P = 6.46 × 10⁻⁶; two-sided Kendall’s rank correlation). The y axis depicts the mean number of self-peptides bound across HLA-A, -B and -C. e, Association of mean HED with intratumoral TCR CDR3β clonality (n = 19; P = 0.02; two-sided Pearson’s correlation). The red line indicates the line of best linear fit. f, Schematic depicting the effects of HED and TMB on imunopeptidome diversity and response to ICIs. One representative HLA-I locus with high HED between the alleles is depicted.

References

    1. Parham P & Ohta T Population biology of antigen presentation by MHC class I molecules. Science 272, 67–74 (1996). - PubMed
    1. Wakeland EK et al. Ancestral polymorphisms of MHC class II genes: divergent allele advantage. Immunol Res. 9, 115–122 (1990). - PubMed
    1. Pierini F & Lenz TL Divergent allele advantage at human MHC genes: signatures of past and ongoing selection. Mol. Biol. Evol 35, 2145–2158 (2018). - PMC - PubMed
    1. McGranahan N et al. Clonal neoantigens elicit T cell immunoreactivity and sensitivity to immune checkpoint blockade. Science 351, 1463–1469 (2016). - PMC - PubMed
    1. Samstein RM et al. Tumor mutational load predicts survival after immunotherapy across multiple cancer types. Nat. Genet 51, 202–206 (2019). - PMC - PubMed

Publication types

MeSH terms