. 2019 Nov;25(11):1761-1771.
doi: 10.1038/s41591-019-0633-x. Epub 2019 Nov 7.

Exercise reduces inflammatory cell production and cardiovascular inflammation via instruction of hematopoietic progenitor cells

Affiliations

Exercise reduces inflammatory cell production and cardiovascular inflammation via instruction of hematopoietic progenitor cells

Vanessa Frodermann et al. Nat Med. 2019 Nov.

Abstract

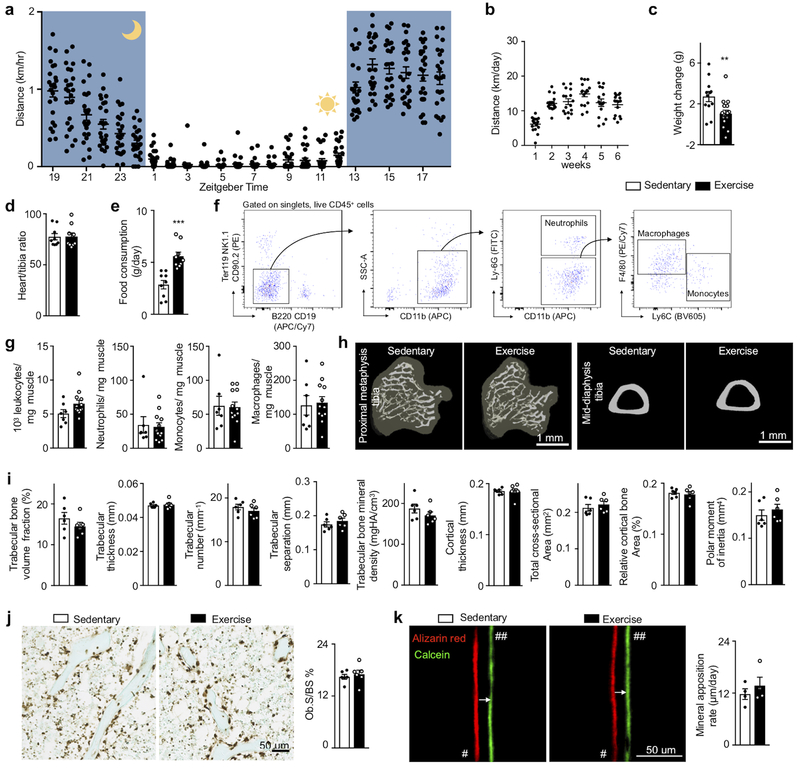
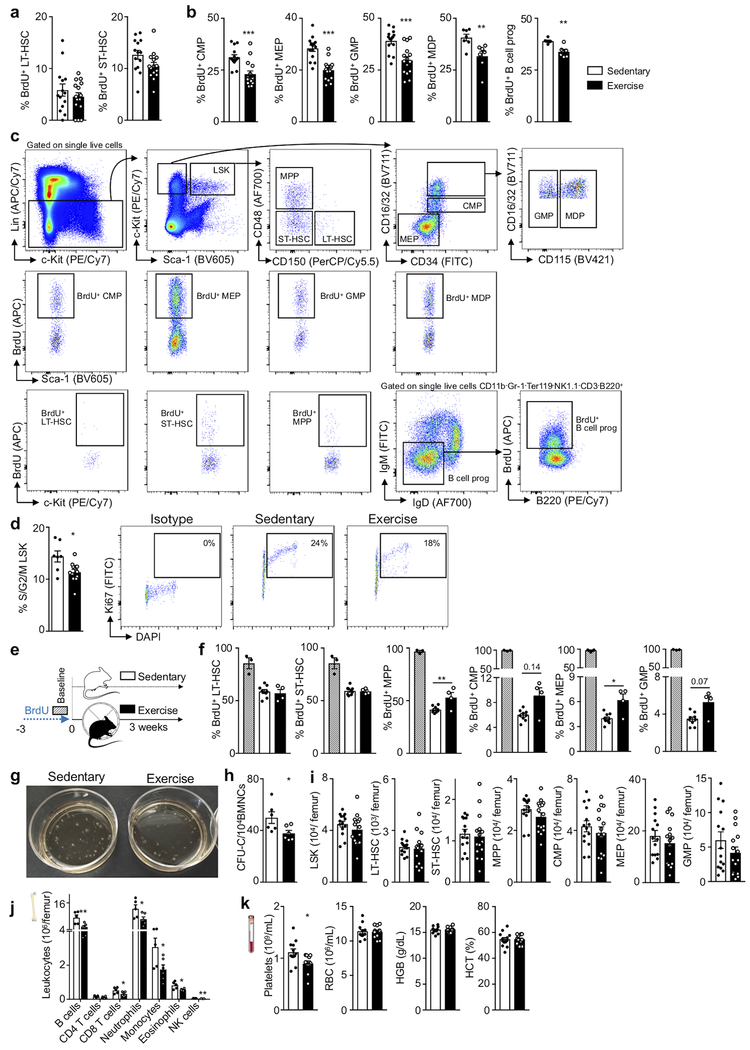
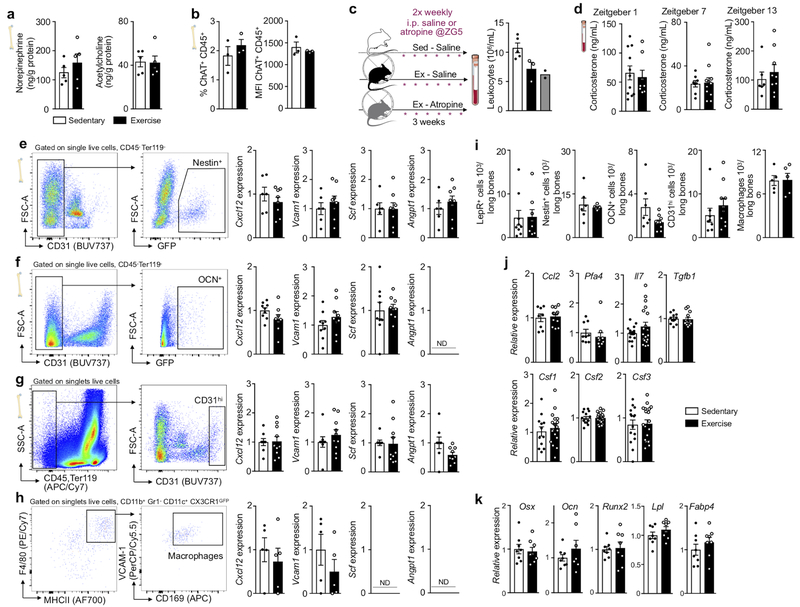
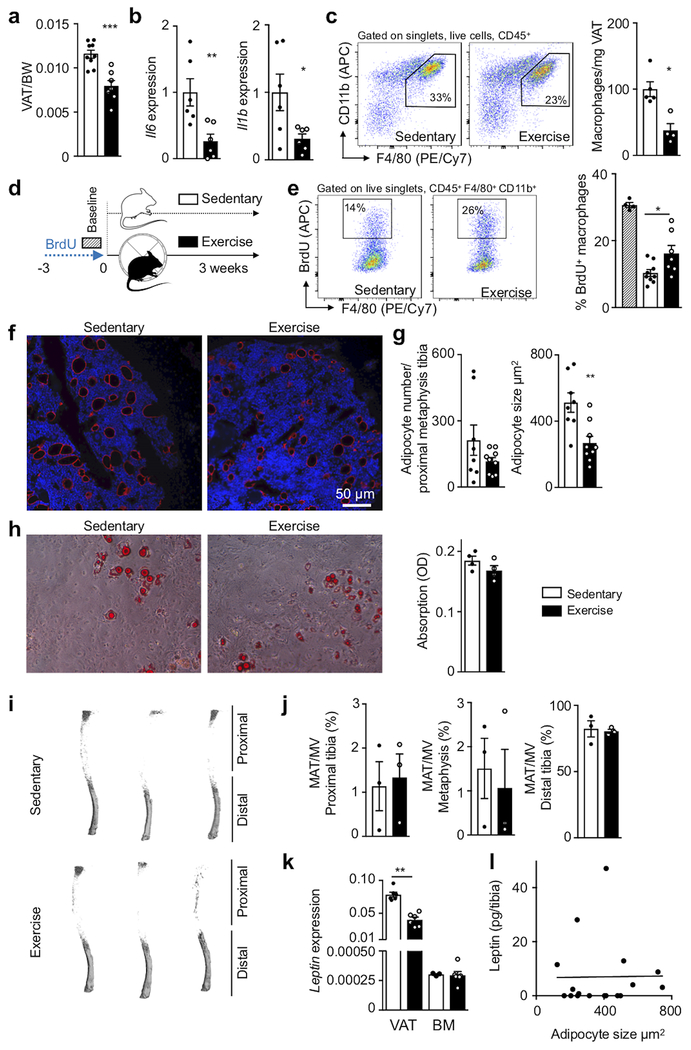
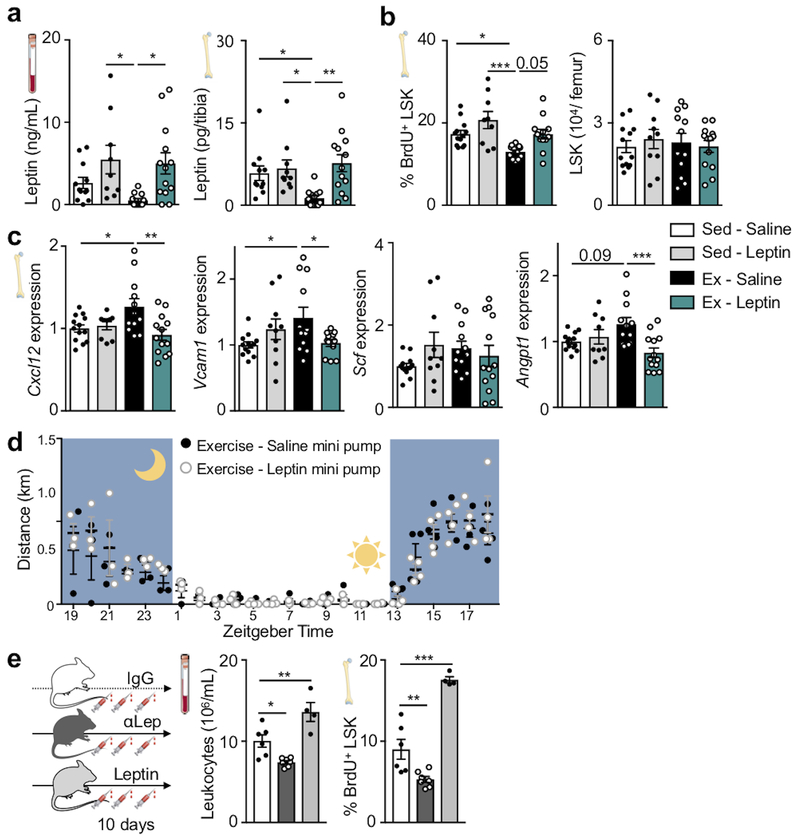
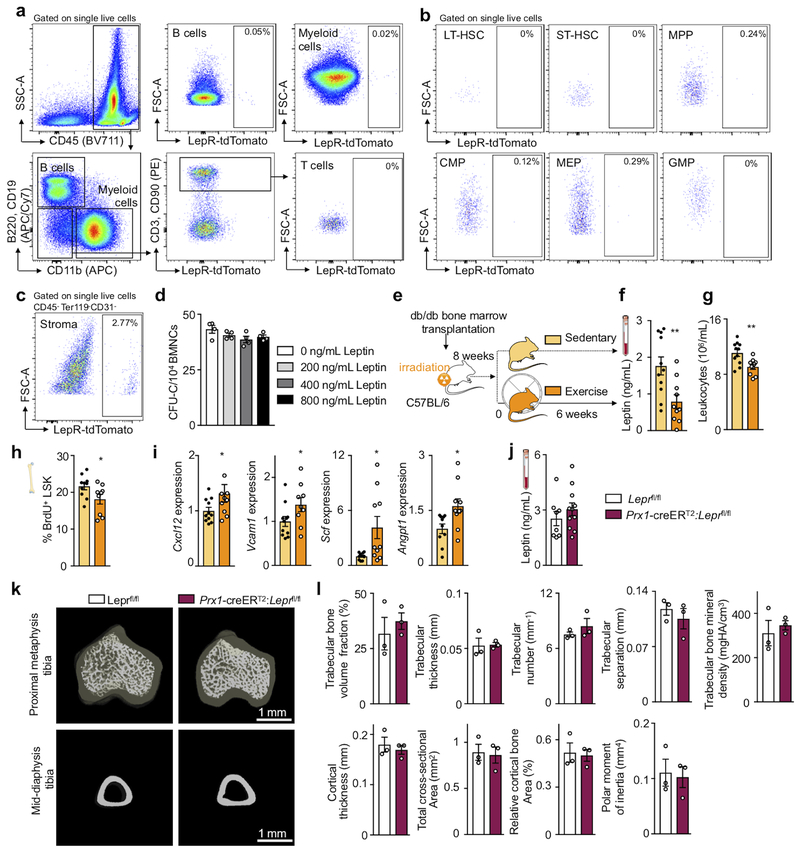
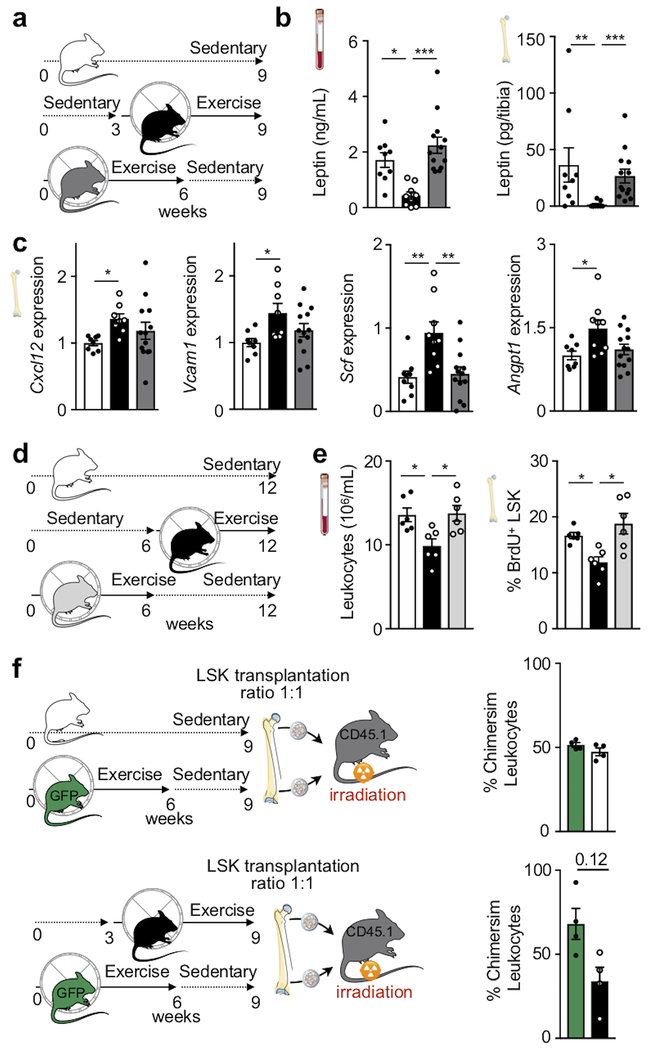
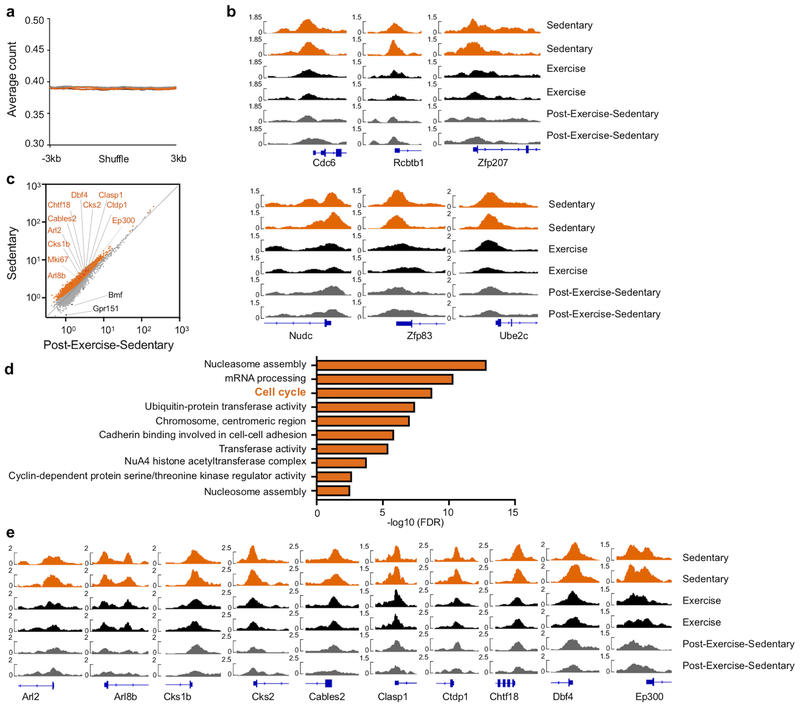
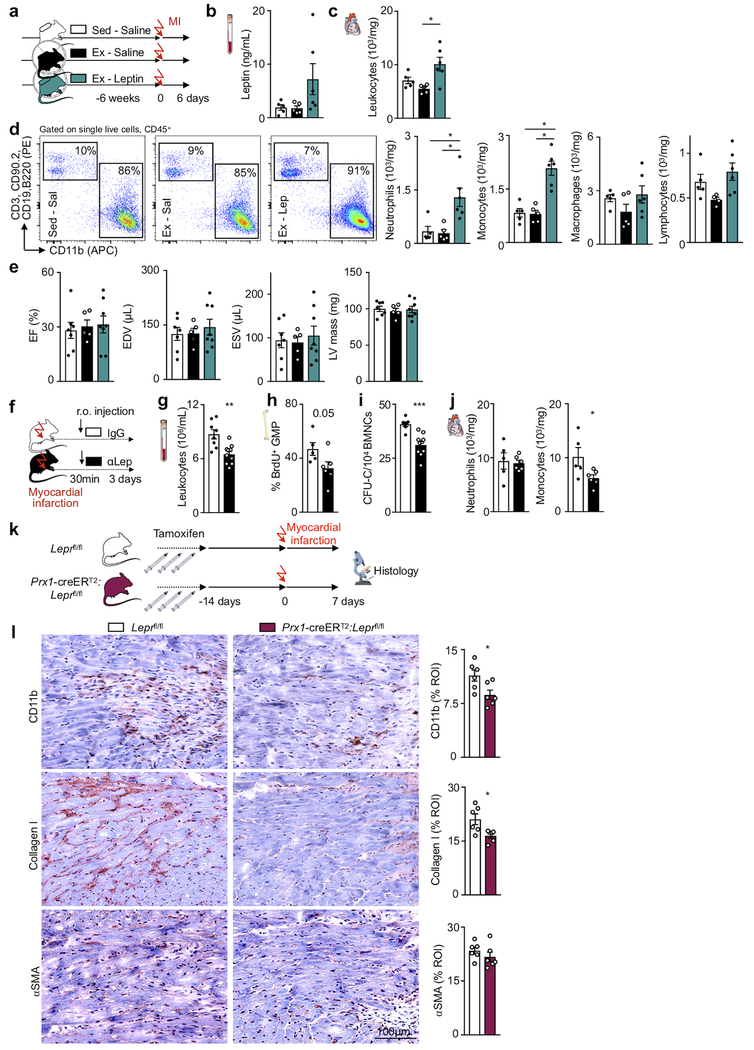
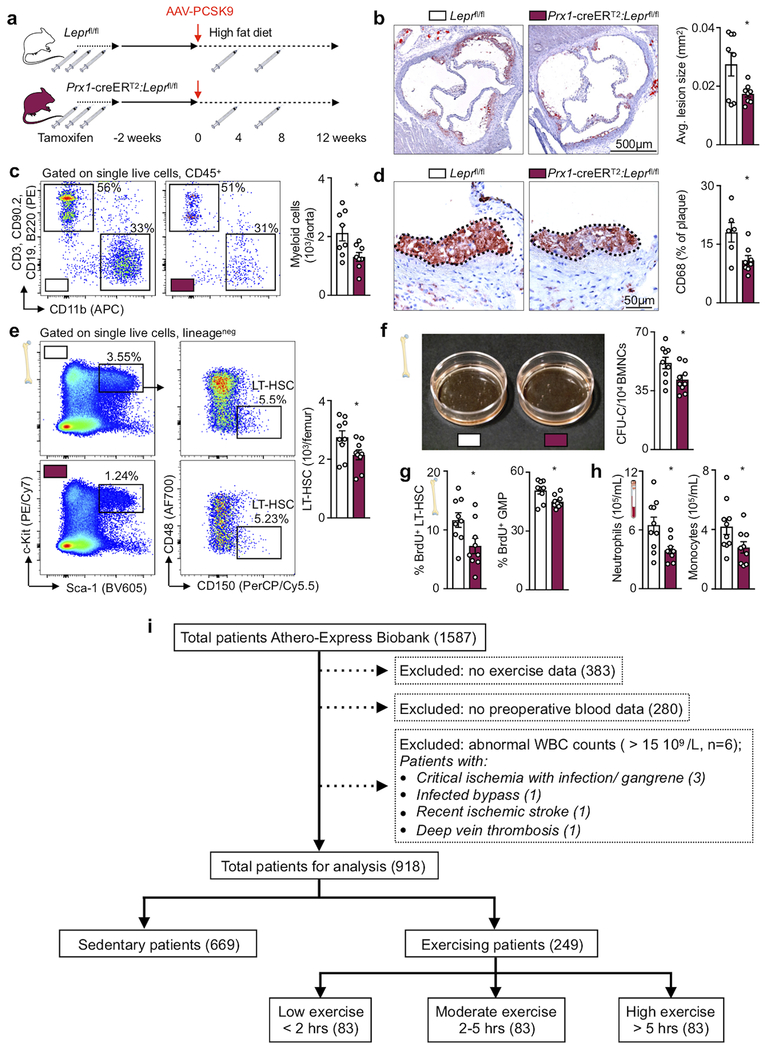
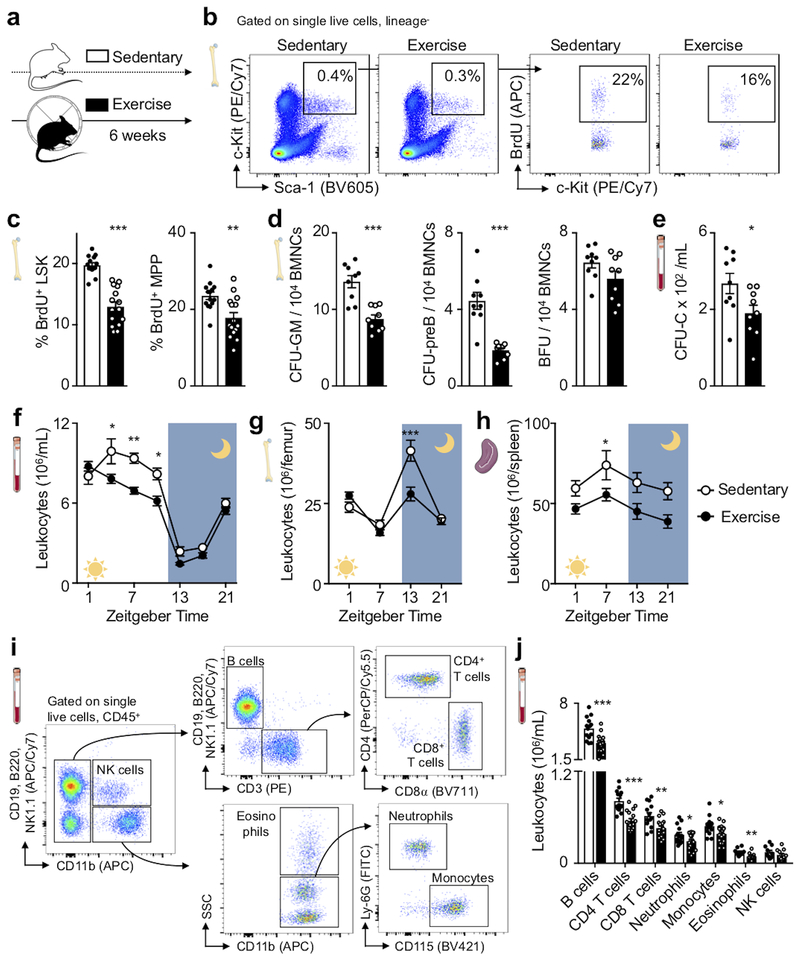
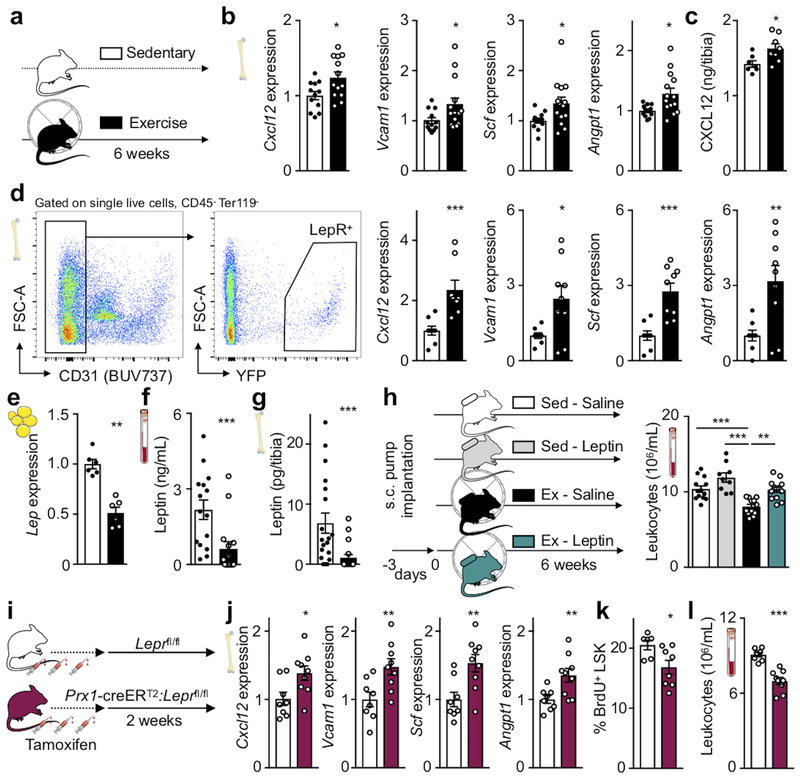
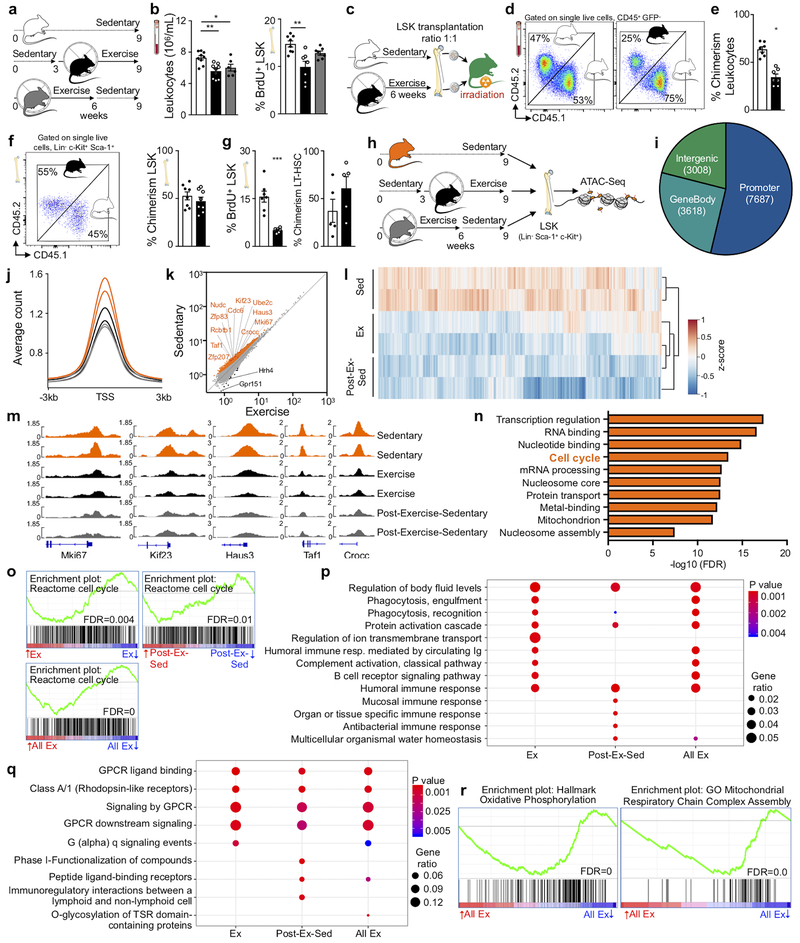
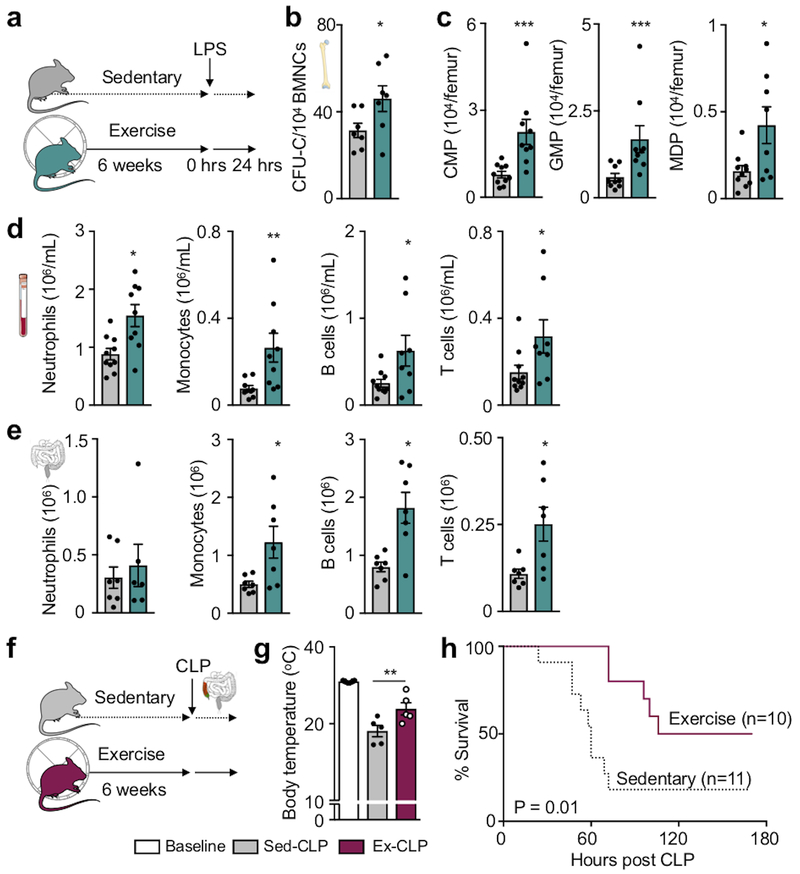
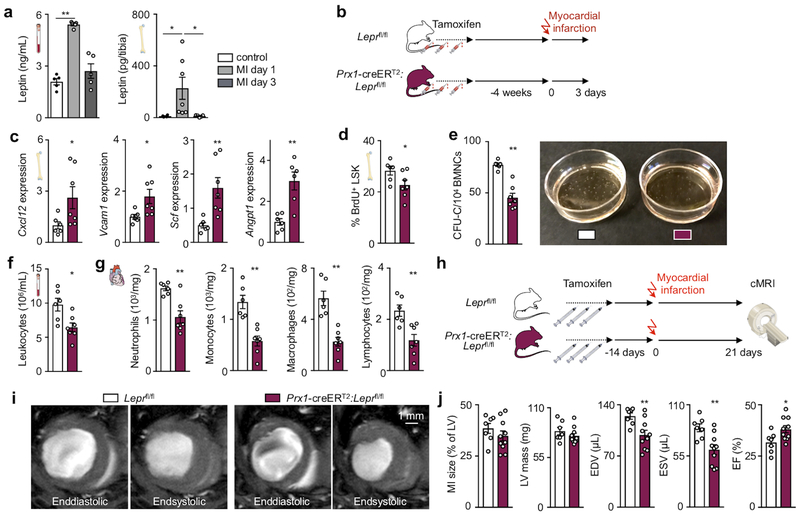
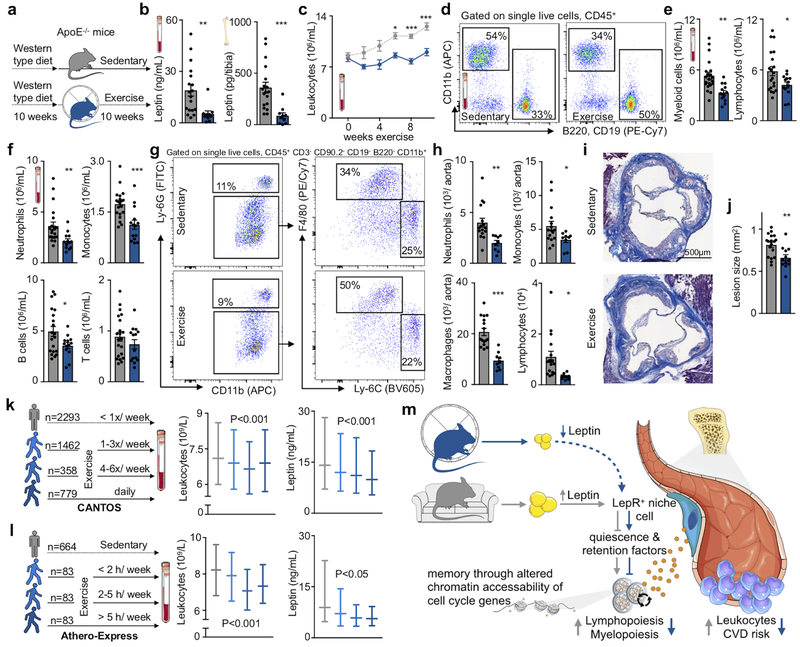
A sedentary lifestyle, chronic inflammation and leukocytosis increase atherosclerosis; however, it remains unclear whether regular physical activity influences leukocyte production. Here we show that voluntary running decreases hematopoietic activity in mice. Exercise protects mice and humans with atherosclerosis from chronic leukocytosis but does not compromise emergency hematopoiesis in mice. Mechanistically, exercise diminishes leptin production in adipose tissue, augmenting quiescence-promoting hematopoietic niche factors in leptin-receptor-positive stromal bone marrow cells. Induced deletion of the leptin receptor in Prrx1-creERT2; Leprfl/fl mice reveals that leptin's effect on bone marrow niche cells regulates hematopoietic stem and progenitor cell (HSPC) proliferation and leukocyte production, as well as cardiovascular inflammation and outcomes. Whereas running wheel withdrawal quickly reverses leptin levels, the impact of exercise on leukocyte production and on the HSPC epigenome and transcriptome persists for several weeks. Together, these data show that physical activity alters HSPCs via modulation of their niche, reducing hematopoietic output of inflammatory leukocytes.


Conflict of interest statement

Competing interests

Authors declare no competing interests.

Figures

Extended Data Figure 1.
Extended Data Figure 1.. Effects of 6 weeks of running.
(a) Mean distance run per hour (n=24 animals). (b) Mean daily distance over the course of 6 weeks (n=16 animals). (c) Bodyweight changes in sedentary (n=12) and exercising mice (n=17, **p=0.0076, two-tailed Mann-Whitney U test) compared to initial bodyweight six weeks prior. (d) Heart weight adjusted for tibia length (n=9 animals per group). (e) Food consumption during the last week of exercise (***p=0.0002, n=9 animals per group, two-tailed Student’s t-test). (f) Flow cytometry gating strategy for leukocytes in skeletal muscle. (g) Total leukocytes, neutrophils, monocytes and macrophages per mg muscle tissue by flow cytometry (n=7 animals for sedentary, n=12 for exercise). (h) Representative microCT images of the proximal metaphysis and mid-diaphysis tibia of exercising and sedentary mice. (i) Parameters of bone microstructure, including trabecular and cortical thickness, bone mineral density and polar moment of inertia by μCT (n=6 animals per group). (j) Representative Runx2 staining of tibial proximal metaphysis. Osteoblast surface per bone surface (Ob.S/BS, n=6 animals per group). (k) Bone formation rate as observed by incorporation of calcein (20 mg/kg, 7 days prior) and alizarin red (30 mg/kg, 2 days prior to sacrifice) during bone mineralization at the diaphysis of femurs. Distance of fluorescent label indicated by the arrow demarcates the mineralization front at different times of administration. ‘#’ denotes medullary cavity and ‘##’ trabecular bone (n=4 animals). Data are mean ± s.e.m.
Extended Data Figure 2.
Extended Data Figure 2.. Increased stem and progenitor cell quiescence after 6 weeks of exercise.
Mice were given 5-bromo-2-deoxyuridine (BrdU) intraperitoneally (1 mg). BrdU incorporation in (a) long-term hematopoietic stem cells (LT-HSC), short-term HSC (ST-HSC), (b) common myeloid progenitors (CMP, ***p=0.00026), megakaryocyte erythroid progenitors (MEP, ***p=1.028×10⁻⁵), granulocyte macrophage progenitors (GMP, ***p=4.17×10⁻⁴, all n=14 animals for sedentary, n=15 for exercise), macrophage and dendritic cell progenitors (MDP, **p=0.0070, n=7 animals per group) and B cell progenitors (B cell prog, **p=0.0065, n=6 animals per group) were analyzed 22 hours later (two-tailed Mann-Whitney U test for CMP, MDP and B cell prog; two-tailed Student’s t test for MEP and GMP). (c) Flow cytometry gating for hematopoietic progenitors and representative flow cytometry plots of BrdU gating. (d) Cell cycle analysis in LSK assessed by Ki-67/ DAPI staining. Representative flow cytometry dot plots of Ki67+ LSK (*p=0.038, n=7 animals for sedentary, n=12 for exercise, 2 independent experiments, two-tailed Mann-Whitney U test). (e) Experimental outline for BrdU pulse-chase experiment. Mice received BrdU in drinking water for 3 weeks (baseline, n=3 animals) prior to 3 weeks of exercise. (f) BrdU incorporation into LT-HSC, ST-HSC, multipotent progenitors (MPP, **p=0.0074), CMP (p=0.14), MEP (*p=0.034) and GMP (p=0.07, n=9 animals for sedentary, n=4 for exercise, two-tailed Mann-Whitney U test comparing sedentary and exercise). (g) Representative images of granulocyte macrophage colonies from sedentary and running mice. (h) Bone marrow colony forming unit assay (CFU) of bone marrow mononuclear cells (BMNCs) for complete colonies (*p=0.036, n=6 animals per group, 2 independent experiments, two-tailed Mann-Whitney U test). (i) Number of HSPC per femur in sedentary and exercising mice (n=15 animals per group). (j) Number of marrow leukocytes at Zeitgeber 13: B cells (**p=0.0089), CD4 T cells, CD8 T cells (*p=0.048), neutrophils (*p=0.044), monocytes (*p=0.041), eosinophils (*p=0.019, n=5 animals for sedentary, n=6 for exercise) and NK cells (**p=0.00099, n=3 per group, two-tailed Mann-Whitney U test). (k) Numbers of platelets (*p=0.016, two-tailed Student’s t test), red blood cells (RBC), hemoglobin (HGB) and hematocrit (HCT, n=12 animals for sedentary and n=11 for exercise, 4 independent experiments). Data are mean ± s.e.m.
Extended Data Figure 3.
Extended Data Figure 3.. Neutral running effects on bone marrow neurotransmitters, corticosterone and selected hematopoietic niche cells.
(a) Mass spectrometry of norepinephrine and acetylcholine in the bone marrow after 6 weeks of exercise (n=5 animals per group). (b) Choline acetyltransferase (ChAT) expression by bone marrow CD45+ leukocytes (n=3 animals per group). (c) Experimental outline, administration of a competitive antagonist of the muscarinic acetylcholine receptors (atropine) during 3 weeks exercise. Leukocytes in circulation (n=5 animals for Sed-Saline, n=3 for Ex-Saline, n=2 for Ex-Atropine). (d) Plasma corticosterone at Zeitgeber time (ZG) 1 (n=11 animals for sedentary, n=8 for exercise), ZG 7 (n=8 sedentary, n=11 exercise), ZG 13 (n=6 sedentary, n=9 exercise) after exercise for 6 weeks. (e) Nestin+ stromal cells (n=6 animals for sedentary, n=8 for exercise, 3 independent experiments), (f) OCN+ osteoblasts, (n=9 animals per group, 4 independent experiments) (g) endothelial cells (n=8 animals for sedentary, n=10 for exercise, 6 independent experiments) and (h) bone marrow macrophages (n=5 animals per group, 2 independent experiments) were isolated by fluorescence-activated cell sorting. GFP stromal reporter mice either had access to exercise wheels for 6 weeks or remained sedentary. Representative dot plots are shown. Expression of Cxcl12, Vcam1, Scf and Angpt1 was assessed by qPCR, ND: not detectable. (i) Numbers of stromal niche cells in sedentary and exercising mice (n=9 and n=8 for LepR+, n=6 and n=8 for Nestin+, n=9 and n=9 for OCN+, n=8 and n=10 for CD31high, n=5 and n=5 animals for sedentary and exercise, respectively). (j) Gene expression of several niche factors in total bone marrow by qPCR (n=8 animals for sedentary for Ccl2 and Pfa4, n=12 for sedentary for Tgfb, Csf1, n=16 for sedentary for Il7, Csf2, Csf3, n=13 for exercise for Ccl2, Tgfb, n=19 for exercise for Il7, Csf1, Csf2, Csf3, 4 independent experiments). (k) Markers for osteolineage cells (Osx, Ocn, Runx2) and adipocytes (Lpl, Fabp4) by qPCR in total bone marrow (n=8 animals per group, 2 independent experiments). All mRNA levels were normalized to Actb Ct values. Data are mean ± s.e.m., where appropriate.
Extended Data Figure 4.
Extended Data Figure 4.. Exercise reduces visceral adipose tissue macrophages.
(a) Visceral adipose tissue (VAT) per mouse adjusted for bodyweight (BW; ***p=0.00069, n=9 animals for sedentary, n=7 for exercise, 2 independent experiments, two-tailed Mann-Whitney U test). (b) Cytokine production by visceral adipose tissue by qPCR (*p=0.034, **p=0.0087, n=6 animals per group, 2 independent experiments, two-tailed Mann-Whitney U test). (c) Macrophages per mg VAT. Representative dot plots are shown (*p=0.016, n=5 animals for sedentary, n=4 for exercise, two-tailed Mann-Whitney U test). (d) Experimental outline for e. Mice received BrdU in drinking water for 3 weeks (baseline, n=4 animals) prior to 3 weeks of exercise. (e) BrdU incorporation into VAT macrophages (*p=0.045, n=9 animals for sedentary, n=7 for exercise, 2 independent experiments, two-tailed Mann-Whitney U test comparing sedentary and exercise). Representative dot plots are shown. (f) Longitudinal sections of tibias were stained by perilipin (red) and counterstained by DAPI (blue). (g) Quantification of adipocyte numbers and size in the proximal metaphysis of tibias (**p=0.0055, n=8 animals for sedentary, n=9 for exercise, 3 independent experiments, two-tailed Mann-Whitney U test). (h) In vitro adipocyte differentiation assay of bone marrow stromal cells from all long bones and pelvic bones. Representative images with 100x magnification are shown (n=4 animals per group). (i,j) Visualization of marrow adipose tissue in tibias by osmium stain by μCT and marrow adipose tissue (MAT) per marrow volume (MV) (n=3 animals per group). (k) Leptin expression by qPCR in visceral adipose tissue (VAT; **p=0.0022, n=6 animals per group, two-tailed Mann-Whitney U test) and bone marrow (BM; n=3 animals for sedentary, n=6 for exercise). mRNA levels were normalized to Actb Ct values. Data are mean ± s.e.m. (l) Lack of correlation between tibial adipocyte size and leptin concentration (R2=0.0002, P=0.96, n=17 animals, linear regression analysis).
Extended Data Figure 5.
Extended Data Figure 5.. Leptin supplementation and antibody neutralization.
(a) Leptin levels in blood (*p=0.19 for both Sed-Leptin vs Ex-Saline and Ex-Saline vs Ex-Leptin, one-way analysis of variance with Sidak’s post hoc test) and bone marrow (*p=0.013 Sed-Leptin vs Ex-Saline, *p=0.042 Sed-Saline vs Ex-Saline, **p=0.0038 Ex-Saline vs Ex-Leptin, n=12 animals for Sed-Saline and Ex-Saline, n=10 for Sed-Leptin, n=13 for Ex-Leptin, 5 independent experiments, Kruskal-Wallis with Dunn's post hoc test) as measured by ELISA. (b) LSK proliferation 22 hrs after intraperitoneal injection of BrdU (*p=0.047 Sed-Saline vs Ex-Sal, p=0.05 Ex-Saline vs Ex-Leptin, ***p=0.00031 Sed-Leptin vs Ex-Sal, n=12 animals for Sed-Saline and Ex-Saline, n=10 for Sed-Leptin, n=13 for Ex-Leptin, 5 independent experiments, one-way analysis of variance with Sidak’s post hoc test), LSK numbers and (c) expression of hematopoietic factors in bone marrow of exercising and sedentary mice implanted with osmotic minipumps as described in Fig. 2h (*p=0.016 and **p=0.0026 for Cxcl12, *p=0.025 Sed-Saline vs Ex-Saline and *p=0.046 Ex-Saline vs Ex-Leptin for Vcam1, ***p=0.00074 Ex-Saline vs Ex-Leptin and p=0.09 Sed-Saline vs Ex-Saline for Angpt1, n=12 animals for Sed-Saline and Ex-Saline, n=10 for Sed-Leptin, n=13 for Ex-Leptin). (d) Running distance with either saline or leptin mini pumps and access to exercise wheels for 6 weeks. Mean distance run per hour (n=4 animals per group). (e) Injection of leptin neutralizing antibody or leptin into sedentary mice. Circulating leukocytes levels at Zeitgeber time 7 (*p=0.010 IgG vs ⍺Lep, **p=0.0072 ⍺Lep vs Leptin) and LSK proliferation 22 hrs after intraperitoneal injection (**p=0.0038 IgG vs ⍺Lep, ***p=1.52×10⁻⁵, n=6 animals for IgG, n=7 for ⍺Lep, n=4 for Leptin, 2 independent experiments, one-way analysis of variance with Sidak's post hoc test). Data are mean ± s.e.m.
Extended Data Figure 6.
Extended Data Figure 6.. Leptin receptor expression in the bone marrow.
(a) Representative flow cytometry dot plots of leptin receptor (LepR) expression in B cells, myeloid cells, T cells, (b) bone marrow long-term hematopoietic stem cells (LT-HSC), short-term HSC (ST-HSC), multipotent progenitors (MPP), common myeloid progenitors (CMP), megakaryocyte erythroid progenitors (MEP), granulocyte macrophage progenitors (GMP) and (c) stromal bone marrow cells (n=3 independent experiments with similar results). (d) Bone marrow colony forming unit assay (CFU) for complete colonies (n=4 donor animals). Bone marrow mononuclear cells (BMNCs) were plated with increasing concentrations of leptin. (e) Experimental outline for bone marrow transplantation; data shown in panel f-i. Total bone marrow was isolated from db/db donor mice and transplanted into wild type recipients. After an 8-week recovery period, mice exercised for 6 weeks or remained sedentary. (f) Leptin levels in serum by ELISA (**p=0.0059, n=11 animals for sedentary, n=10 for exercise, 2 independent experiments, two-tailed Student’s t-test). (g) Circulating leukocyte levels at Zeitgeber time 7 (**p=0.0042, n=11 for animals sedentary, n=10 for exercise, 2 independent experiments, two-tailed Student’s t-test). (h) BrdU incorporation into LSK 22 hrs after intraperitoneal injection (*p=0.045, n=10 animals sedentary, n=9 for exercise, 2 independent experiments, two-tailed Student’s t-test). (i) Gene expression by qPCR in total bone marrow of Cxcl12 (*p=0.042), Vcam1 (*p=0.03), Scf (*p=0.014) and Angpt1 (* p=0.0168, n=11 animals for sedentary, n=10 for exercise, 2 independent experiments, two-tailed Mann-Whitney U test for Cxcl12 and two-tailed Student’s t-test for Vcam1, Scf, Angpt1). mRNA levels were normalized to Actb Ct values. (j) Leptin levels in blood of Leprfl/f and Prx1-creERT2:Leprfl/fl mice measured by ELISA (n=8 animals for Leprfl/fl and n=11 for Prx1-creERT2:Leprfl/fl). (k) Representative microCT images of the proximal metaphysis and mid-diaphysis tibia of Prx1-creERT2:Leprfl/fl mice and their Leprfl/fl littermates. (b) Parameters of bone microstructure, including trabecular and cortical thickness, bone mineral density and polar moment of inertia by μCT (n=3 animals per group). Data are mean ± s.e.m.
Extended Data Figure 7.
Extended Data Figure 7.. Exercise effects wane after 6 sedentary weeks.
(a) Experimental outline for b-c. (b) Blood (*p=0.012, ***p=8.89×10⁻⁵) and tibial (**p=0.0053, ***p=0.00079) leptin concentrations measured by ELISA (n=9 animals for sedentary and exercise, n=13 animals for post-exercise-sedentary, 3 independent experiments, Kruskal-Wallis with Dunn’s post hoc test). (c) Gene expression of niche factors Cxcl12 (*p=0.015), Vcam1 (*p=0.038), Scf (**p=0.0037 sedentary vs exercise, **p=0.0035 exercise vs post-exercise-sedentary) and Angpt1 (*p=0.027) in whole bone marrow by qPCR (n=9 animals for sedentary and exercise, n=13 animals for post-exercise-sedentary, 3 independent experiments, one-way analysis of variance with Sidak’s post hoc test). mRNA levels were normalized to Actb Ct values. (d) Experimental outline for e. The post-exercise-sedentary group had access to exercise wheels for 6 weeks after which the wheels were removed for the following 6 weeks. Sedentary controls had no access, while the exercise group had access to wheels during the last 6 weeks before sacrifice. (e) Circulating leukocyte levels at Zeitgeber time 7 (*p=0.028 sedentary vs exercise, *p=0.045 exercise vs post-exercise sedentary) and BrdU incorporation into LSK 22 hrs after intraperitoneal injection (*p= 0.045 sedentary vs exercise, *p=0.014 exercise vs post-exercise-sedentary, n=6 animals per group, Kruskal-Wallis with Dunn's post hoc test). (f) Outline of the competitive bone marrow transplantation experiments. LSK were isolated from CD45.2 donors that either exercised for 6 weeks or were sedentary. These were transplanted in a 1:1 ratio into CD45.1 recipients together with LSK isolated from UBC-GFP mice that exercised for 6 weeks and had a 3-week post-exercise-sedentary period. Blood chimerism 8 weeks after transplantation (n=4 animals per group, p=0.12 for exercise vs post-exercise-sedentary donor chimerism, Wilcoxon matched-pairs signed rank test). Data are mean ± s.e.m.
Extended Data Figure 8.
Extended Data Figure 8.. Background ATAC-seq signals are similar, while peaks are higher in LSK of sedentary mice.
(a) Average profiles of ATAC-seq tag density among randomly shuffled regions of the same size as the actual ATAC-seq peaks. These profiles are similar among different conditions, suggesting the absence of background shift between ATAC-seq signals. (b) Tracks of normalized ATAC-seq tag density for the loci of additional genes in the top ten significant genes in the cell cycle category as determined by DAVID in Fig. 3n. (c) Scatter plot of normalized tag density at ATAC-seq peaks shows comparison between LSK from sedentary versus post-exercise-sedentary cohorts. Peaks with significantly lower and higher tag density in post-running mice are highlighted in orange and black, respectively (FDR<0.01). The top ten significant genes in the cell cycle pathway determined by DAVID (refer to d) and Mki67 are indicated; see Supplementary Table 1 for all genes. (d) Functional categories enriched among genes with differential chromatin accessibility in LSK from sedentary versus post-exercise-sedentary mice as determined by DAVID. (e) Tracks of normalized ATAC-seq tag density for the loci of the top ten significant genes in the cell cycle category as determined by DAVID in d.
Extended Data Figure 9.
Extended Data Figure 9.. Leptin in acute MI.
(a) Experimental outline for b-e. (b) Leptin blood levels on day 6 after MI (n=5 animals for Sed-Saline and Ex-Saline, n=6 for Ex-Leptin, 3 independent experiments). (c) Infarct CD45+ leukocyte levels on day 6 after MI (*p=0.025, n=5 animals for Sed-Saline and Ex-Saline, n=6 for Ex-Leptin, 3 independent experiments, Kruskal-Wallis with Dunn’s post hoc test). (d) Flow cytometry gating and quantification of neutrophils (*p=0.039 Sed-Saline vs Ex-Leptin, *p=0.021 Ex-Saline vs Ex-Leptin), monocytes (*p=0.018 Sed-Saline vs Ex-Leptin, *p=0.015 Ex-Saline vs Ex-Leptin), macrophages and lymphocytes in the infarct in respective cohorts (n=5 animals for Sed-Saline and Ex-Saline, n=6 for Ex-Leptin, 3 independent experiments, Kruskal-Wallis with Dunn’s post hoc test). (e) Cardiac magnetic resonance imaging on day 21 after MI. Ejection fraction (EF), enddiastolic volume (EDV), endsystolic volume (ESV) and left ventricular (LV) mass were determined (n=7 animals for Sed-Saline, n=5 for Ex-Saline, n=8 for Ex-Leptin, 3 independent experiments). (f) Experimental outline for panels g-j. (g) Circulating leukocytes at Zeitgeber 7 (**p=0.0017, n=8 animals for IgG and n=10 for ⍺Lep, 3 independent experiments, two-tailed Student’s t test). (h) BrdU incorporation into granulocyte macrophage progenitors (GMP) 3 days after MI (p=0.05, n=8 animals for IgG and n=10 for ⍺Lep, 3 independent experiments, two-tailed Student’s t-test). (i) Bone marrow colony forming unit assay (CFU) of bone marrow mononuclear cells (BMNCs) for complete colonies (***p=0.00041, n=7 animals for IgG and n=10 for ⍺Lep, 3 independent experiments, two-tailed Mann-Whitney U test). (j) Neutrophils and monocytes per mg infarct tissue (*p=0.03, n=5 animals for IgG, n=6 for ⍺Lep, two-tailed Mann-Whitney U test). (k) Experimental outline for l. (l) Representative immunohistochemical stainings and quantification of myeloid cells (CD11b), collagen deposition (Collagen I), and myofibroblasts (alpha smooth muscle actin) in the infarct border zone (*p=0.026 for CD11b and Collagen I, n=6 animals per group, two-tailed Mann-Whitney U test). Data are mean ± s.e.m.
Extended Data Figure 10.
Extended Data Figure 10.. Stromal leptin receptor deletion attenuates atherosclerosis, inflammation and hematopoiesis.
(a) Experimental outline for b-h. Leprfl/fl mice and Prx1-creERT2:Leprfl/fl littermates were injected with tamoxifen and received a single IV injection of AAV-PCSK9 followed by a high fat diet for 12 weeks. (b) Representative cross sections of aortic roots stained with Oil red O and assessment of lesion size (*p=0.042, n=8 animals per group, two-tailed Student’s t-test). (c) Flow cytometry enumeration of myeloid cells in aortas of Leprfl/fl and Prx1-creERT2:Leprfl/fl mice (*p=0.023, n=8 animals per group, two-tailed Student’s t-test). (d) CD68 histological staining of aortic root lesions. Percentage of positive staining per plaque (*p=0.029, n=6 animals for Leprfl/fl, n=8 for Prx1-creERT2:Leprfl/fl, two-tailed Mann-Whitney U test). (e) Representative flow plots and statistical analysis of long-term hematopoietic stem cells (LT-HSC) in femur bone marrow (*p=0.046, n=9 animals per group, two-tailed Student’s t-test). (f) Bone marrow colony forming unit assay for complete colonies (CFU-C) of bone marrow mononuclear cells (BMNCs) (*p=0.036, n=9 animals per group, two-tailed Student’s t-test). (g) BrdU incorporation assay 22 hours after intraperitoneal injection for LT-HSC and granulocyte-macrophage progenitors (GMP) proliferation (*p=0.027 for LT-HSC, *p=0.017 for GMP, n=9 animals per group, two-tailed Student’s t-test). (h) Circulating myeloid cells at Zeitgeber time 7 (*p=0.014 for neutrophils, *p=0.046 for monocytes, n=10 animals for Leprfl/fl, n=9 for Prx1-creERT2:Leprfl/fl, two-tailed Student’s t-test). Data are mean ± s.e.m. (i) Athero-express cohort. The flow chart illustrates inclusion criteria for patients and separation into sedentary lifestyle and exercise groups.
Figure 1.
Figure 1.. Exercise increases HSPC quiescence.
(a) Experimental outline. Hematopoietic parameters were measured in C67BL/6 mice that had access to exercise wheels for 6 weeks (exercise) or not (sedentary). (b, c) Proliferation of hematopoietic stem and progenitor cells (LSK; Lin Sca-1+ c-kit+) and multipotent progenitor cells (MPP), as analyzed by BrdU incorporation using flow cytometry. Representative dot plots for LSK (b) and statistical analysis (c) are shown (**p=0.0023, ***p=4.25×10⁻⁸, n=14 sedentary, n=15 exercising animals, 4 independent experiments, two-tailed Student’s t-test). (d) Colony forming unit assay (CFU) of bone marrow mononuclear cells (BMNCs) for granulocytes and macrophages (GM), pre-B cells (preB) and burst-forming unit-erythroid (BFU) (***p=0.00012 for GM, ***p=4.22×10⁻⁵ for preB, p=0.052 for BFU, n=9 animals per group, two-tailed Student’s t-test). (e) Circulating stem cells measured by CFU assay for complete colonies (*p=0.018, n=9 animals per group, 2 independent experiments, two-tailed Student’s t-test). (f-h) Circadian rhythm of leukocyte numbers in the blood (f) (*p=0.029 for Zeitgeber time (ZG) 5, *p=0.038 for ZG 9, **p=0.0025 for ZG 7, n=12 animals for ZG 1, 5, 7, 9, 21, n=8 for ZG 13, 17 for sedentary, n=17 for ZG 1, n=18 for ZG 5, 7, 9, 21, n=12 for ZG 13, 17 for exercise, 3 independent experiments, two-way analysis of variance with Sidak's post hoc test), bone marrow (g) (***p=2.14×10⁻⁶, n=8 and n=11 animals for ZG 1, n=8 and n=12 for ZG 7 for sedentary and exercise, respectively, n=9 per group for ZG 13, n=3 per group for ZG 21; 8 independent experiments, two-way analysis of variance with Sidak's post hoc test) and spleen (h) (*p=0.012, n=4 and n=5 animals for ZG 1, n=7 and n=12 for ZG 7 for sedentary and exercise, respectively, n=6 per group for ZG 13, n=3 per group for ZG 21, 4 independent experiments, two-way analysis of variance with Sidak's post hoc test). (i) Flow cytometry gating for blood leukocytes at ZG 7. (j) Leukocyte subsets in circulation at ZG 7 (*p=0.044 for neutrophils,*p=0.019 for monocytes, **p=0.0025 for CD8 T cells, **p=0.0057 for eosinophils, ***p=0.00022 for B cells, ***p=4.96×10⁻⁶ for CD4 T cells, n=14 and n=18 animals for B cells, T cells, monocytes, n=14 and n=17 for neutrophils, n=10 and n=12 for eosinophils and NK cells for sedentary and exercise, respectively, 4 independent experiments, two-tailed Student’s t-test comparing sedentary and exercise for each cell subset). Data are mean ± s.e.m. We acknowledge servier medical art (www.smart.servier.com) for providing images of mice and cartoon components.
Figure 2.
Figure 2.. Exercise dampens hematopoiesis by reducing adipose tissue leptin production.
(a) Experimental outline for panels b-g. C57BL/6 or LepR-YFP stromal reporter mice had access to exercise wheels for 6 weeks or remained sedentary. (b) Gene expression of maintenance factors in total bone marrow of C57BL/6 mice, as measured by qPCR (*p=0.017 for Cxcl12, *p=0.047 for Vcam1, *p=0.022 for Scf, *p=0.01 for Angpt1, n=12 and n=13 animals for Cxcl12, n=12 and n=14 for Vcam1, Scf, Angpt1, for sedentary and exercise, respectively, 3 independent experiments, two-tailed Student’s t-test). (c) Protein levels by ELISA in tibia marrow plasma (*p=0.021, n=7 animals for sedentary and n=8 for exercise, 2 independent experiments, two-tailed Mann-Whitney U test). (d) Left, representative plots for flow sorting LepR-YFP+ stromal cells. Right, expression of maintenance factors as assessed by qPCR (***p=0.009 for Cxcl12, *p=0.018 for Vcam1, ***p=0.0005 for Scf, **p=0.0071 for Angpt1, n=8 animals per group for Cxcl12, n=8 and n=9 for Vcam1, Scf, Angpt1 for sedentary and exercise, respectively, 6 independent experiments, two-tailed Mann-Whitney U test). (e-g) Leptin expression, as measured by qPCR in visceral adipose tissue (**p=0.0022, n=6 animals per group, 2 independent experiments, Mann-Whitney U test) (e) and blood (***p=0.0007, n=15 animals per group, 3 independent experiments, two-tailed Mann-Whitney U test) (f) and bone marrow (***p=0.0003, n=19 animals for sedentary and n=18 for exercise, two-tailed Mann-Whitney U test) by ELISA (g). (h) Left, experimental outline; osmotic minipumps producing saline or leptin were implanted subcutaneously in C57BL/6J mice, which then were allowed to exercise or not starting 3 days after implantation. Right, levels of circulating leukocytes at Zeitgeber time 7 (**p=0.0015 for Ex-Saline vs Ex-Leptin, ***p=0.0009 for Sed-Saline vs Ex-Saline, ***p=1.77×10⁻⁷ for Sed-Leptin vs Ex-Saline, n=13 animals for Sed-Saline and Ex-Leptin, n=9 for Sed-Leptin, and n=12 for Ex-Saline, 5 independent experiments, one-way analysis of variance with Sidak's post hoc test). (i) Experimental outline for panels j-l. Prx1-creERT2:Leprfl/fl mice or their Leprfl/fl littermates were injected 3 times with tamoxifen every other day and were sacrificed 2 weeks after the last injection. (j) Gene expression in total bone marrow, as measured by qPCR (*p=0.02 for Cxcl12, **p=0.0094 for Vcam1, **p=0.0064 for Scf, **p=0.0099 for Angpt1, n=8 animals for Leprfl/fl and n=9 for Prx1-creERT2:Leprfl/fl, 3 independent experiments, two-tailed Student’s t-test) (k) BrdU incorporation into LSK, as measured by FACS, 22 hrs after intraperitoneal injection (*p=0.043, n=6 animals for Leprfl/fl and n=8 for Prx1-creERT2:Leprfl/fl, 2 independent experiments, two-tailed Mann-Whitney U test). (l) Circulating leukocyte levels at Zeitgeber time 7 (***p=1.7×10⁻⁵, n=8 animals for Leprfl/fl n=9 for Prx1-creERT2:Leprfl/fl, 3 independent experiments, two-tailed Student’s t-test). All mRNA levels were normalized to Actb Ct values. Data are mean ± s.e.m. We acknowledge servier medical art (www.smart.servier.com) for providing images of mice and cartoon components.
Figure 3.
Figure 3.. Voluntary running reduces LSK chromatin accessibility.
(a) Experimental outline for b. Sedentary control C57BL/6J mice had no access to exercise wheels (top); the exercise group had access to wheels during the last 6 weeks before sacrifice (middle), and the post-exercise-sedentary group had access to wheels for 6 weeks after which the wheels were removed for the following 3 weeks (bottom). (b) Circulating leukocyte levels (*p=0.033, **p=0.0025, n=9 animals for sedentary and exercise, n=6 for post-exercise-sedentary, 3 independent experiments, Kruskal-Wallis test with Dunn's post hoc test) at Zeitgeber time 7 and BrdU incorporation in LSK, as measured 22 hours after intraperitoneal injection (**p=0.0043, n=8 for sedentary and n=7 for exercise and post-exercise-sedentary, 2 independent experiments, Kruskal-Wallis test with Dunn's post hoc test). (c) Experimental outline of competitive bone marrow transplantation experiments in d-g. LSK were isolated from donors that had either exercised for 6 weeks (CD45.2) or were sedentary (CD45.1STEM) and were then transplanted in a 1:1 ratio into irradiated UBC-GFP recipients. (d) Left, flow cytometry plots of circulating leukocytes after transplantation. The left panel depicts a control that had received LSK from a sedentary CD45.2 mouse and a sedentary CD45.1STEM mouse, whereas the right panel depicts the experimental group as diagrammed in c. (e) Blood chimerism 4 weeks after transplantation (*p=0.016, n=7 animals per group, Wilcoxon matched-pairs signed rank test). (f) Dot plot and quantification of bone marrow LSK chimerism (n=8 animals per group). (g) BrdU incorporation in LSK 22 hours after intraperitoneal injection (***p=0.0006, n=7 animals per group, 2 independent experiments, two-tailed Mann-Whitney U test) and LT-HSC chimerism (n=5 animals per group). Data are mean ± s.e.m. (h) Experimental outline for i-n. LSK were isolated from the experimental groups in a and subjected to ATAC-seq analysis. (i) Genomic distribution of ATAC-seq peaks (numbers in pie chart) in LSK among genes, promoters, enhancers and other intergenic regions. (j) Profiles of average ATAC-seq tag density over all transcriptional start site (TSS)-proximal regions (TSS ± 3 kb) in LSK. Each curve refers to individual mouse, see h for color coding. (k) Scatter plot of normalized tag density at ATAC-seq peaks comparing LSK from sedentary versus exercise cohorts. Peaks with significantly lower and higher tag density in running mice are highlighted in orange and black, respectively (FDR<0.01). The top ten significant genes in the cell cycle pathway, as determined by DAVID (refer to n), and Mki67 are indicated; see Supplementary Table 1 for all genes. (l) Patterns of chromatin accessibility among 3605 TSS-proximal peaks (within TSS ± 3Kbp) with differential ATAC-seq signal between conditions (FDR<0.01). Heatmap color indicates the ATAC-seq tag density relative to the average across all samples for the given peak. (m) Tracks of normalized ATAC-seq tag density for the Mki67, Kif23, Haus3, Taf1 and Crocc loci. (n) Functional pathway categories of differential chromatin accessibility in sedentary versus exercising mice as determined by DAVID. (o) Enrichment analysis of the gene set “Reactome Cell Cycle” in RNA-seq of LSK from mice in exercise and post-exercise-sedentary versus sedentary groups. Genes were ranked by log2-fold change. (p,q) Gene ontology biological process categories (p) and Reactome gene sets (q) enriched in genes that are at least two-fold downregulated in exercising mice versus sedentary mice. Gene ratio, fraction of tested genes belonging to each gene set. P-values are from the hypergeometric distribution. (r) Enrichment analysis of gene sets related to oxidative phosphorylation in LSKs from exercising vs. sedentary mice. Genes were ranked by log2-fold change. Experimental groups in o-r are as diagrammed in a (Ex, exercise; Post-Ex-Sed, sedentary after exercise; All Ex, combination of Ex and Post-Ex-Sed). All FDR values were calculated with the Benjamini-Hochberg Procedure. We acknowledge servier medical art (www.smart.servier.com) for providing images of mice and cartoon components.
Figure 4.
Figure 4.. Exercise augments emergency hematopoiesis and improves survival in sepsis.
(a) Experimental outline for panels b-e. C57BL/6J mice received intraperitoneal injections of LPS after 6 weeks of exercise or no exercise. Analysis was performed 24hrs after LPS injection. (b) Bone marrow colony forming unit assay (CFU) of bone marrow mononuclear cells (BMNCs) (*p=0.048, n=7 animals per group, 2 independent experiments, two-tailed Mann-Whitney U test). (c) Bone marrow common myeloid progenitors (CMP), granulocyte macrophage progenitors (GMP) and macrophage dendritic cell progenitors (MDP) 24 hours after LPS injection (*p=0.018, ***p=0.0004 for CMP, ***p=0.0008 for GMP, n=10 animals for sedentary, n=9 for exercise, 3 independent experiments, two-tailed Mann-Whitney U test). (d) Numbers of neutrophils (*p=0.01), monocytes (**p=0.0028), B (*p=0.038) and T cells (*p=0.04) in the circulation (n=10 and n=9 animals for neutrophils and monocytes, n=10 and n=8 for B and T cells for sedentary and exercise, respectively, 3 independent experiments, two-tailed Mann-Whitney U test) and (e) peritoneal cavity after LPS (*p=0.038 for monocytes, *p=0.011 for B cells, *p=0.018 for T cells, n=7 and n=6 animals for neutrophils for sedentary and exercise, respectively, n=7 per group for monocytes, B and T cells, 2 independent experiments, two-tailed Mann-Whitney U test). (f) Experimental outline for panels g-h. Cecal ligation and puncture (CLP) was induced after 6 weeks of exercise or in sedentary controls. (g) Body core temperature was measured before CLP surgery (baseline) and 48 hours after CLP (**p=0.0043, n=6 animals for baseline and n=5 for each CLP group, 2 independent experiments, two-tailed Mann-Whitney U test comparing sedentary and exercise post-CLP). Data are mean ± s.e.m. (h) Survival after CLP (*p=0.012, n=11 sedentary and n=10 exercise mice post-CLP, 3 independent experiments, Mantel-Cox log-rank test). We acknowledge servier medical art (www.smart.servier.com) for providing images of mice and cartoon components.
Figure 5.
Figure 5.. Disrupting leptin signaling reduces hematopoiesis and inflammation in acute myocardial infarction.
(a) Left, serum leptin levels (**p=0.0089, n=5 animals per group, Kruskal-Wallis with Dunn's post hoc test) and right, bone marrow leptin levels (*p=0.017 for control vs MI day 1, *p=0.015 for MI day 1 vs day 3, n=4 animals for control, n=7 for MI day 1, n=5 for MI day 3, Kruskal-Wallis with Dunn's post hoc test) at days 1 or 3 after MI in C57BL/6J mice or naive controls, as measured by ELISA. (b) Experimental outline for panels c-g. Prx1-creERT2:Leprfl/fl mice or their Leprfl/fl littermates received a myocardial infarct 4 weeks after having been injected 3 times with tamoxifen every other day. Mice were sacrificed 3 days after MI. (c) Gene expression in total bone marrow, as measured by PCR (*p=0.035 for Cxcl12, *p=0.014 for Vcam1, **p=0.0023 for Scf, **p=0.0087 for Angpt1, n=6 animals for Leprfl/fl and n=7 for Prx1-creERT2:Leprfl/fl for Cxcl12, Vcam1, Scf, n=6 per group for Angpt1, 2 independent experiments, two-tailed Mann-Whitney U test). mRNA levels were normalized to Actb Ct values. (d) BrdU incorporation into LSK 22 hrs after intraperitoneal injection, as measured by FACS (*p=0.022, n=6 animals for Leprfl/fl and n=7 for Prx1-creERT2:Leprfl/fl, 2 independent experiments, two-tailed Mann-Whitney U test). (e) Left, bone marrow colony forming unit assay (CFU) of bone marrow mononuclear cells (BMNCs) for complete colonies (CFU-C) (**p=0.0012, n=6 animals for Leprfl/fl and n=7 for Prx1-creERT2:Leprfl/fl, 2 independent experiments, two-tailed Mann-Whitney U test) Right, representative image of assay. (f) Circulating leukocyte levels (*p=0.022, n=6 animals for Leprfl/fl and n=7 for Prx1-creERT2:Leprfl/fl, 2 independent experiments, two-tailed Mann-Whitney U test). (g) Neutrophil (**p=0.0082), monocyte (**p=0.0012), macrophage (**p=0.0012) and lymphocyte (**p=0.0047) numbers in the infarct (n=6 animals for Leprfl/fl and n=7 for Prx1-creERT2:Leprfl/fl, 2 independent experiments, two-tailed Mann-Whitney U test). (h) Experimental outline for panels c-g. Mice received 3 tamoxifen injections every other day and an MI 2 weeks later. Cardiac MRI was done 3 weeks post MI. (i,j) Cardiac MRI in Prx1-creERT2:Leprfl/fl mice and their Leprfl/fl littermates, representative short-axis images (i) and statistical analysis (j) (**p=0.0097 for EDV, **p=0.0046 for ESV, *p=0.043 for EF, n=7 animals for Leprfl/fl and n=10 for Prx1-creERT2:Leprfl/fl, 3 independent experiments, two-tailed Mann-Whitney U test). We acknowledge servier medical art (www.smart.servier.com) for providing images of mice and cartoon components.
Figure 6.
Figure 6.. Sedentary lifestyle accelerates leukocyte supply in mice and humans with atherosclerosis.
(a) Experimental outline for b-j. ApoE−/− mice consumed a Western-type diet for a total of 20 weeks. After 10 weeks, half of them were given access to a running wheel for 10 weeks. (b) Leptin concentration in blood (**p=0.0011) and tibia (***p= 4.06×10⁻⁵, n=18 animals for sedentary and n=10 for exercise, 4 independent experiments, two-tailed Mann-Whitney U test). (c-f) Circulating leukocytes as measured by flow cytometry, during the last ten weeks of diet (c) (*p=0.017, ***p=1.9×10⁻⁷ for 8 weeks, ***p= 6×10⁻⁸ for 10 weeks, n=19 and n=13 animals for week 0, n=4 and n=5 for week 2, n=20 and n=14 for week 8, n=21 and n=14 for week 10 for sedentary and exercise, respectively, n=5 per group for week 4, n=7 per group for week 6, two-way analysis of variance with Sidak’s post hoc test). (d) Flow cytometry gating strategy for leukocytes. (e) Blood myeloid cells (**p=0.0011, n=21 animals for sedentary and n=13 for exercise) and lymphocytes (*p=0.034, n=20 for sedentary and n=13 for exercise, 4 independent experiments, two-tailed Student’s t-test) in circulation. (f) Neutrophils (**p=0.069, n=21 animals for sedentary and n=13 animals for exercise), monocytes (***p=0.00058, n=20 and n=14), B (*p=0.042, n=20 and n=13) and T cells in circulation (n=21 and n=14 for sedentary and exercise, respectively, 4 independent experiments, two-tailed Mann-Whitney U test). (g) Flow cytometry gating in aorta and (h) enumeration of neutrophils (**p=0.0036), monocytes (*p=0.046), macrophages (***p=1.88×10⁻⁵) and lymphocytes (*p=0.015, n=16 animals for sedentary and n=9 for exercise, two-tailed Student’s T test). (i) Masson’s Trichrome histology images of aortic root for plaque size analysis (j) (**p=0.0043, n=18 animals for sedentary and n=12 for exercise, two-tailed Student’s t-test). Data are mean ± s.e.m. (k) Left, cohorts and numbers among 4,892 participants in the Canakinumab Anti-inflammatory Thrombosis Outcomes Study (CANTOS) according to self-reported exercise levels. Right, median values and interquartile ranges for leptin and the total leukocyte count according to exercise level. Effects were statistically significant across exercise groups for both leptin and leukocyte count in both univariate and multivariate models. (l) Left, cohorts and numbers of patient from the Athero-Express study according to exercise level. Right, median values and interquartile ranges for leptin and the total leucocyte count (also see Extended Data Fig. 10i and Supplementary Tables 3–5) (one-way analysis of variance and multivariate linear regression models with correction for age, sex, BMI, diabetes, hypercholesterolemia and statin use). (m) Summary cartoon, see text for details. We acknowledge servier medical art (www.smart.servier.com) for providing images of mice and cartoon components.

Comment in

References

    1. Ridker PM Residual inflammatory risk: addressing the obverse side of the atherosclerosis prevention coin. Eur Heart J 37, 1720–1722 (2016). - PubMed
    1. Ridker PM et al. Antiinflammatory Therapy with Canakinumab for Atherosclerotic Disease. N Engl J Med 377, 1119–1131 (2017). - PubMed
    1. Madjid M, Awan I, Willerson JT & Casscells SW Leukocyte count and coronary heart disease: implications for risk assessment. J Am Coll Cardiol 44, 1945–1956 (2004). - PubMed
    1. Nahrendorf M & Swirski FK Lifestyle effects on hematopoiesis and atherosclerosis. Circ Res 116, 884–894 (2015). - PMC - PubMed
    1. Tall AR & Yvan-Charvet L Cholesterol, inflammation and innate immunity. Nat Rev Immunol 15, 104–116 (2015). - PMC - PubMed

Publication types

MeSH terms