

Procoagulant Activity of Red Blood Cell-Derived Microvesicles during Red Cell Storage
- PMID: 31700504
- PMCID: PMC6739704
- DOI: 10.1159/000494367
Procoagulant Activity of Red Blood Cell-Derived Microvesicles during Red Cell Storage
Abstract
Background: Red blood cells (RBCs) undergo structural and biochemical alterations during storage which are collectively called RBC storage lesion and cause a decrease in RBC recovery and survival. During storage, erythrocytes release an increasing number of microvesicles (MVs) that have key roles in biological processes. We aimed to investigate the procoagulant activity (PCA) of RBC-derived MVs during storage.
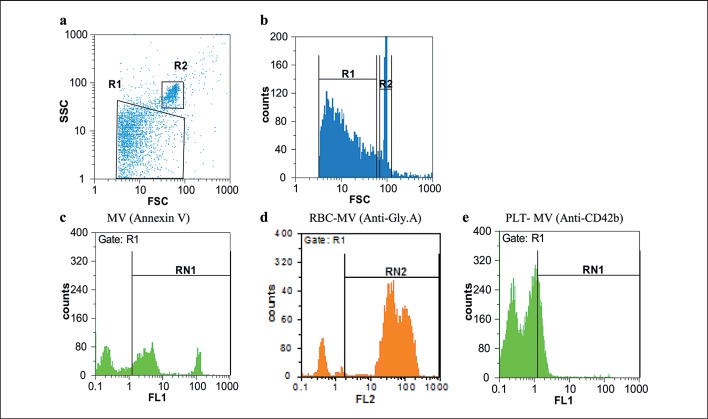
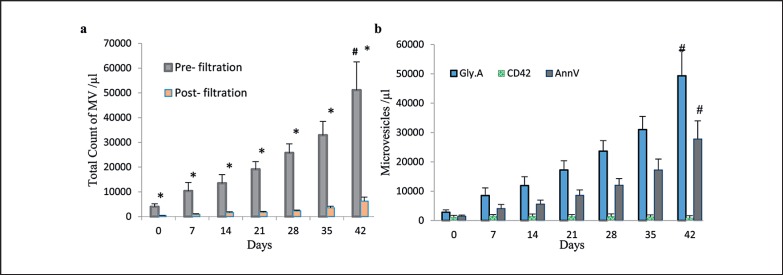
Methods: 20 packed RBCs were stored for up to 42 days. Samples were taken at seven different times and evaluated for the presence of RBC-MVs. MVs were separated, and following filtration flow cytometry was used to characterize RBC-MVs based on the expression of glycophorin A (Gly.A) and annexin V (AnnV) antigens. The coagulant activity of RBC-MVs was tested by clotting time (CT) and PCA assays. Results were compared before and after filtration.
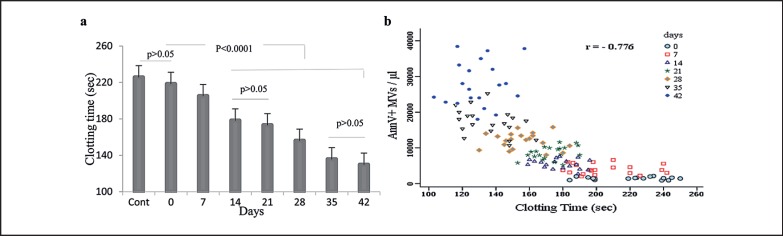
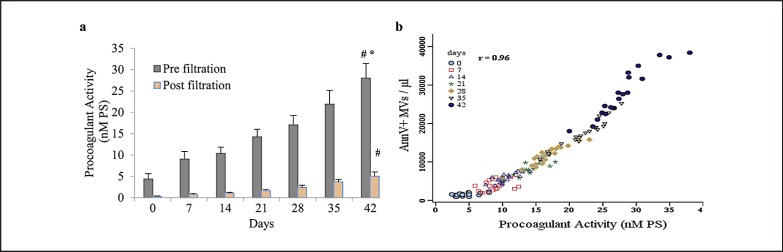
Results: Flow cytometry revealed a 17.6-fold increase in RBC-MVs after 6 weeks of storage. Significant correlations were found between AnnV+ MVs and PCA (r = 0.96; p < 0.001), and CT (r = -0.77; p < 0.001) which was associated with increased PCA and shortened CT with RBC aging. Filtration of samples efficiently removed MVs (p < 0.001) and also reduced in vitro PCA of MVs (p < 0.001).
Conclusion: RBC-MVs are procoagulant (particularly AnnV+ MVs) Reduction of MVs from RBC concentrates may reduce the risk of transfusion-induced thrombotic complications.
Keywords: Filtration; Microvesicles; Procoagulant activity; Red blood cell storage.
Copyright © 2018 by S. Karger AG, Basel.
Conflict of interest statement
The authors declare no conflicts of interest.
Figures
Similar articles
-
Supernatants from stored red blood cell (RBC) units, but not RBC-derived microvesicles, suppress monocyte function in vitro.Transfusion. 2015 Aug;55(8):1937-45. doi: 10.1111/trf.13084. Epub 2015 Mar 27. Transfusion. 2015. PMID: 25819532
-
Procoagulant role of microparticles in routine storage of packed red blood cells: potential risk for prothrombotic post-transfusion complications.Pathology. 2017 Jan;49(1):62-69. doi: 10.1016/j.pathol.2016.10.001. Epub 2016 Nov 26. Pathology. 2017. PMID: 27899173
-
Association of Circulating Procoagulant Microvesicles with Painful Vaso-Occlusive Crisis in Sickle Cell Disease.Transfus Med Hemother. 2023 Mar 30;50(5):448-455. doi: 10.1159/000525640. eCollection 2023 Oct. Transfus Med Hemother. 2023. PMID: 37936632 Free PMC article.
-
Red blood cell storage lesion.J Vet Emerg Crit Care (San Antonio). 2015 Mar-Apr;25(2):187-99. doi: 10.1111/vec.12252. Epub 2014 Nov 26. J Vet Emerg Crit Care (San Antonio). 2015. PMID: 25428860 Review.
-
Deformability of Stored Red Blood Cells.Front Physiol. 2021 Sep 22;12:722896. doi: 10.3389/fphys.2021.722896. eCollection 2021. Front Physiol. 2021. PMID: 34690797 Free PMC article. Review.
Cited by
-
Characteristics of culture-condition stimulated exosomes or their loaded hydrogels in comparison with other extracellular vesicles or MSC lysates.Front Bioeng Biotechnol. 2022 Sep 16;10:1016833. doi: 10.3389/fbioe.2022.1016833. eCollection 2022. Front Bioeng Biotechnol. 2022. PMID: 36185445 Free PMC article. Review.
-
Membrane Microvesicles as Potential Vaccine Candidates.Int J Mol Sci. 2021 Jan 24;22(3):1142. doi: 10.3390/ijms22031142. Int J Mol Sci. 2021. PMID: 33498909 Free PMC article. Review.
-
Quantifying dynamic range in red blood cell energetics: Evidence of progressive energy failure during storage.Transfusion. 2021 May;61(5):1586-1599. doi: 10.1111/trf.16395. Epub 2021 Apr 8. Transfusion. 2021. PMID: 33830505 Free PMC article.
-
Innate Immunity Communicates Using the Language of Extracellular Microvesicles.Stem Cell Rev Rep. 2021 Apr;17(2):502-510. doi: 10.1007/s12015-021-10138-6. Epub 2021 Feb 25. Stem Cell Rev Rep. 2021. PMID: 33634435 Free PMC article. Review.
-
Extracellular microvesicles/exosomes: discovery, disbelief, acceptance, and the future?Leukemia. 2020 Dec;34(12):3126-3135. doi: 10.1038/s41375-020-01041-z. Epub 2020 Sep 14. Leukemia. 2020. PMID: 32929129 Free PMC article. Review.
References
-
- Vlassov A, Magdaleno S, Setterquist R, Conrad R. Exosomes: current knowledge of their composition, biological functions, and diagnostic and therapeutic potentials. Biochim Biophys Acta. 2012;1820:940–948. - PubMed
-
- Westerman M, Porter JB. Red blood cell-derived microparticles: an overview. Blood Cells Mol Dis. 2016;59:134–139. - PubMed
-
- Ayers L, Kohler M, Harrison P, Sargent I, Dragovic R, Schaap M, Nieuwland R, Brooks S, Ferry B. Measurement of circulating cell-derived microparticles by flow cytometry: sources of variability within the assay. Thromb Res. 2011;127:370–377. - PubMed
-
- Morel O, Jesel L, Freyssinet JM, Toti F. Cellular mechanisms underlying the formation of circulating microparticles. Arterioscler Thromb Vasc Biol. 2011;31:15–26. - PubMed
LinkOut - more resources
Full Text Sources
