. 2019 Jul 4;15(11):1195-1203.
doi: 10.1038/s41567-019-0618-1. Epub 2019 Aug 12.

Tissue Fluidity Promotes Epithelial Wound Healing

Affiliations

Tissue Fluidity Promotes Epithelial Wound Healing

Robert J Tetley et al. Nat Phys. .

Abstract

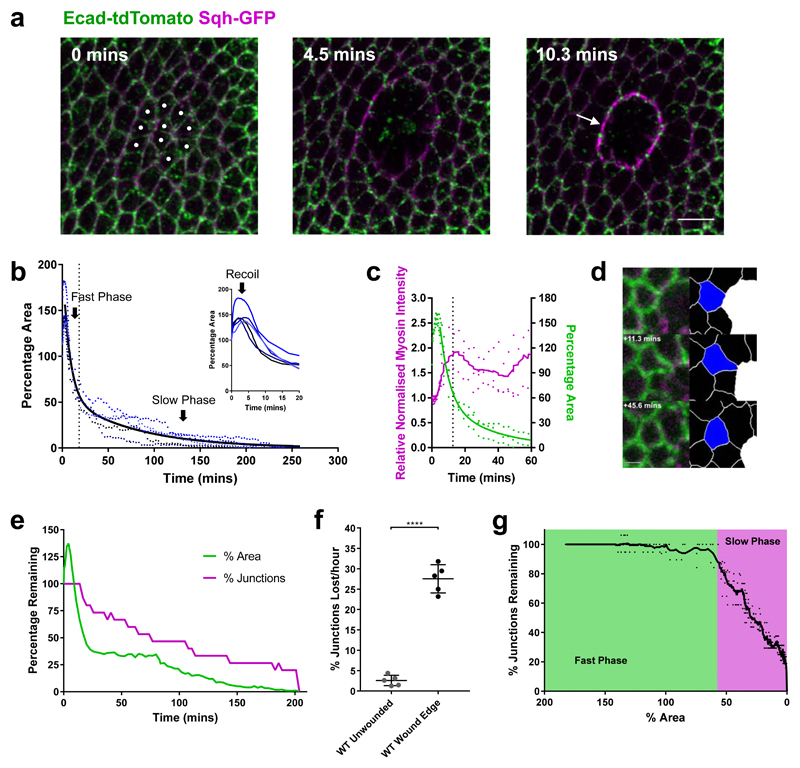
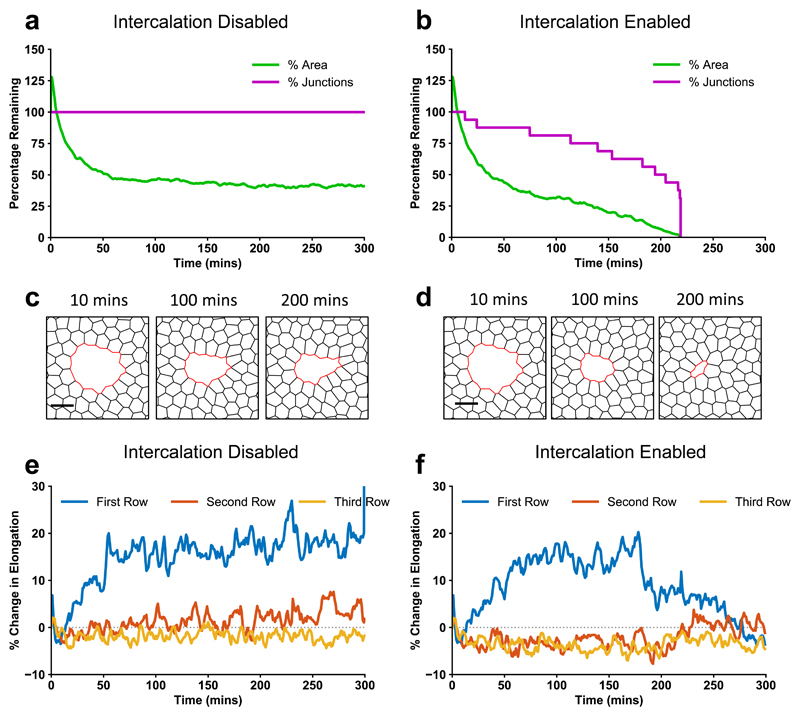
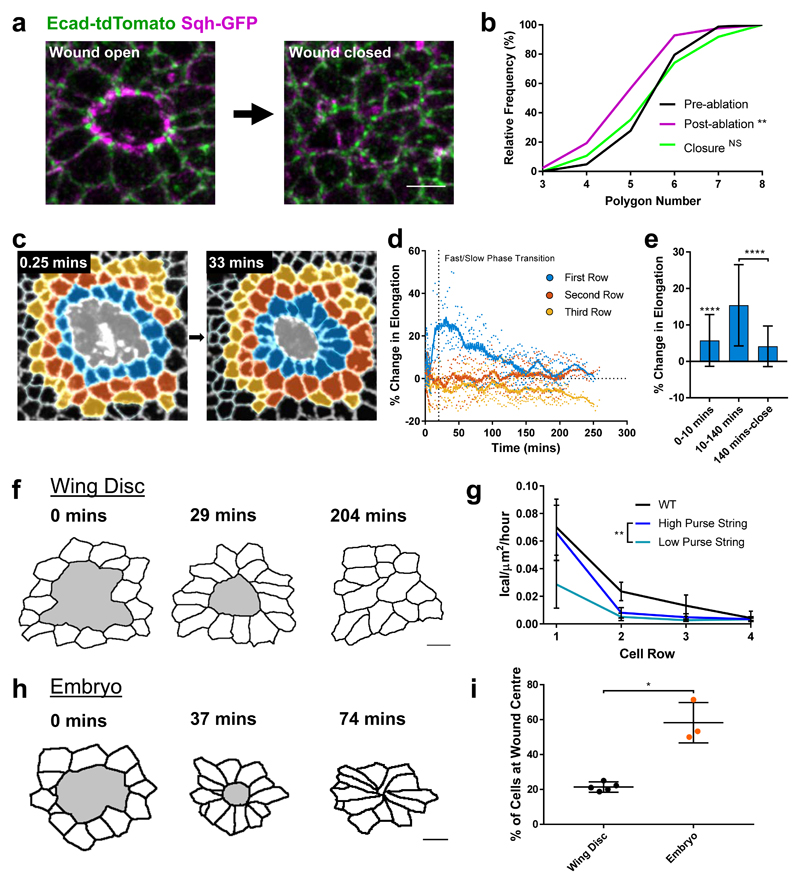
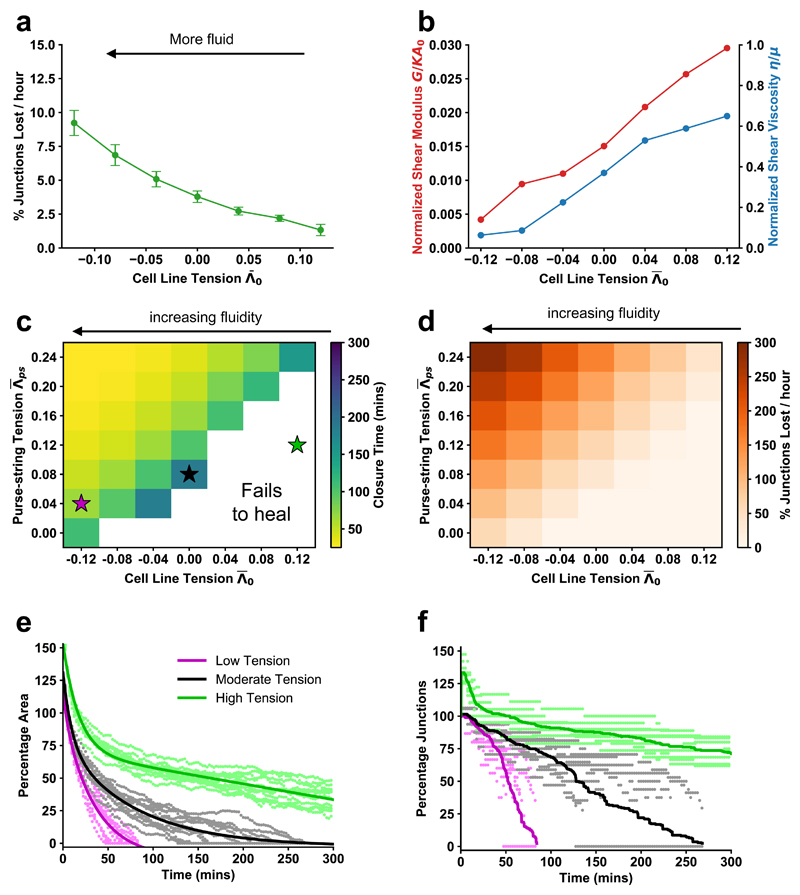
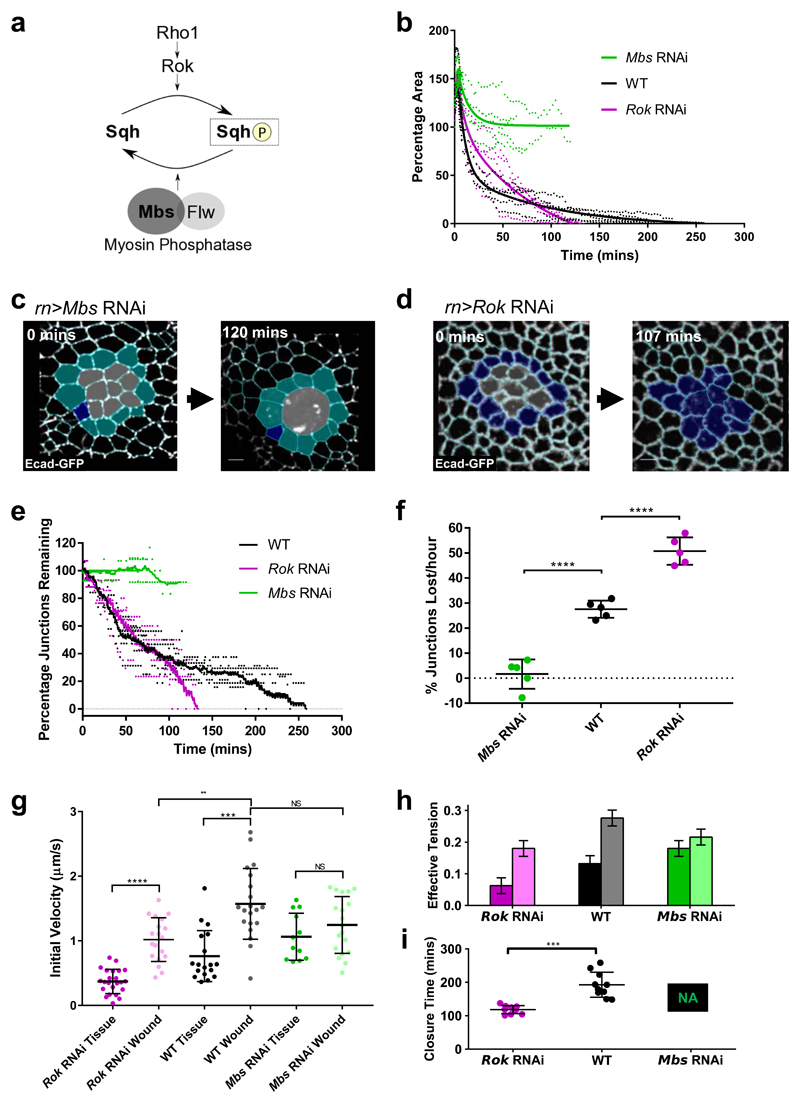
The collective behaviour of cells in epithelial tissues is dependent on their mechanical properties. However, the contribution of tissue mechanics to wound healing in vivo remains poorly understood. Here we investigate the relationship between tissue mechanics and wound healing in live Drosophila wing imaginal discs and show that by tuning epithelial cell junctional tension, we can systematically alter the rate of wound healing. Coincident with the contraction of an actomyosin purse string, we observe cells flowing past each other at the wound edge by intercalating, reminiscent of molecules in a fluid, resulting in seamless wound closure. Using a cell-based physical model, we predict that a reduction in junctional tension fluidises the tissue through an increase in intercalation rate and corresponding reduction in bulk viscosity, in the manner of an unjamming transition. The resultant fluidisation of the tissue accelerates wound healing. Accordingly, when we experimentally reduce tissue tension in wing discs, intercalation rate increases and wounds repair in less time.


Conflict of interest statement

Competing Interests We confirm that the authors have no competing interests.

Figures

Figure 1
Figure 1. Wing disc wound closure is punctuated by wound edge intercalation, which can drive wound closure
a, Early stages of wound closure in a sqhAX3; sqh-GFP, Ecad-tdTomato wing imaginal disc. Cell outlines are marked by Ecad-tdTomato (green) and Myosin II by Sqh-GFP (magenta). Cells which will be ablated are marked by white circles at 0 mins. Within the first 10 minutes after wounding, a strong accumulation of Myosin II can be seen at the wound’s edge in the manner of a purse string (arrow). Images are maximum intensity projections of deconvolved image stacks. Scale bar = 5µm. b, Dynamics of wing disc wound closure. Percentage of original wound area is plotted over time for 5 WT wing discs expressing Ecad-GFP (blue dots, the same 5 wing discs are used for all subsequent WT analysis unless otherwise stated). Inset: first 20 mins, showing early expansion (recoil) of the wound. A two-phase exponential decay curve (black line) is fitted to the data after 3 minutes, when the wound begins to reduce in area until close. The transition between fast and slow closure phases of the two-phase exponential decay is marked by a dotted line (18.37 mins). c, Quantification of Myosin II purse string intensity (magenta, left y-axis) and wound percentage area (green, right y-axis) for 3 sqhAX3; sqh-GFP, Ecad-tdTomato wing discs during the first hour of wound closure. A two-phase exponential decay curve has been fitted to the area data (green line) and a moving average (±4 time points) curve to the Myosin II intensity data (magenta line). The transition between fast and slow closure phases is shown with a dotted line (12.71 mins) d, Example of a single wound edge intercalation in an Ecad-GFP; sqh-mCherry, pnr-GAL4 wing disc. Raw maximum intensity projection (left) and skeletonised images (right, intercalating cell in blue, wound in white) are shown. The junction shared between the intercalating cell and the wound shrinks to a point and a new junction grows in the orthogonal direction. Scale bar = 3µm. e, Quantification of the percentage of starting wound edge junctions (magenta) and wound percentage area (green) for a single Ecad-GFP wing disc wound. The percentage of junctions remaining on the wound’s edge reduces as intercalations occur until the wound fully closes. f, Quantification of intercalation rate in unwounded WT tissues and at WT wound edges. The intercalation rate is significantly higher at the wound edge (unpaired t-test with Welch’s correction, n=5, t=15.15, df=5.089, p<0.0001). Error bars = SD. g, Relationship between percentage of wound start area and percentage of starting wound edge junctions remaining. The mean percentage area at which there is a transition between the fast (green) and slow (magenta) closure phases is highlighted (57.6%). A moving average curve (±4 time points) of the data is shown.
Figure 2
Figure 2. A vertex model of wound healing predicts that intercalation is necessary for wound closure and cell shape maintenance
a-f, Vertex model simulations. a, b, Percentage of initial wound area and wound junctions after ablation with intercalations (a) disabled, and (b) enabled. c, d,Vertex model simulation images after ablation with intercalations (c) disabled, and (d) enabled. e, f, Percentage change in cell elongation over time during and after wound closure, calculated by dividing the major axis by the minor axis of an ellipse fit to each cell, for the first three rows of cells around the wound with intercalations (e) disabled, and (f) enabled.
Figure 3
Figure 3. Wound edge intercalation preserves cell shape
a, Maximum intensity projection images of a wound in a sqhAX3; sqh-GFP, Ecad-tdTomato wing disc before (left) and immediately after (right) wound closure (scale bar = 3µm). b, Quantification of wound edge cell polygon number before ablation, immediately after ablation and immediately after wound closure. The distribution of polygon number is significantly shifted left after ablation (Kolmogorov-Smirnov Test, D=0.2892, p=0.0019) but is restored upon closure (Kolmogorov-Smirnov Test, D=0.07583, p=0.9692). c, Colour coding of the first three rows away from the wound edge (first row blue, second row orange, third row yellow) for time points immediately after wounding (0.25 mins) and soon after the onset of wound edge intercalation (33 mins). Image is an adaptive projection of Ecad-GFP overlaid by skeletonised cell outlines. Scale bar = 5µm. d, Quantification of the percentage change in mean cell elongation for the first three rows of cells (colour coding as in c) over time for 5 WT wounds. Moving average curves (±4 time points) are shown. The transition between fast and slow closure phases is marked by a dotted line (18.37 mins). e, Percentage change in mean elongation of first row cells for three time windows; 0-10 mins (wound recoil), 10-140 mins (early wound closure), 140 mins – close (late wound closure). Data is pooled from the data set in d. Cells were significantly elongated during the recoil phase (Wilcoxon Signed Rank Test, p<0.0001). Cells were significantly more elongated during early wound closure than during late wound closure (Kolomogorov-Smirnov Test, D=0.5703, p<0.0001). Error bars = SD. f, h, Skeletonised cell outlines of cells starting at the wound edge (wound shaded in grey) at three time points in a (f) single WT wing disc (scale bar = 3µm) and a (h) single WT stage 13 embryo (scale bar = 5µm). g, Quantification of intercalation rates in rows of cells away from the wound for WT wing discs (black) and vertex model simulations with high (dark blue) and low (light blue) purse string strength. The intercalation rate in simulations is significantly higher in the first row of cells with a high purse string strength (Kolomogorov-Smirnov Test, D=0.6667, p=0.0097). i, Quantification of the percentage of cells remaining close to the wound’s centre after closure, as a measure of intercalation. A significantly higher percentage of cells remain close to the wound centre in embryos (n=3) compared to wing discs (n=5) (unpaired t-test with Welch’s correction, t=5.466, df=2.103, p=0.0285).
Figure 4
Figure 4. Reducing tissue contractility enhances fluidity and can speed wound closure
All figures are vertex model simulations. a, Intercalation rate in an unwounded tissue against mean cell line tension. Error bars = SD. b, Normalized tissue shear modulus and viscosity against tension. c, Mean wound closure time against cell line tension and purse-string tension. The white region indicates parameter space where wounds fail to close within 300 minutes. The colored stars indicate the parameters used in (e) and (f). d, Mean wound edge intercalation rate against cell line tension and purse-string tension. e, Percentage of initial area over time for low, moderate, and high line tension cases. Points are from simulations, and lines are fit dual exponential curves. f, Percentage of initial wound junctions over time for low, moderate, and high tension cases. Points are from simulations; lines are the average over all simulations. For all combinations of tension, n = 12 simulations for each.
Figure 5
Figure 5. Myosin activity controls tissue fluidity and wound closure rate
a, Activation of Myosin II by phosphorylation of its regulatory light chain (Sqh) can be performed by Rho kinase (Rok) downstream of Rho1. Myosin II inactivation by Sqh dephosphorylation can be performed by the Myosin Phosphatase comprising the Myosin binding subunit (Mbs) and catalytic subunit (Flapwing, Flw). b, Quantification of wound closure (as percentage of start wound area) over time in Mbs RNAi (green, n=5) and Rok RNAi (magenta, n=5) wing discs, compared to WT wound closure (black, n=5). Two-phase exponential decays are fitted after 3 minutes. c, d, Examples of wound healing in (c) Mbs RNAi and (d) Rok RNAi before wounding (left) and after wound closure (right, Rok RNAi) or when further segmentation become impossible (right, Mbs RNAi). Cells are colour coded according to whether they undergo intercalation (dark blue) or not (cyan). Images are adaptive projections of Ecad-GFP overlaid by skeletonised cell outlines in cyan (scale bars = 3µm). e, Quantification of the percentage of initial wound edge junctions over time for Mbs RNAi and Rok RNAi wing discs (colours and n numbers as in b). Moving average curves (±4 time points) are shown. f, Quantification of mean intercalation rate for Mbs RNAi, WT and Rok RNAi wounds (colours and n numbers as in b). Intercalation rate is significantly higher in Rok RNAi wounds (unpaired t-test, n=5, t=8.026, df=8, p<0.0001) and significantly lower in Mbs RNAi wounds (unpaired t-test, n=5, t=8.503, df=8, p<0.0001) compared to WT. Error bars = SD. g, Quantification of initial vertex recoil rates after single junction ablations in WT (black), Mbs RNAi (green) and Rok RNAi (magenta) wing discs. Junction ablations were performed in unwounded tissues (“Tissue”) and at wound edges (“Wound”). Wound edge vertex recoil rates were significantly higher than in the surrounding tissue in WT and Rok RNAi discs, but not Mbs RNAi discs. Vertex recoil rates at the wound edge were significantly lower in Rok RNAi discs compared to WT discs, but were not significantly changed in Mbs RNAi discs. Full results of Kolmogorov Smirnov tests can be found in Supplementary Table 1. h, Input mean and standard deviation of effective tension, the total of line tension and contractility, for different simulated conditions. The left bars are for bulk edges, and right edges are for wound edges. i, Mean wound closure time for the simulated conditions. Mbs RNAi simulated wounds fail to heal. Error bars = SD. Wound closure time is significantly lower in Rok RNAi wounds than WT wounds (unpaired t-test, n=10, t=6.298, df=18, p<0.0001).

References

    1. Ladoux B, Mege RM. Mechanobiology of collective cell behaviours. Nat Rev Mol Cell Bio. 2017;18:743–757. doi: 10.1038/nrm.2017.98. - DOI - PubMed
    1. Cochet-Escartin O, Ranft J, Silberzan P, Marcq P. Border Forces and Friction Control Epithelial Closure Dynamics. Biophys J. 2014;106:65–73. doi: 10.1016/j.bpj.2013.11.015. - DOI - PMC - PubMed
    1. Nier V, et al. Tissue fusion over nonadhering surfaces. P Natl Acad Sci USA. 2015;112:9546–9551. doi: 10.1073/pnas.1501278112. - DOI - PMC - PubMed
    1. Arciero JC, Mi Q, Branca MF, Hackam DJ, Swigon D. Continuum Model of Collective Cell Migration in Wound Healing and Colony Expansion. Biophys J. 2011;100:535–543. doi: 10.1016/j.bpj.2010.11.083. - DOI - PMC - PubMed
    1. Brugues A, et al. Forces driving epithelial wound healing. Mol Biol Cell. 2014;25 - PMC - PubMed