

Fine mapping of thyroglobulin gene identifies two independent risk loci for Graves' disease in Chinese Han population
- PMID: 31700870
- PMCID: PMC6803187
- DOI: 10.21037/atm.2019.08.115
Fine mapping of thyroglobulin gene identifies two independent risk loci for Graves' disease in Chinese Han population
Abstract
Background: This study aimed to determine independent risk loci of Graves' disease (GD) in the thyroglobulin (TG) region.
Methods: In this two-staged association study, a total of 9,757 patients with GD and 10,626 sex-matched controls were recruited from Chinese Han population. Illumina Human660-Quad BeadChips in the discovery stage and TaqMan SNP Genotyping Assays in the replication stage were used for genotyping. Trend test and logistic regression analysis were performed in this association study.
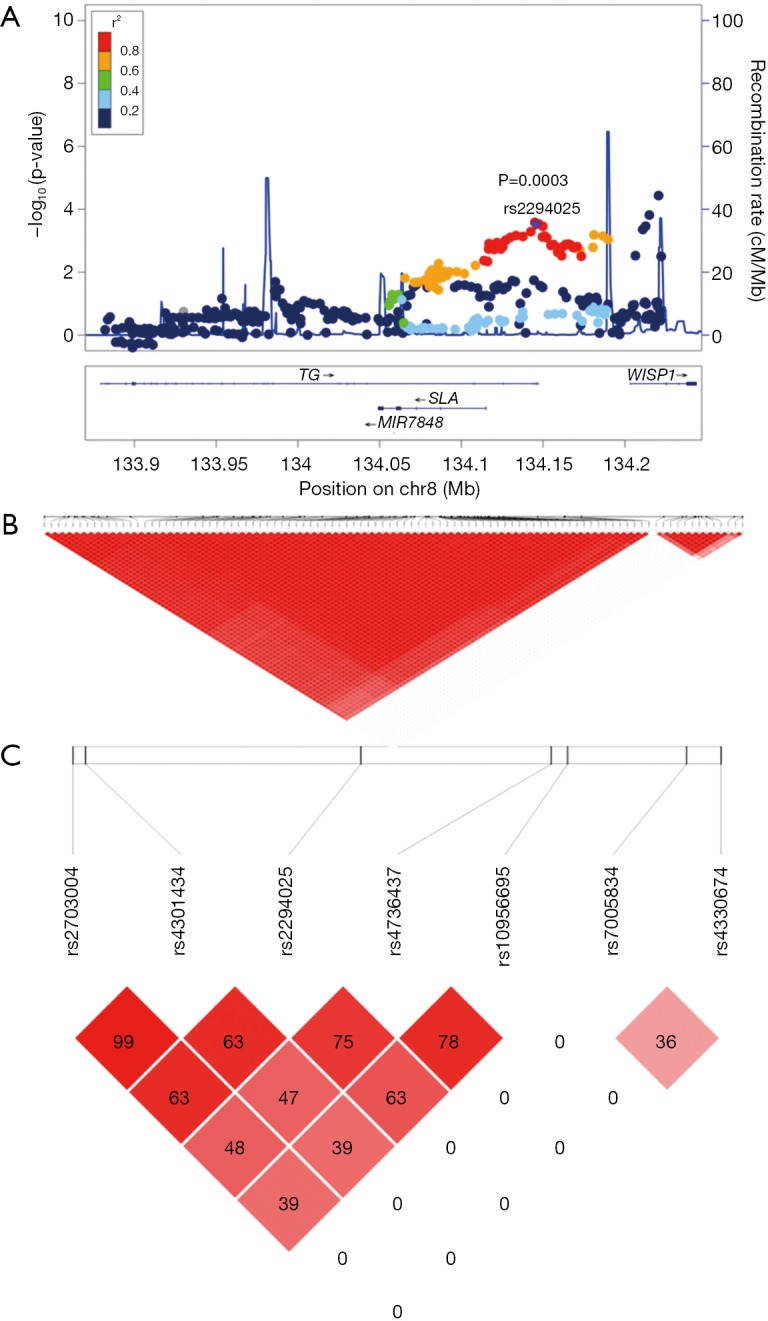
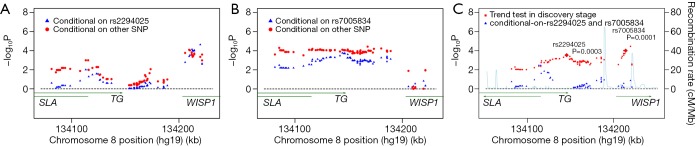
Results: In the discovery stage, rs2294025 and rs7005834 were the most highly associated susceptibility loci with GD in TG. In the replication phase, 7 SNPs, including rs2294025 and rs7005834, were selected for fine-mapping. Finally, we confirmed that rs2294025 and rs7005834 were the independent risk loci of GD in the combined populations. At the same time, there was no significant difference between the risk allele frequencies of rs2294025 and rs7005834 in different clinical phenotypes of GD.
Conclusions: The fine mapping study of thyroglobulin identified two independent SNPs (rs2294025 and rs7005834) for GD susceptibility. However, no significant differences for rs2294025 and rs7005834 were observed, between the different clinical phenotypes of GD, including gender, Graves' ophthalmopathy (GO), and serum levels of thyrotropin receptor antibody, thyroid peroxidase antibody, and thyroglobulin antibody. These results provide a deeper understanding of the association mechanism of thyroglobulin and GD risk.
Keywords: Graves’ disease (GD); Thyroglobulin; single nucleotide polymorphism (SNP).
2019 Annals of Translational Medicine. All rights reserved.
Conflict of interest statement
Conflicts of Interest: The authors have no conflicts of interest to declare.
Figures
Similar articles
-
Refined association of TSH receptor susceptibility locus to Graves' disease in the Chinese Han population.Eur J Endocrinol. 2014 Jan 1;170(1):109-19. doi: 10.1530/EJE-13-0517. Print 2014 Jan. Eur J Endocrinol. 2014. PMID: 24144966
-
A dense mapping study of six European AITD susceptibility regions in a large Chinese Han Cohort of Graves' disease.Clin Endocrinol (Oxf). 2018 Dec;89(6):840-848. doi: 10.1111/cen.13847. Epub 2018 Oct 1. Clin Endocrinol (Oxf). 2018. PMID: 30176063
-
The association of thyroid peroxidase antibody risk loci with susceptibility to and phenotype of Graves' disease.Clin Endocrinol (Oxf). 2015 Oct;83(4):556-62. doi: 10.1111/cen.12640. Epub 2014 Dec 22. Clin Endocrinol (Oxf). 2015. PMID: 25345847
-
Gene Map of the HLA Region, Graves' Disease and Hashimoto Thyroiditis, and Hematopoietic Stem Cell Transplantation.Adv Immunol. 2016;129:175-249. doi: 10.1016/bs.ai.2015.08.003. Epub 2015 Dec 1. Adv Immunol. 2016. PMID: 26791860 Review.
-
The Role of the Microbiota in Graves' Disease and Graves' Orbitopathy.Front Cell Infect Microbiol. 2021 Dec 22;11:739707. doi: 10.3389/fcimb.2021.739707. eCollection 2021. Front Cell Infect Microbiol. 2021. PMID: 35004341 Free PMC article. Review.
Cited by
-
Genetics, Epigenetics, Cellular Immunology, and Gut Microbiota: Emerging Links With Graves' Disease.Front Cell Dev Biol. 2022 Jan 4;9:794912. doi: 10.3389/fcell.2021.794912. eCollection 2021. Front Cell Dev Biol. 2022. PMID: 35059400 Free PMC article. Review.
References
-
- Weetman AP, McGregor AM. Autoimmune thyroid disease: further developments in our understanding. Endocr Rev 1994;15:788-830. - PubMed
-
- Brix TH, Kyvik KO, Christensen K, et al. Evidence for a major role of heredity in Graves' disease: a population-based study of two Danish twin cohorts. J Clin Endocrinol Metab 2001;86:930-4. - PubMed
LinkOut - more resources
Full Text Sources
Miscellaneous