. 2019 Oct 29:2:394.
doi: 10.1038/s42003-019-0641-x. eCollection 2019.

FRET-based cyclic GMP biosensors measure low cGMP concentrations in cardiomyocytes and neurons

Affiliations

FRET-based cyclic GMP biosensors measure low cGMP concentrations in cardiomyocytes and neurons

Gaia Calamera et al. Commun Biol. .

Abstract

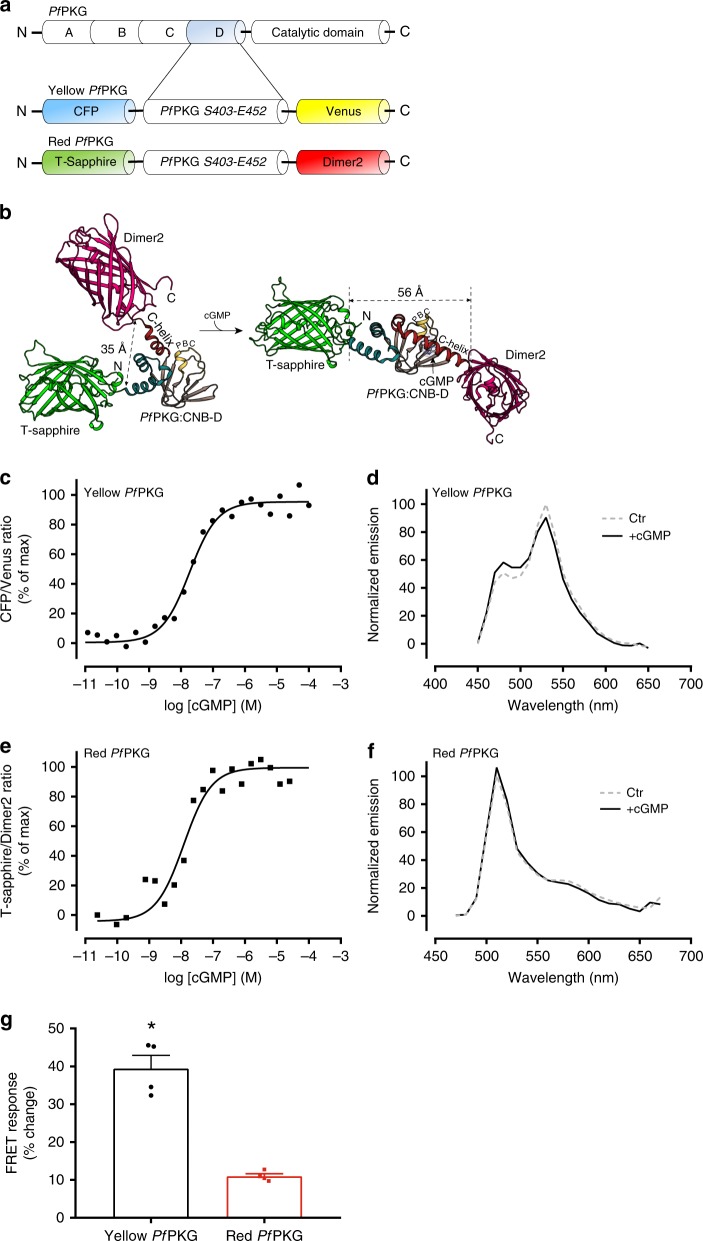
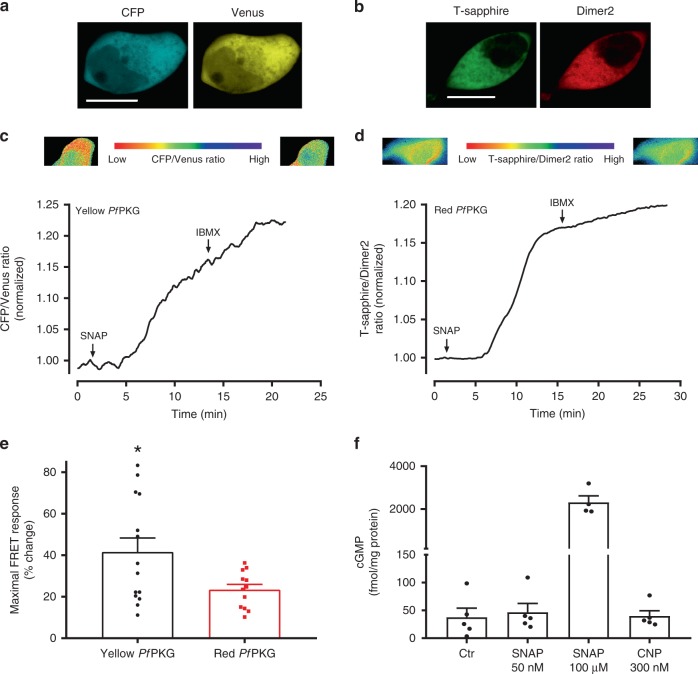
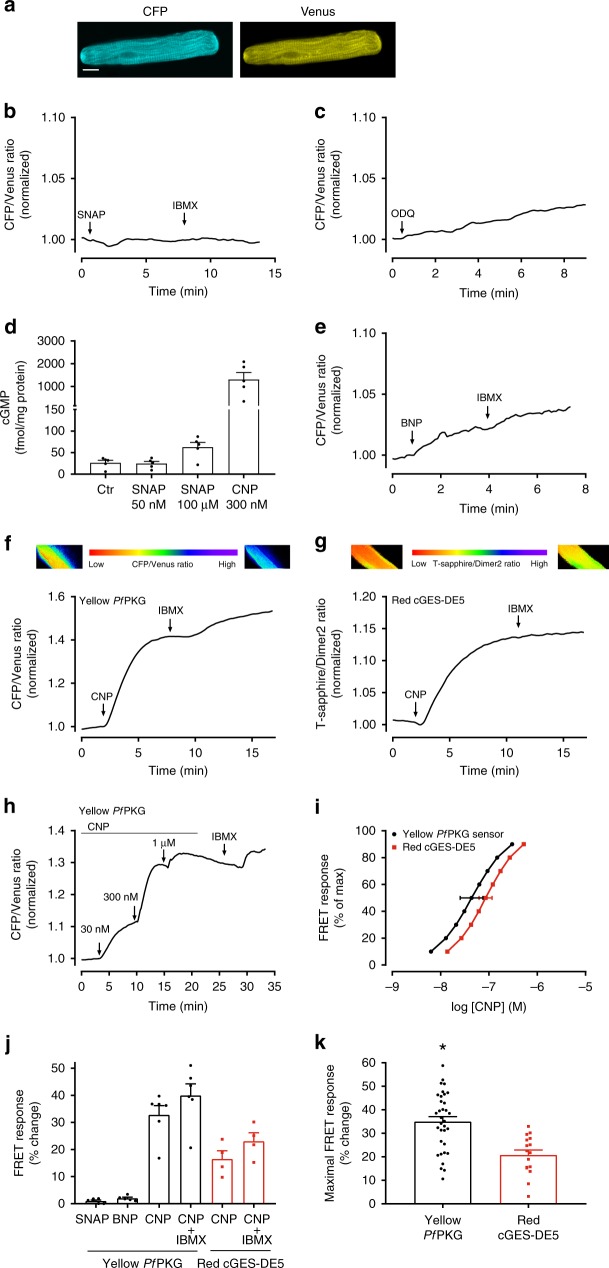
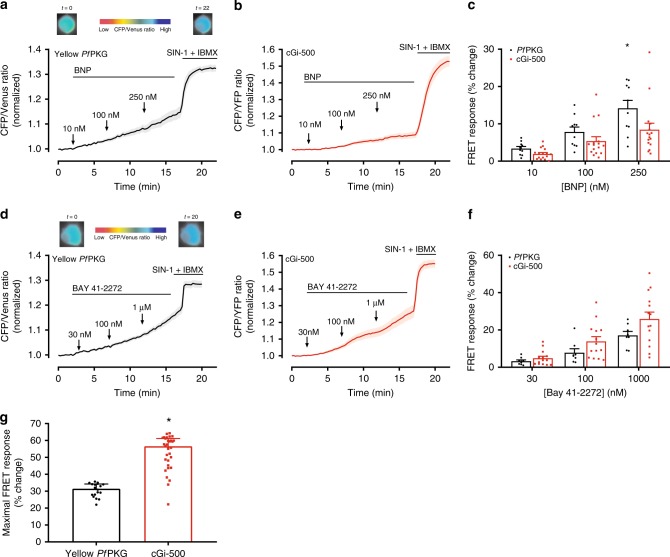
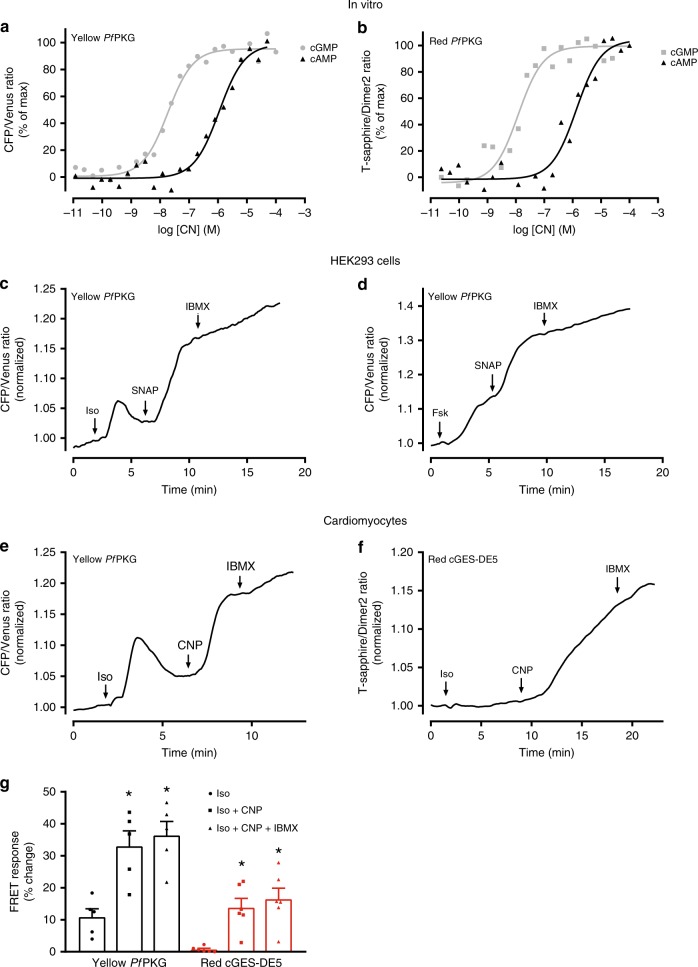
Several FRET (fluorescence resonance energy transfer)-based biosensors for intracellular detection of cyclic nucleotides have been designed in the past decade. However, few such biosensors are available for cGMP, and even fewer that detect low nanomolar cGMP concentrations. Our aim was to develop a FRET-based cGMP biosensor with high affinity for cGMP as a tool for intracellular signaling studies. We used the carboxyl-terminal cyclic nucleotide binding domain of Plasmodium falciparum cGMP-dependent protein kinase (PKG) flanked by different FRET pairs to generate two cGMP biosensors (Yellow PfPKG and Red PfPKG). Here, we report that these cGMP biosensors display high affinity for cGMP (EC50 of 23 ± 3 nM) and detect cGMP produced through soluble guanylyl cyclase and guanylyl cyclase A in stellate ganglion neurons and guanylyl cyclase B in cardiomyocytes. These biosensors are therefore optimal tools for real-time measurements of low concentrations of cGMP in living cells.

Keywords: Cell signalling; Cellular imaging; Fluorescent proteins; Membrane proteins.


Conflict of interest statement

Competing interestsThe authors have no competing interests to declare.

Figures

Fig. 1
Fig. 1
Development of PfPKG FRET biosensors for cGMP. a Schematic of the PfPKG and the Yellow and Red PfPKG biosensors. b The Red PfPKG biosensor with the indicated conformational change upon cGMP binding. The D-domain of Plasmodium falciparum PKG (PfPKG) is from S403 to E542 (PDB:4OFF and 4OFG; absence and presence of cGMP, respectively), T-sapphire (GFP) is from PDB:1GFL, Dimer2 (DsRed) is from PDB:1G7K. Similar structures would be expected from the Yellow PfPKG. c, e Homogenates of HEK293 cells transfected with Yellow PfPKG biosensor or Red PfPKG biosensor (where indicated) were incubated with increasing concentrations of cGMP and FRET, displayed as FCFP/FVenus (Yellow PfPKG) and FT-Sapphire/FDimer2 (Red PfPKG) ratios, was measured as described in Materials and Methods and normalized to the minimum (absence of cGMP) and maximum (highest cGMP concentration). Shown are data from one representative of four independent experiments. d, f Emission spectra of the indicated biosensors from HEK293 homogenates incubated with (solid line) and without (dashed line) 100 µM cGMP and excited at 405nm. The emission spectra were normalized to maximum fluorescence in the absence of cGMP. g Maximal FRET response at the highest cGMP concentration. Data are mean ± SEM of four independent experiments. *p = 0.0002 vs. Red PfPKG (Two-tailed Student’s t test)
Fig. 2
Fig. 2
PfPKG biosensors detect sGC-stimulated cGMP increase in HEK293 cells. a Confocal images of living HEK293 cells expressing the Yellow PfPKG biosensor. Scale bar: 10 µm. b Confocal images of living HEK293 cells expressing the Red PfPKG biosensor. Scale bar: 10 µm. c, d Recording of FRET ratio between CFP and Venus (c) or T-sapphire and Dimer2 (d) in single HEK293 cells expressing the indicated biosensor and stimulated with the NO donor SNAP (50 nM) and the PDE inhibitor IBMX (100 µM), where indicated. FRET was normalized to that prior to stimulation. Shown are traces representative of four (Yellow PfPKG) and five (Red PfPKG) individual cells. Pseudocolour images show CFP/Venus and Tsapphire/Dimer2 ratios at the start and end of experiment. e Maximal FRET response at the saturating stimulation (SNAP + IBMX). Data are mean ± SEM from 14 (Yellow PfPKG) and 12 (Red PfPKG) cells. *p = 0.027 vs. Red PfPKG (Two-tailed Student’s t test). f cGMP levels in HEK293 cells in the absence (Ctr) or presence of 50 nM or 100 µM SNAP (10 min stimulation). Data are mean ± SEM from 4 to 5 individual experiments
Fig. 3
Fig. 3
Yellow PfPKG biosensor monitors cGMP from GC-A and GC-B in cardiomyocytes. a Confocal images of a living cardiomyocyte expressing the Yellow PfPKG biosensor. Scale bar: 10 µm. b, c, e, f Recording of FRET ratio (CFP/Venus) in single cardiomyocytes expressing the Yellow PfPKG biosensor and stimulated with the NO donor SNAP (100 μM), the PDE inhibitor IBMX (100 µM), the sGC inhibitor ODQ (10 μM), BNP (300 nM) or CNP (300 nM), where indicated. FRET signal was normalized to that at the time of stimulation. Shown are traces representative of six cells from four animals (SNAP), eight cells from four animals (ODQ), five cells from four animals (BNP) or six cells from six animals (CNP). d Total cGMP levels in isolated ventricular cardiomyocytes in the absence (Ctr) or presence of 50 nM SNAP, 100 µM SNAP or 300 nM CNP (10 min stimulation). Data are mean ± SEM from five individual experiments. g Recording of FRET ratio (T-sapphire/Dimer2) in single cardiomyocytes expressing the Red cGES-DE5 biosensor and stimulated with CNP (300 nM) and IBMX (100 µM) (where indicated). FRET was normalized to that prior to stimulation. Shown are traces representative of four cells from four animals. h Recording of FRET ratio (CFP/Venus) in single cardiomyocytes expressing the Yellow PfPKG biosensor stimulated with increasing concentrations of CNP. Shown are traces representative of nine individual cells from five animals normalized to that prior to stimulation. i Concentration–response curves generated by stimulation with increasing concentrations of CNP in single cardiomyocytes expressing the indicated biosensor. Data are plotted as centiles and for the EC50 the mean ± SEM is indicated (nine cells from five animals for the Yellow PfPKG, six cells from six animals for the Red cGES-DE5). p = 0.37 (unpaired t-test). j Quantification of FRET responses shown in b, c, and e–g. p = 0.006 for CNP-stimulation for PfPKG vs. Red cGES-DE5 (one-way ANOVA with Sidak’s multiple comparisons test). k Maximal FRET response (CNP+IBMX) from cardiomyocytes expressing the indicated biosensor. Data are mean ± SEM from 34 cells from 27 animals (Yellow PfPKG) and 16 cells from 10 animals (Red cGES-DE5). *p = 0.0001 vs. Red cGES-DE5 (Two-tailed Student`s t test)
Fig. 4
Fig. 4
Yellow PfPKG detects low cGMP from GC-A stimulation in stellate ganglion neurons. a, b, d, e Recording of FRET ratio (CFP/Venus for PfPKG, CFP/YFP for cGi-500) in single stellate ganglion neurons expressing the indicated biosensors and stimulated with either the GC-A agonist BNP or the sGC activator BAY 41-2272 at increasing concentrations. The responses were then maximized by stimulating with SIN-1 (20 µM) and IBMX (100 µM). FRET signal was normalized to that prior to stimulation. Traces are mean ± SEM from 10 (PfPKG) and 16 cells (cGi-500) in (a) and (b) and eight (PfPKG) and 14 cells (cGi-500) in (d) and (e). c, f Quantification of FRET responses in (a), (b), (d), and (e). Data are mean ± SEM. *p = 0.012 cGi-500 vs. PfPKG for BNP (250 nM) (Two-way ANOVA assuming sphericity with Sidak’s multiple comparisons test). g Maximal FRET response at the saturating stimulation (SIN-1 20 µM+IBMX 100 µM). Data are median with interquartile range from 18 (PfPKG) and 31 (cGi-500) cells. *p < 0.0001 vs. PfPKG biosensor (Two-tailed Mann–Whitney test)
Fig. 5
Fig. 5
PfPKG biosensors display 100-fold selectivity of cGMP over cAMP. a, b Homogenate of HEK293 cells transfected with Yellow PfPKG biosensor (a) or Red PfPKG biosensor (b), incubated with IBMX (100 µM) and increasing concentrations of cAMP (black). Corresponding data for cGMP (gray) from Figs. 1c, 1e are included for direct comparison. FRET was measured as described in Materials and Methods and normalized to the minimum (absence of CN) and maximum (highest CN concentration). Data shown are representative of four independent experiments. c, d Recording of FRET ratio (CFP/Venus) in single HEK293 cells expressing the Yellow PfPKG biosensor and stimulated with isoprenaline (Iso; 10 µM) or the AC activator forskolin (Fsk; 25 μM) followed by SNAP (50 nM) and IBMX (100 µM). FRET signal was normalized to that prior to first stimulation. Data shown are representative of five (Iso-SNAP-IBMX) and five (Fsk-SNAP-IBMX) independent experiments. e, f Recording of FRET ratio in single cardiomyocytes expressing the indicated biosensor and stimulated with Iso (10 nM), followed by CNP (300  nM) and IBMX (100 µM). FRET signal was normalized to that prior to first stimulation. Data are representative of five cells from four animals (e) and six cells from four animals (f). g Quantification of data in e-f. Data are mean ± SEM. *p < 0.05 vs. “Iso” (two-way ANOVA with Tukey post hoc test)

Similar articles

Cited by

References

    1. McMurray JJ, Packer M, Solomon SD. Neprilysin inhibition for heart failure. N. Engl. J. Med. 2014;371:2336–2337. doi: 10.1056/NEJMoa1409077. - DOI - PubMed
    1. Ghofrani H-A, et al. Riociguat for the treatment of pulmonary arterial hypertension. N. Engl. J. Med. 2013;369:330–340. doi: 10.1056/NEJMoa1209655. - DOI - PubMed
    1. Lewis GD, et al. Sildenafil improves coronary artery patency in a canine model of platelet-mediated cyclic coronary occlusion after thrombolysis. J. Am. Coll. Cardiol. 2006;47:1471–1477. doi: 10.1016/j.jacc.2005.11.060. - DOI - PubMed
    1. Lee DI, et al. Phosphodiesterase 9A controls nitric-oxide-independent cGMP and hypertrophic heart disease. Nature. 2015;519:472–476. doi: 10.1038/nature14332. - DOI - PMC - PubMed
    1. Baliga RS, et al. Phosphodiesterase 2 inhibition preferentially promotes NO/guanylyl cyclase/cGMP signaling to reverse the development of heart failure. Proc. Natl Acad. Sci. 2018;115:E7428–E7437. doi: 10.1073/pnas.1800996115. - DOI - PMC - PubMed

Publication types

MeSH terms