. 2020 Apr;72(4):598-608.
doi: 10.1002/art.41161. Epub 2020 Mar 12.

Multiparameter Analysis Identifies Heterogeneity in Knee Osteoarthritis Synovial Responses

Affiliations

Multiparameter Analysis Identifies Heterogeneity in Knee Osteoarthritis Synovial Responses

Hannah Labinsky et al. Arthritis Rheumatol. 2020 Apr.

Abstract

Objective: Synovial membrane inflammation is common in osteoarthritis (OA) and increases cartilage injury. However, synovial fluid and histology studies suggest that OA inflammatory responses are not homogeneous. Greater understanding of these responses may provide new insights into OA disease mechanisms. We undertook this study to develop a novel multiparameter approach to phenotype synovial responses in knee OA.

Methods: Cell composition and soluble protein production were measured by flow cytometry and multiplex enzyme-linked immunosorbent assay in synovium collected from OA patients undergoing knee replacement surgery (n = 35).

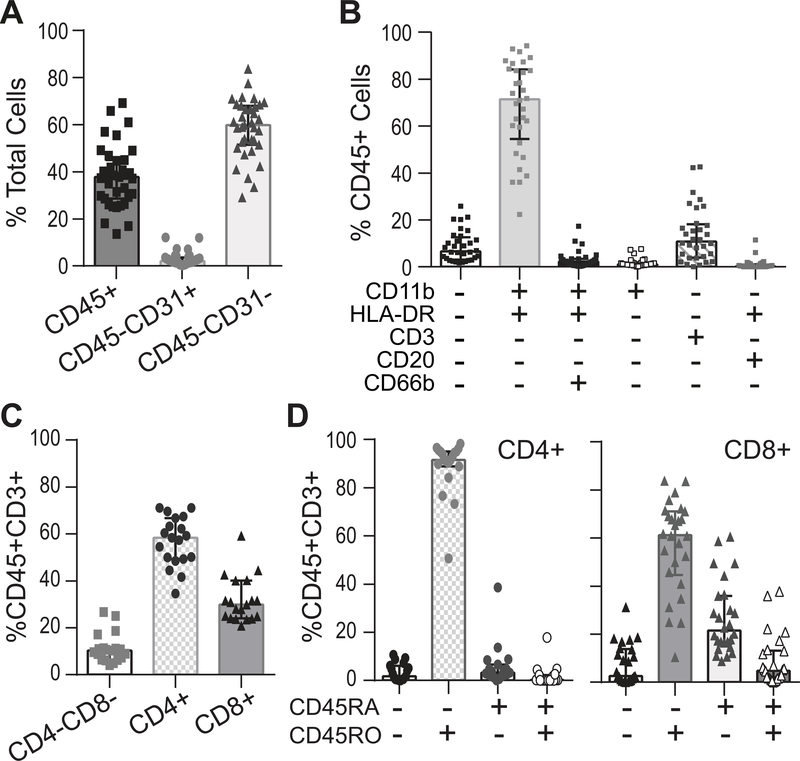
Results: Testing disaggregation conditions showed that aggressive digestion improved synovial cell yield and mesenchymal staining by flow cytometry, but it negatively impacted CD4+ T cell and CD56+ natural killer cell staining. Less aggressive digestion preserved these markers and showed highly variable T cell infiltration (range 0-43%; n = 32). Correlation analysis identified mesenchymal subpopulations associated with different nonmesenchymal populations, including macrophages and T cells (CD45+CD11b+HLA-DR+ myeloid cells with PDPN+CD73+CD90-CD34- mesenchymal cells [r = 0.65, P < 0.0001]; and CD45+CD3+ T cells with PDPN+CD73+CD90+CD34+ mesenchymal cells [r = 0.50, P = 0.003]). Interleukin-6 (IL-6) measured by flow cytometry strongly correlated with IL-6 released by ex vivo culture of synovial tissue (r = 0.59, P = 0.0012) and was highest in mesenchymal cells coexpressing CD90 and CD34. IL-6, IL-8, complement factor D, and IL-10 release correlated positively with tissue cellularity (P = 0.0042, P = 0.018, P = 0.0012, and P = 0.038, respectively). Additionally, increased CD8+ T cell numbers correlated with retinol binding protein 4 (P = 0.033). Finally, combining flow cytometry and multiplex data identified patient clusters with different types of inflammatory responses.

Conclusion: We used a novel approach to analyze OA synovium, identifying patient-specific inflammatory clusters. Our findings indicate that phenotyping synovial inflammation may provide new insights into OA patient heterogeneity and biomarker development.


Figures

Figure 1.
Figure 1.. Influence of digestion conditions on synovial cell yield.
(A) Experimental approach summarized. Briefly, fresh OA synovial samples (~100 mg) were cultured overnight. Media from three samples were analyzed for soluble mediator release using a multi-analyte, flow-based ELISA. Independent samples were cultured with the protein transport inhibitor monensin prior to disaggregation for surface marker and intracellular IL-6 analysis by flow cytometry (12 samples/digestion). (B) Summary of digestion conditions tested for synovial disaggregation. (C) Mean cell yield/g tissue for each digestion condition was determined by manual counting. (D) Mean hematopoietic immune (CD45+), endothelial (CD45CD31+) and mesenchymal (CD45CD31) cell number was calculated for each digestion condition by multiplying total cell yield by the cell percentage measured by flow cytometry. (E) The percent of CD45+, CD45CD31+, and CD31CD45 cells released by digestion condition is shown. (C-E) Statistics: Mean with standard deviation shown (n=4–5). Statistically significant differences across digestion conditions were assessed by parametric repeated measures ANOVA. P values not shown are greater than 0.2.
Figure 2.
Figure 2.. Optimization of disaggregation for ex vivo tissue flow cytometry.
Representative (A) CD4/CD8 (pre-gate: CD45+CD3+CD11bCD20) or (B) NK (pre-gate CD45+CD3CD11bCD20) cell staining after digested by different conditions (one donor): 1-collagenase+800 μg/ml (high) dispase; 3-collagenase+8 μg/ml (low) dispase; 4-Liberase™ 30 minutes; and 6-collagenase only. Recovery of (C) CD4+ T cells or (D) NK cell subsets was compared between digestion protocols by normalizing cell percentage or MFI to the highest expressing condition. CD4+ T cells normalized to condition 6 (%CD4+ left y-axis/grey bars; CD4 MFI right y-axis/patterned bars). NK cells normalized to condition 4 (%CD16+CD56dim left y-axis/grey bars; CD16dim/−CD56high right y-axis/striped bars). (E) Representative podoplanin (PDPN), CD146, CD34, CD73, and CD90 staining on mesenchymal (pre-gate CD45CD31) cells isolated from one donor synovium after high dispase (condition 1) or short Liberase™ (condition 4) digestion. (F) Relative recovery of CD146+ (upper), CD34+ (middle) and CD73+ (lower) mesenchymal cells was compared between digestion protocols by normalizing cell percentage for each condition to the condition 1. (C, D, F) Statistics: Mean and standard deviation are shown (n=3–5). Statistically significant differences from the indicated condition were calculated by repeated measures ANOVA with Dunnet’s test for multiple comparisons. P values as follows: * p≤0.05, **p≤0.01. ***p≤0.001, ****p≤0.0001.
Figure 3.
Figure 3.. Hematopoietic immune cell analysis shows wide patient variability in T cell accumulation.
(A) Percentage of hematopoietic immune (CD45+), endothelial (CD45CD31+) and mesenchymal (CD45CD31) cells in OA synovium were measured by flow cytometry (n=35. digestion condition 1-high dispase). (B) Percentage of different hematopoietic immune (CD45+) cell populations was determined by surface expression of myeloid (CD11b, HLA-DR), T cell (CD3), B cell (CD20), and neutrophil (CD66b) markers (n=32; digestion condition 1). (C) The percentage of CD4+ helper and CD8+ cytotoxic T cells is shown (n=19, gate CD45+CD3+, digestion condition 3-low dispase). (D) Expression of CD45RA+ (naïve) and CD45RO+ (effector/memory) expression on CD4+ (n=19) or CD8+ (n=26) cells was analyzed (digestion condition 3-low dispase). T cell analysis started using high dispase digestion (condition 1). Once it was determined that CD4 staining was not reliable, digestion was switched to low dispase (condition 3), accounting for the reduced number of donors for CD4+ cell analysis. Statistics: All plots show median and IQR.
Figure 4.
Figure 4.. Correlations between synovial fibroblast and hematopoietic immune cell populations.
(A) Mean %CD146+ vascular and CD146 non-vascular mesenchymal cells was analyzed in OA synovium after high dispase digestion (n=28). (B) CD45CD31CD146 cells were further analyzed by PDPN, CD73, CD90, and CD34 expression using tree analysis (Kaluza). Seven CD146 subsets with mean percent expression greater than 1% of total CD146 cells were identified. The %CD45CD31CD146 CD90CD34 (C, D) and %CD45CD31CD146 CD90+CD34+ (E, F) mesenchymal cells were inversely correlated with the %CD45+CD11b+CD66b- myeloid (C, E) and %CD45+CD3+ T cells (D, F) (n=28, Spearman (rs) correlation coefficient).
Figure 5.
Figure 5.. Diversity of IL-6 production in OA synovium with robust mesenchymal expression.
(A) Representative synovial hematopoietic (CD45+) and mesenchymal (CD45CD31) cell intracellular IL-6 flow cytometry staining with corresponding isotype controls. (B) IL-6 synovial tissue culture release (Adipokine Panel, LEGENDplex™, n=27, three independent samples averaged/donor) positively correlated with the total IL-6+ cell number independently calculated by flow cytometry (Spearman (rs) correlation co-efficient). (C, F, H) The percent IL-6+ cells were measured by flow cytometry in the major cell (C), CD146 mesenchymal (F), and CD45+ hematopoietic immune (H) populations. (D) IL-6+ cell number in major cell populations was calculated from the total donor cell yield. (E, G, I) IL-6 MFI was calculated by subtracting background signal (antibody isotype) from population IL-6 MFI for the major cell (E), CD146 mesenchymal (G), and CD45+ hematopoietic immune (I) populations. (J) Synovial tissue culture IL-6 release did not correlate with the adipocyte surrogates, body mass index (BMI) or leptin release. Statistics: (C-I) Kruskal-Wallis test with Dunn’s multiple comparisons test was used to assess for differences from the following reference populations: (C-E) CD45CD31, n=32; (F-G) PDPN+CD73+CD90+CD34+, n=28; and (H-I) CD11b+CD66bCD3CD20HLA-DR+, n=28. P values as listed or *p≤ 0.0001, **p<0.0006, ***p=0.007, ****p=0.004. (J) Spearman correlation analysis (n=27).
Figure 6.
Figure 6.. Correlation-based clustering using synovial soluble mediator release and cell composition reveals different OA response patterns.
(A) Diagram demonstrates the positive correlations between soluble mediator release after synovial tissue culture across multiple donors (n=27, line thickness reflects p values). No positive correlations detected with adiponectin and leptin release (Suppl. Table 4). (B) Table showing strength of correlations between the indicated cell population numbers and soluble mediators (Spearman correlation co-efficient (top number), p value (bottom number), darker shading represents higher rs values, n=19–27). (C) The data obtained from analysis of OA synovium by cellular composition (flow cytometry, italics) and soluble mediator release (multi-analyte ELISA, bold) was combined with BMI in a correlation-based hierarchical clustering algorithm to separate different OA populations (ClustVis; clustering method columns and rows: correlation; clustering distance columns and rows: Ward). Limited clinical data separated by cluster provided below the heatmap (statistics: continuous variables Kruskal-Wallis test, categorical variables Chi-square test).

References

    1. Cibrian Uhalte E, Wilkinson JM, Southam L, Zeggini E. Pathways to understanding the genomic aetiology of osteoarthritis. Hum Mol Genet. 2017;26(R2):R193–R201. - PMC - PubMed
    1. Beekhuizen M, Gierman LM, van Spil WE, Van Osch GJ, Huizinga TW, Saris DB, et al. An explorative study comparing levels of soluble mediators in control and osteoarthritic synovial fluid. Osteoarthritis Cartilage. 2013;21(7):918–22. - PubMed
    1. Knoop J, van der Leeden M, Thorstensson CA, Roorda LD, Lems WF, Knol DL, et al. Identification of phenotypes with different clinical outcomes in knee osteoarthritis: data from the Osteoarthritis Initiative. Arthritis Care Res (Hoboken). 2011;63(11):1535–42. - PubMed
    1. Oehler S, Neureiter D, Meyer-Scholten C, Aigner T. Subtyping of osteoarthritic synoviopathy. Clin Exp Rheumatol. 2002;20(5):633–40. - PubMed
    1. van Spil WE, Jansen NW, Bijlsma JW, Reijman M, DeGroot J, Welsing PM, et al. Clusters within a wide spectrum of biochemical markers for osteoarthritis: data from CHECK, a large cohort of individuals with very early symptomatic osteoarthritis. Osteoarthritis Cartilage. 2012;20(7):745–54. - PubMed

Publication types

MeSH terms