

doi: 10.1103/PhysRevLett.123.178103.
Coarse Graining, Fixed Points, and Scaling in a Large Population of Neurons
Affiliations
- PMID: 31702278
- PMCID: PMC7335427
- DOI: 10.1103/PhysRevLett.123.178103
Item in Clipboard
Coarse Graining, Fixed Points, and Scaling in a Large Population of Neurons
Phys Rev Lett.
.
Abstract
We develop a phenomenological coarse-graining procedure for activity in a large network of neurons, and apply this to recordings from a population of 1000+ cells in the hippocampus. Distributions of coarse-grained variables seem to approach a fixed non-Gaussian form, and we see evidence of scaling in both static and dynamic quantities. These results suggest that the collective behavior of the network is described by a nontrivial fixed point.
Figures
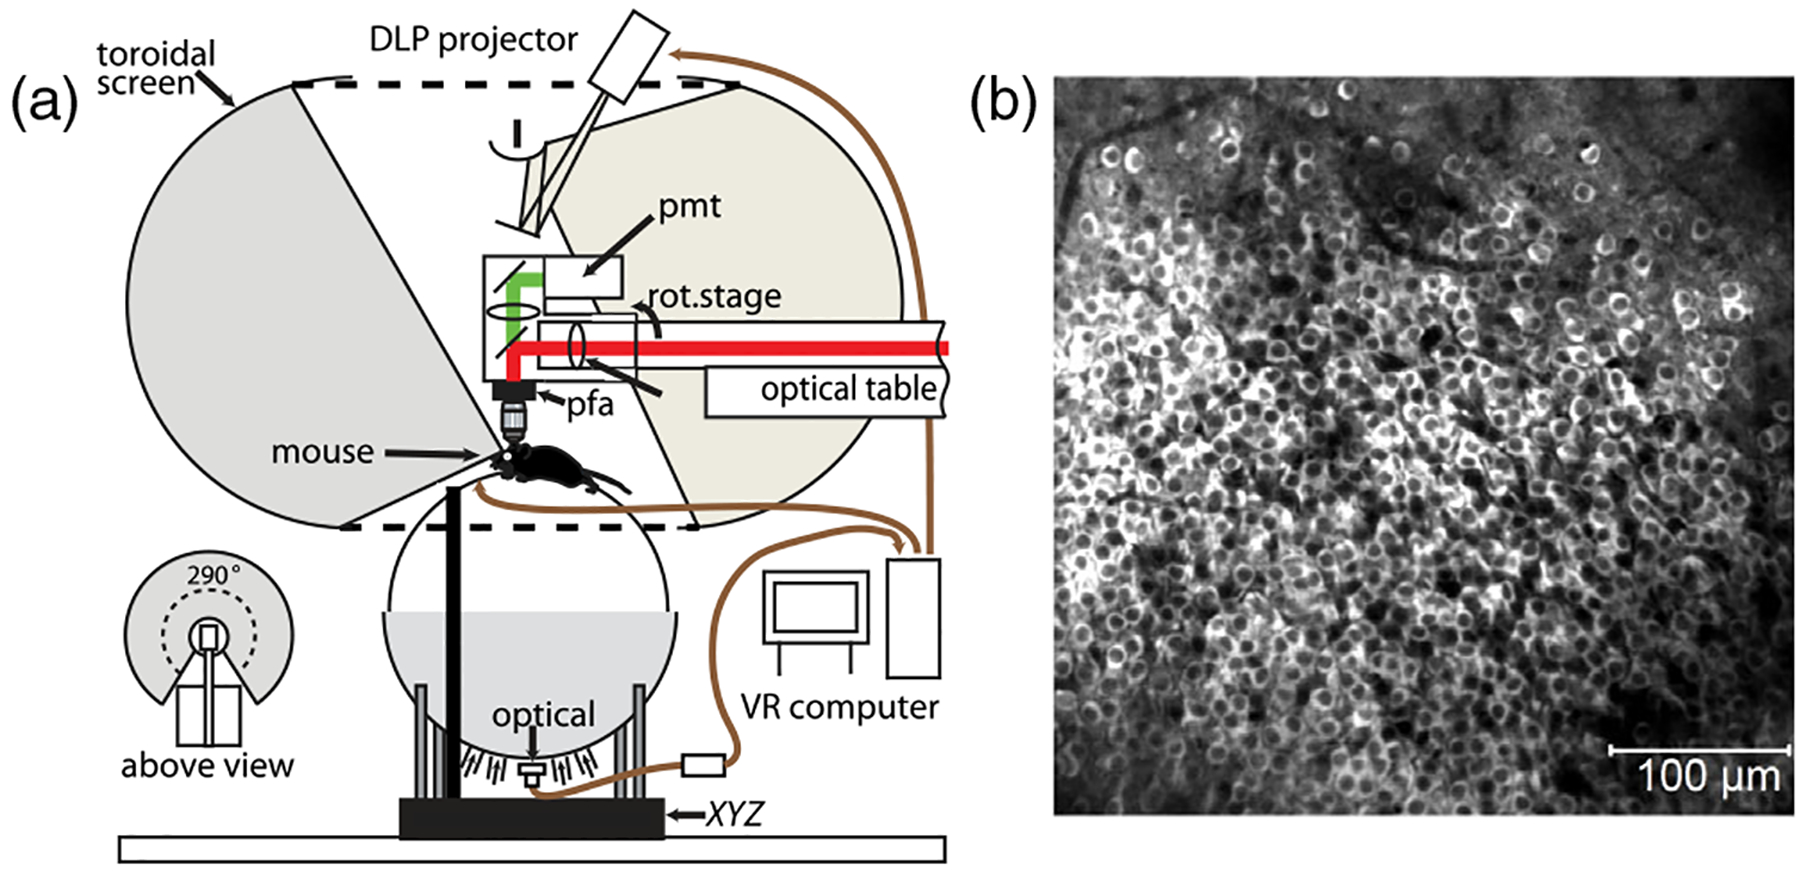
(a) Schematic of the experiment, imaging inside the brain of a mouse running on a styrofoam ball. Motion of the ball advances the position of a virtual world projected on a surrounding toroidal screen. (b) Fluorescence image of neurons in the hippocampus expressing calcium sensitive fluorescent protein.
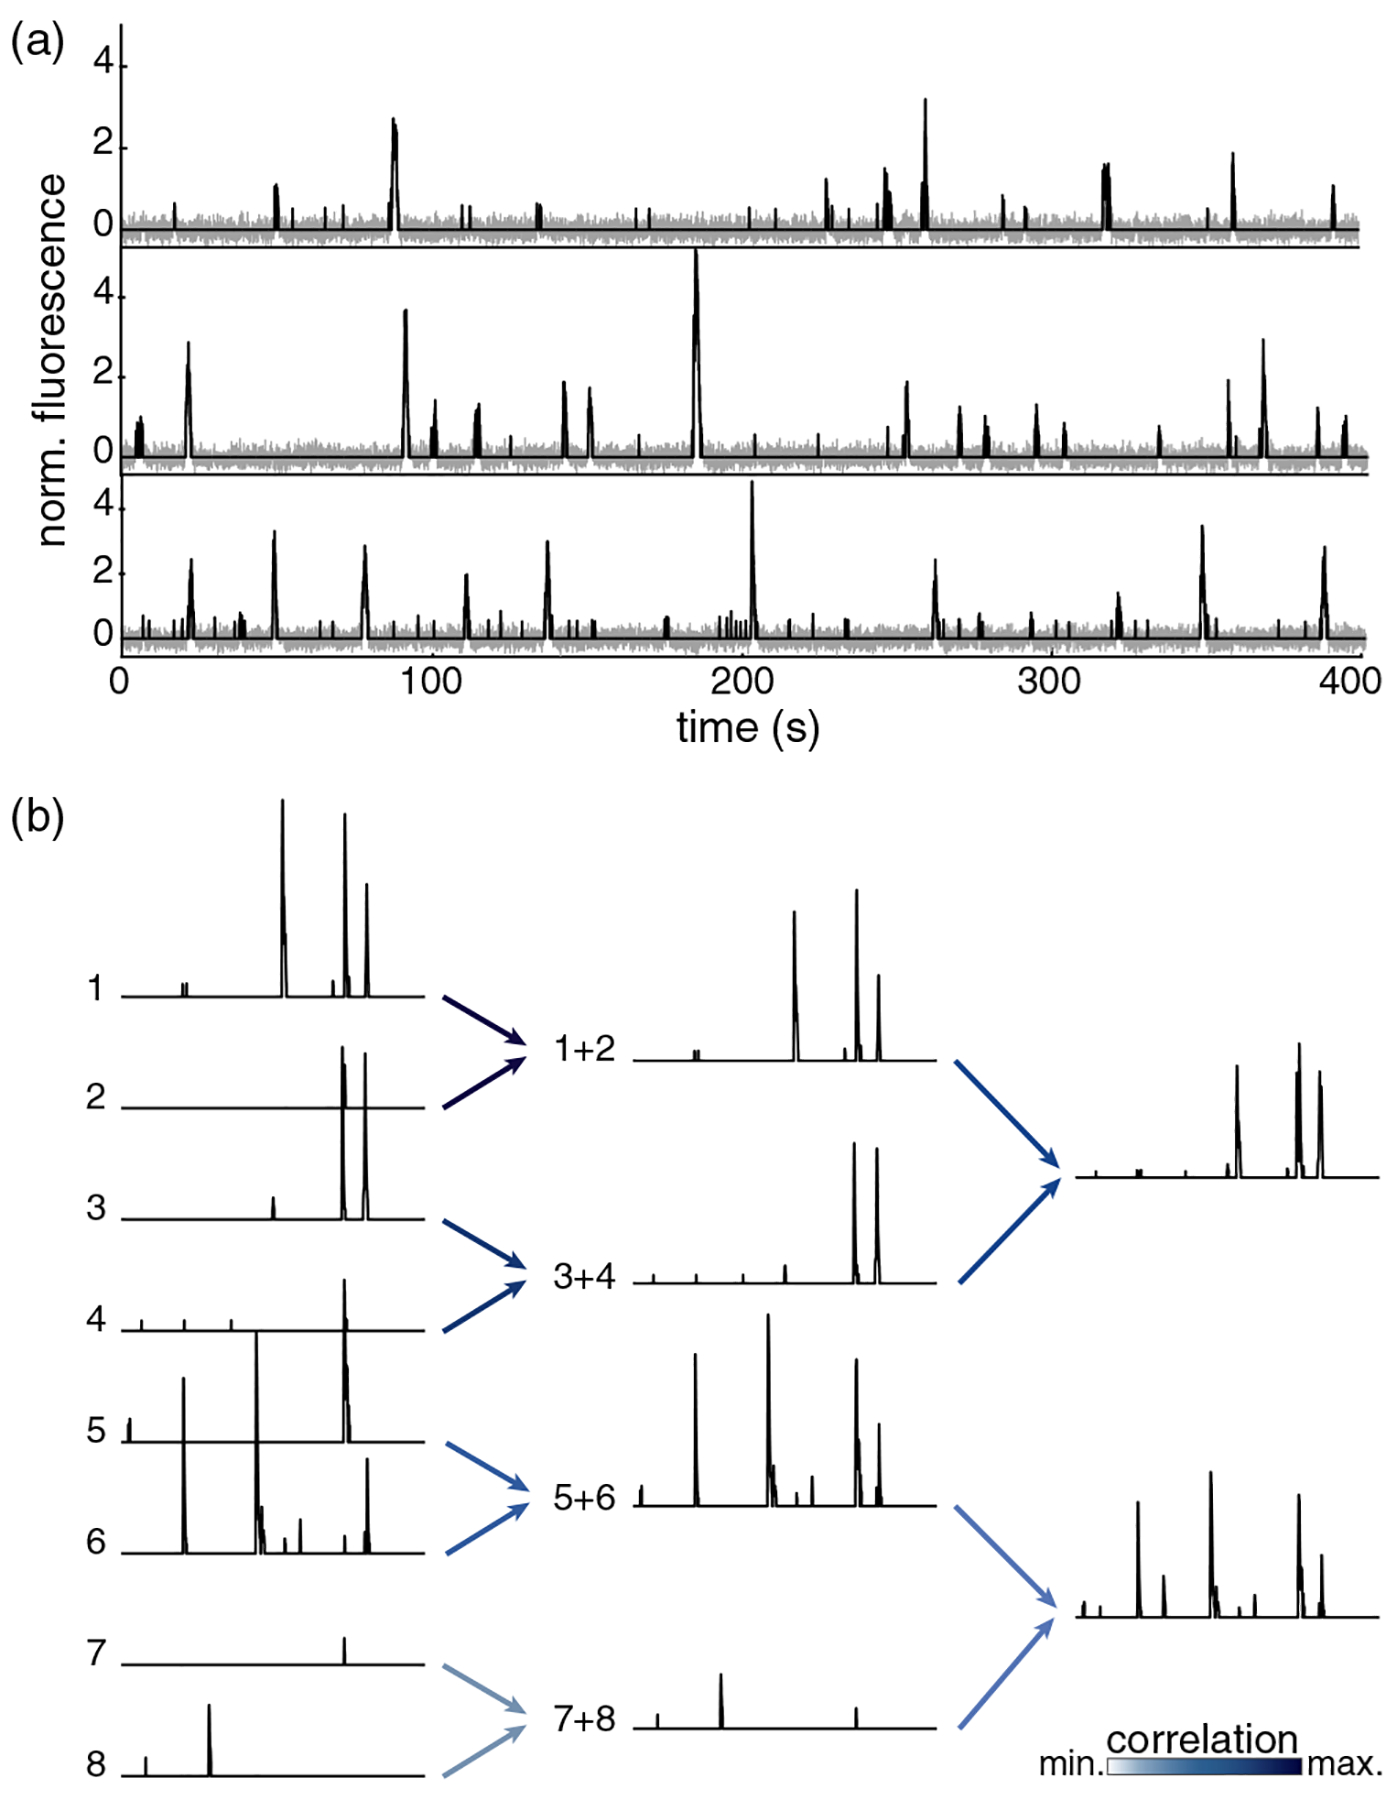
Fluorscence signals, denoising, and coarse graining. (a) Continuous fluorescence signals, raw in grey and denoised in black, for three neurons in our field of view. (b) Activity of eight example neurons. Maximally correlated pairs are grouped together by summing their activity, normalizing so the mean of nonzero values is one. Each cell can only participate in one pair, and all cells are grouped by the end of each iteration. Darker arrows correspond to stronger correlations in the pair.
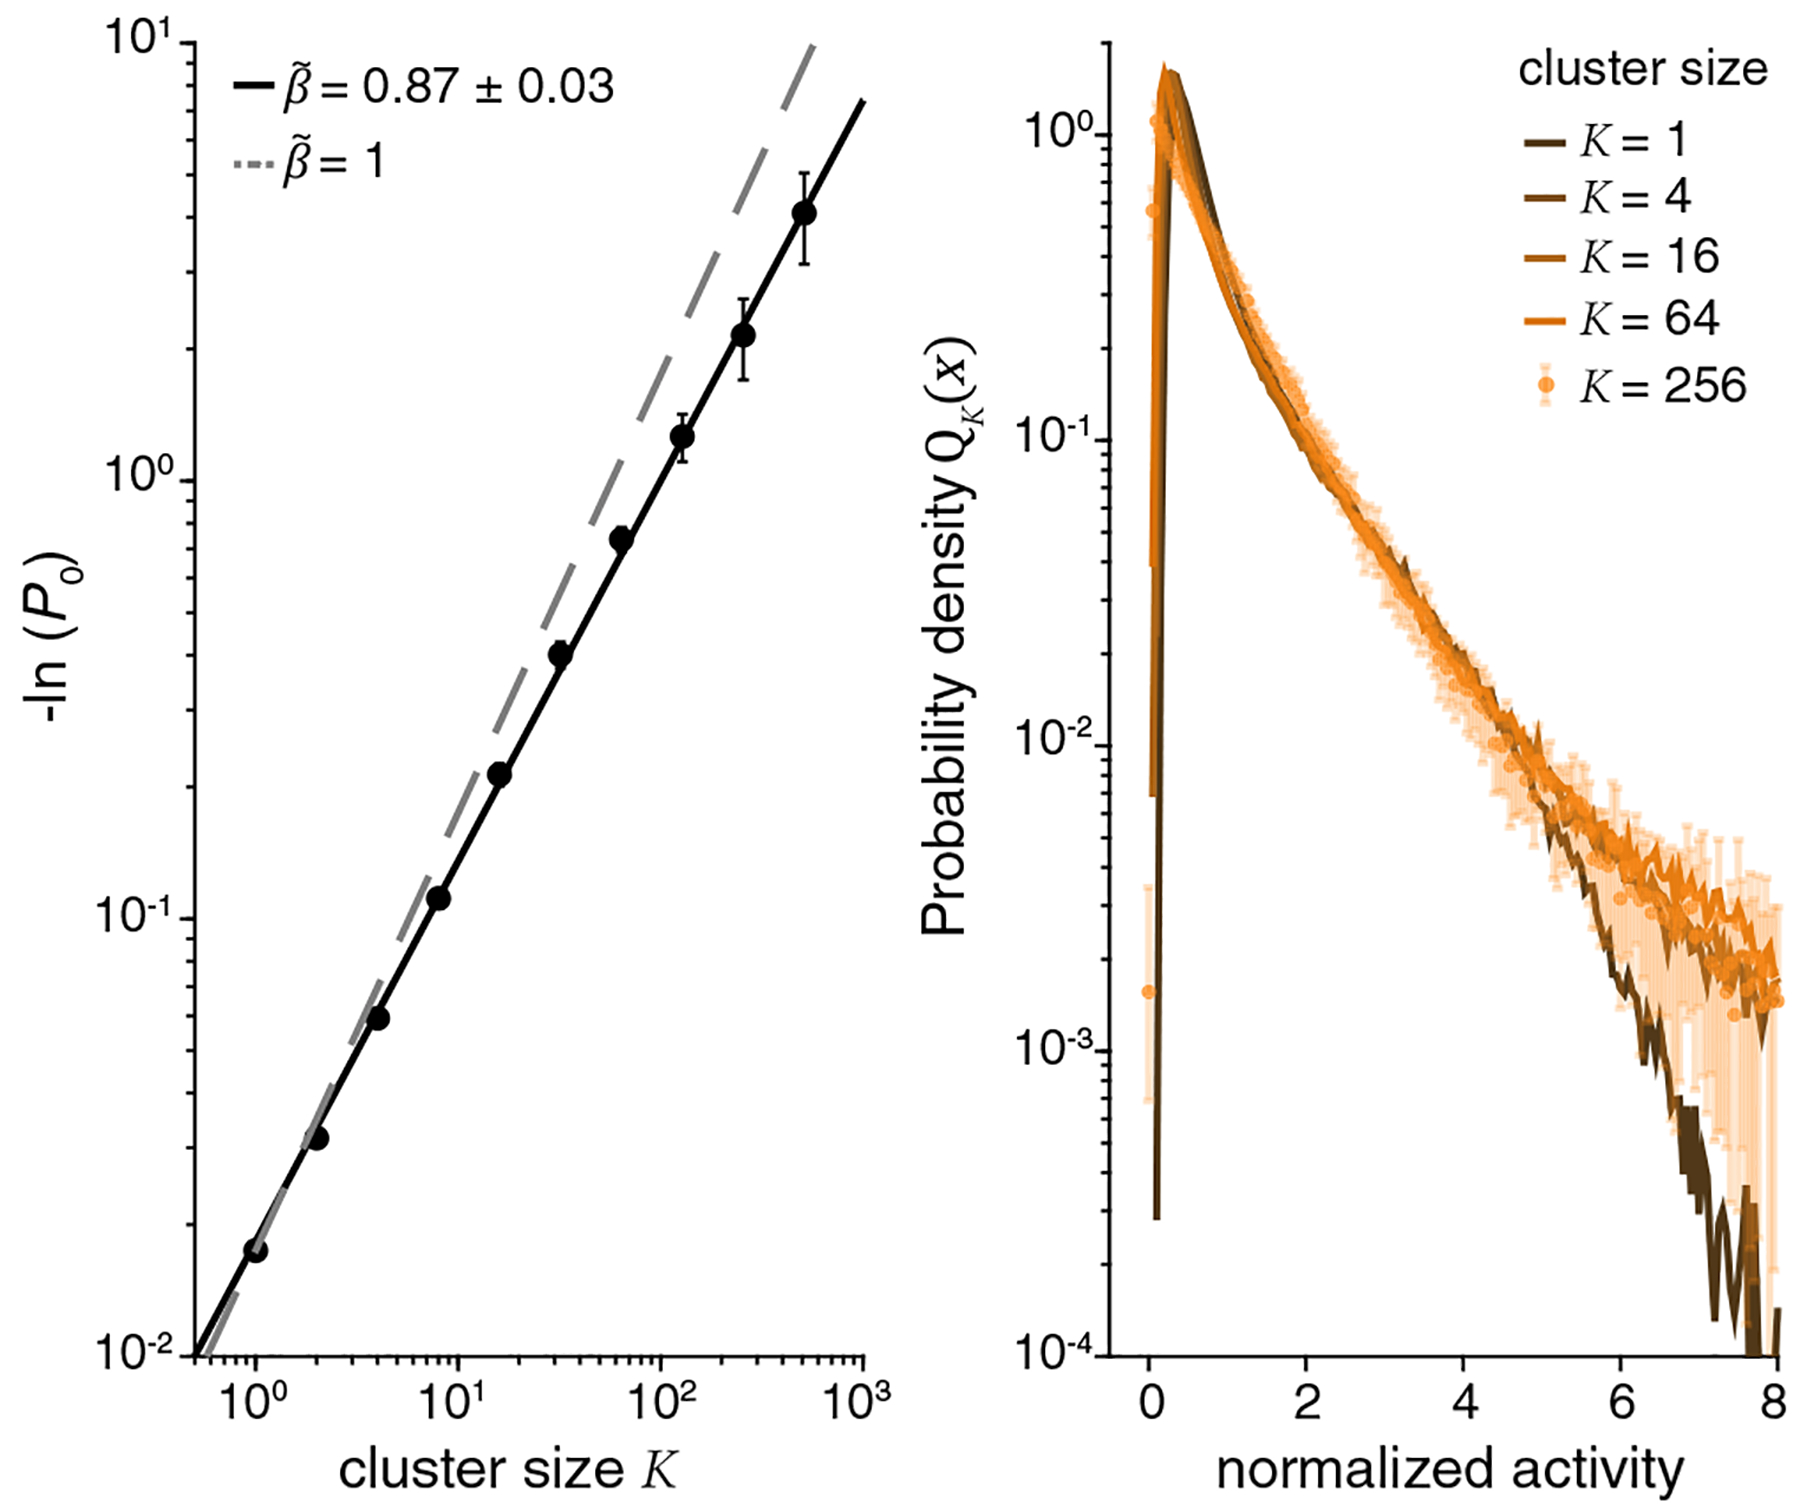
Scaling in the probabilities of silence and activity. (left) Probability of silence as a function of cluster size. Dashed line is an exponential decay , and the solid line is Eq. (5). (right) Distribution of activity at different levels of coarse graining, from Eq. (3) with normalization from Eq. (4). Larger clusters corresponds to lighter colors.
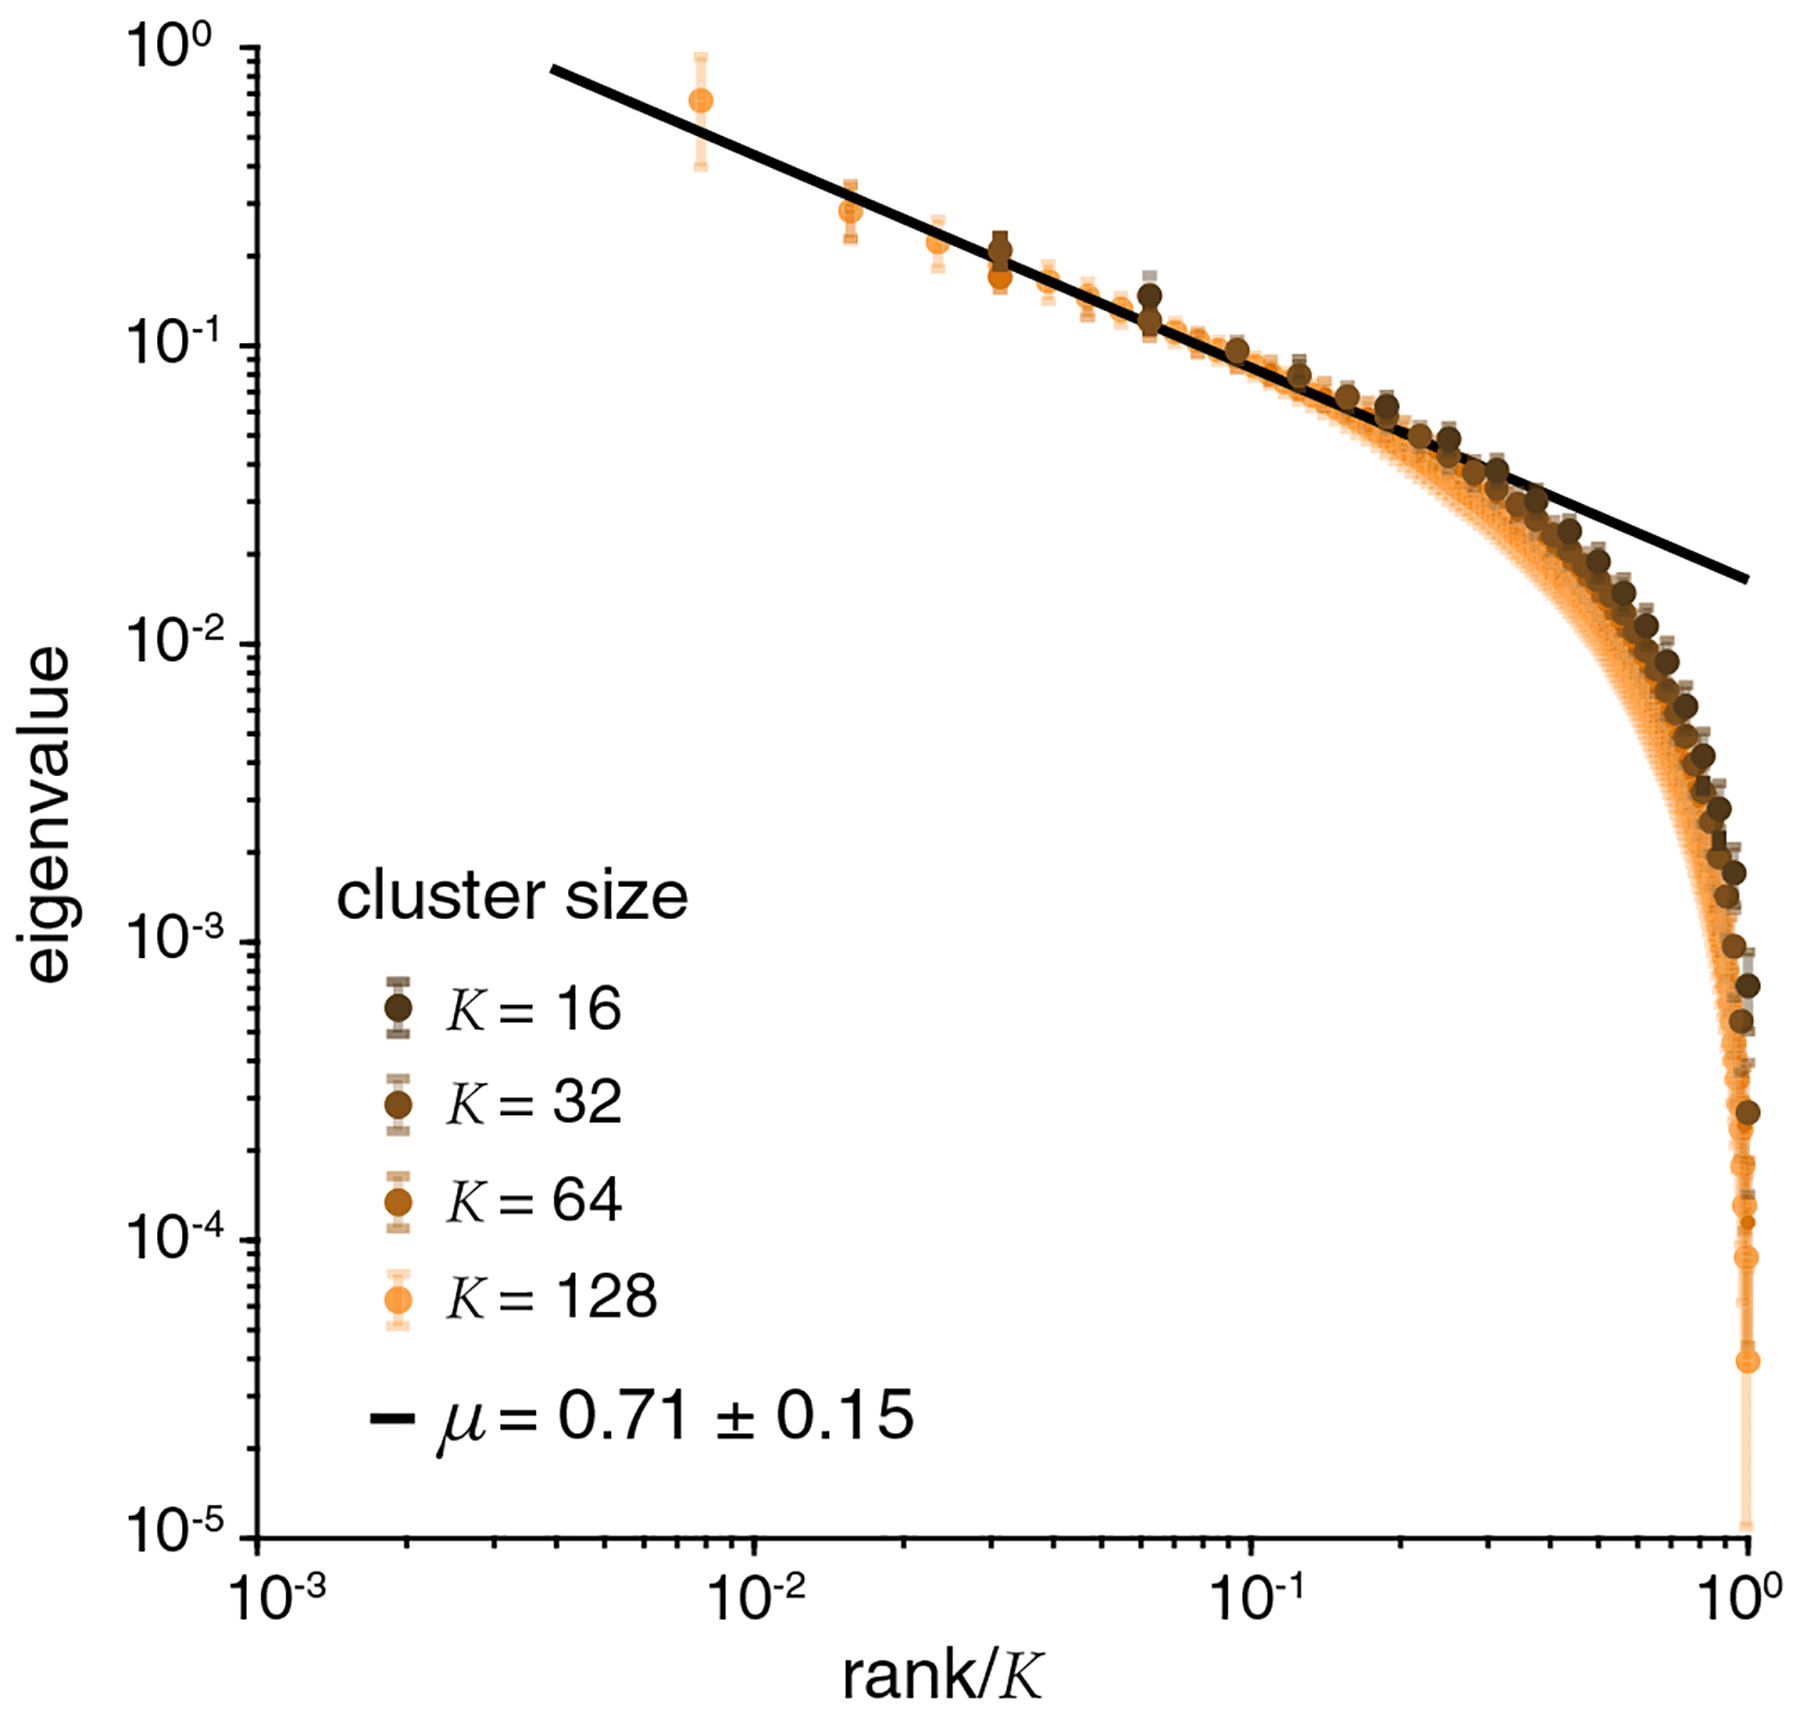
Scaling in eigenvalues of the covariance matrix spectra, Cij = 〈δxiδxj〉, for clusters of different sizes. Larger cluster corresponds to lighter color. Solid line is the fit to Eq. (6).
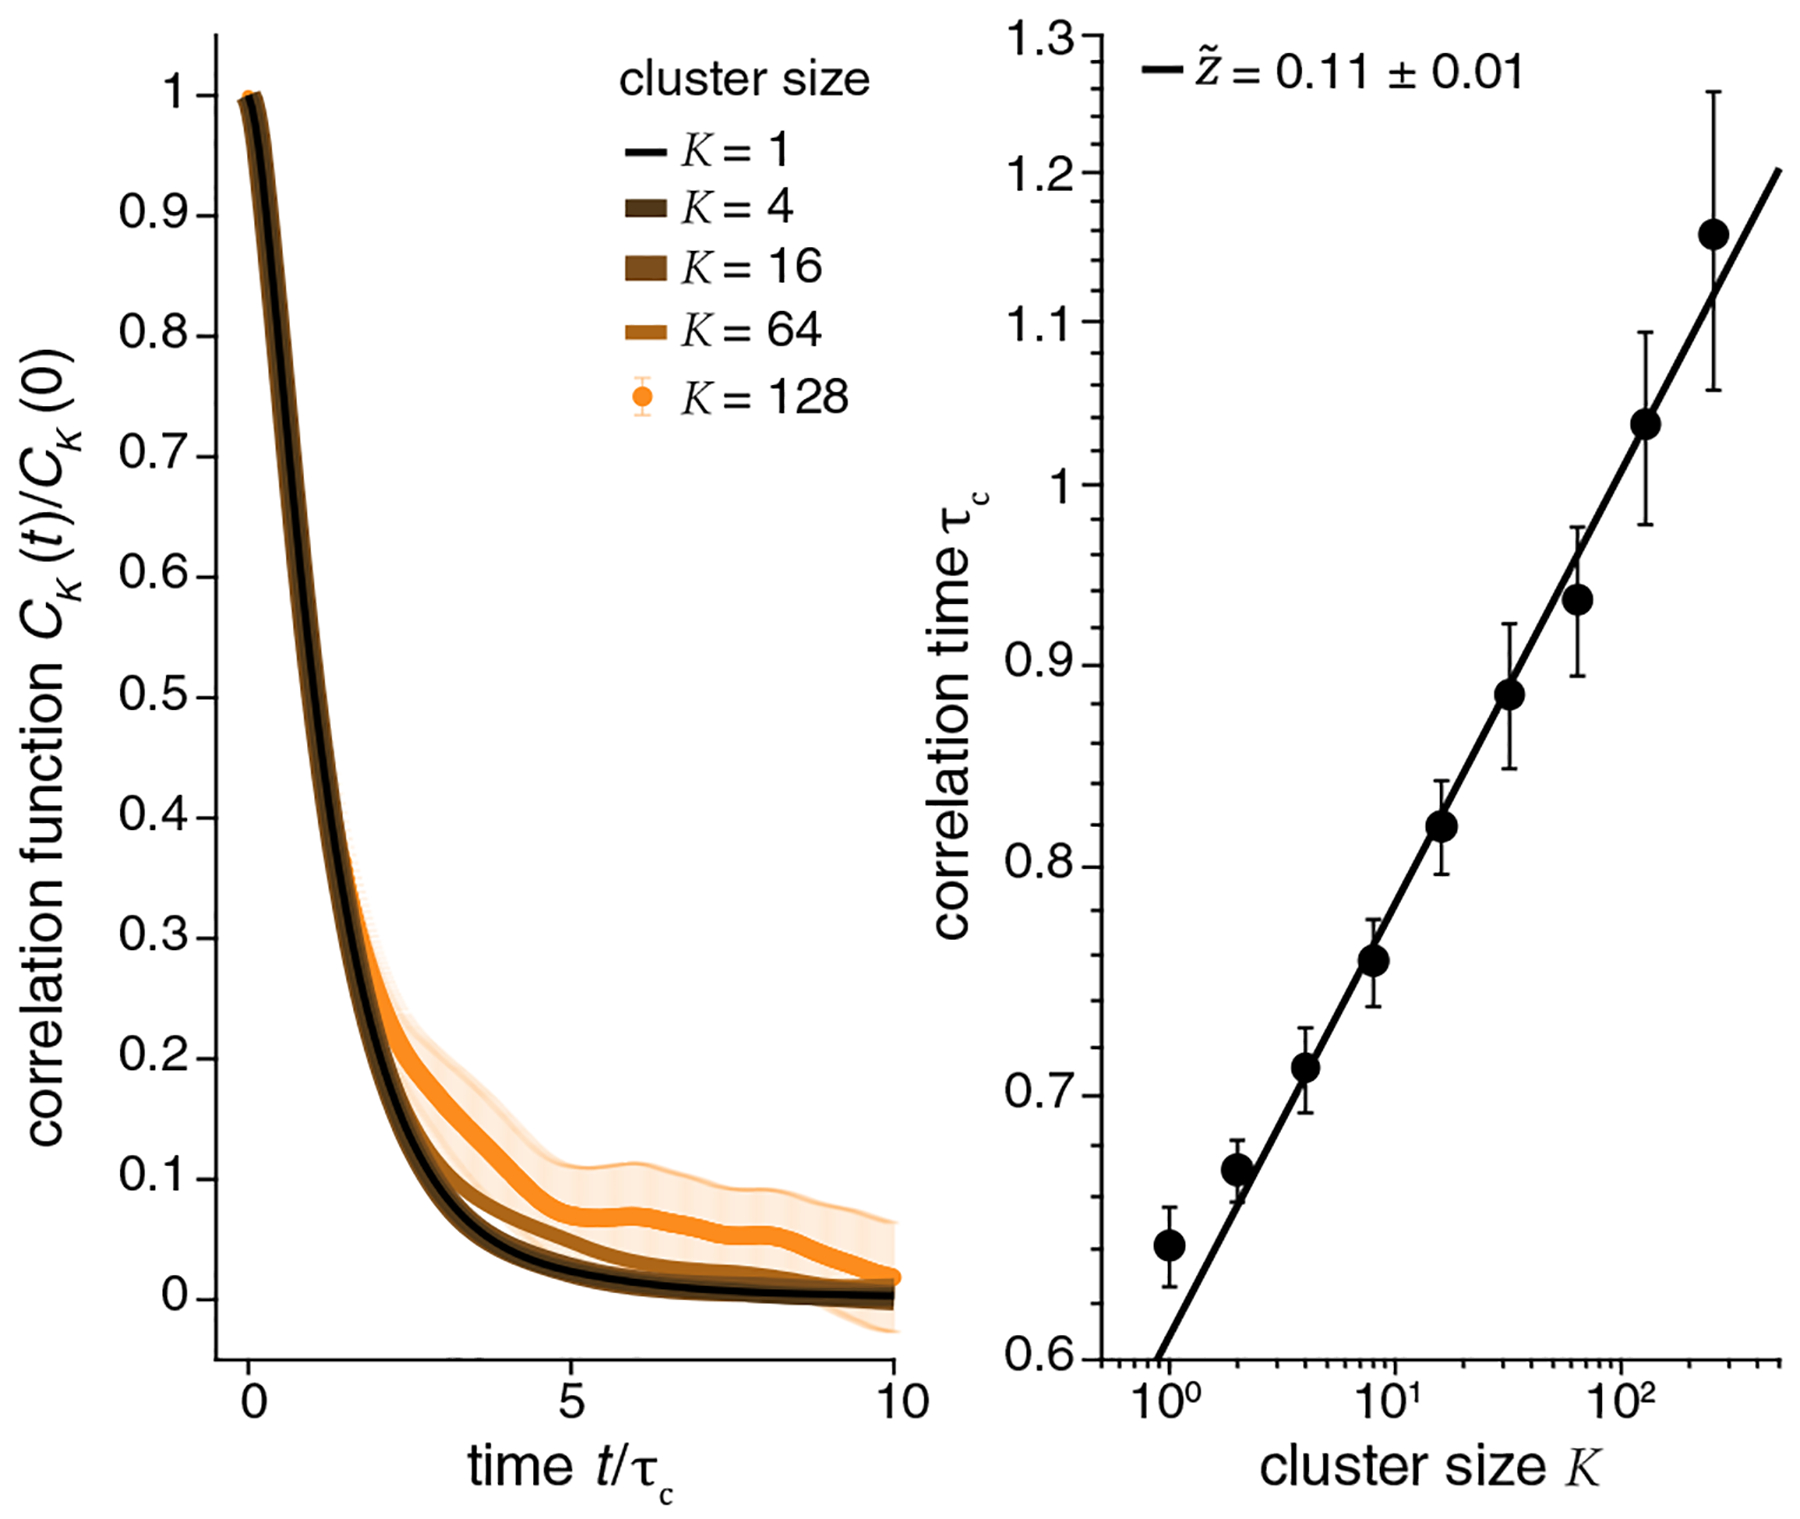
Dynamic scaling. (left) Correlation functions for different cluster sizes [Eq. (7)]. We show K = 1, 4, 16, 64, 128 (last one with error bars), where color lightens as K increases, illustrating the scaling behavior when we measure time in units of τc(K). (right) Dependence of correlation time on cluster size, with fit to Eq. (8).
References
-
- Kadanoff LP, Physics 2, 263 (1966).
-
- Wilson KG, Rev. Mod. Phys 47, 773 (1975).
-
- Wilson KG, Sci. Am 241, 158 (1979).
-
- Cardy J, Scaling and Renormalization in Statistical Physics (Cambridge University Press, Cambridge, England, 1996).
-
- Segev R, Goodhouse J, Puchalla JL, and Berry II MJ, Nat. Neurosci 7, 1155 (2004). - PubMed
MeSH terms
Grants and funding
LinkOut - more resources
Full Text Sources