. 2019 Nov 8;7(1):294.
doi: 10.1186/s40425-019-0745-3.

Domatinostat favors the immunotherapy response by modulating the tumor immune microenvironment (TIME)

Affiliations

Domatinostat favors the immunotherapy response by modulating the tumor immune microenvironment (TIME)

Anne Catherine Bretz et al. J Immunother Cancer. .

Abstract

Background: The efficacy of PD-(L)1 blockade depends on the composition of the tumor immune microenvironment (TIME) and is generally higher in tumors with pre-existing cytotoxic T cells (CTL) than in those with low CTL numbers. Nonetheless, a significant proportion of patients with pre-existing immunity fail to respond, indicating a therapeutic potential for combining PD-(L)1 blockade with additional immunomodulatory agents in both CTL-high and -low immune phenotypes. Here, we evaluated domatinostat (4SC-202), a class I-selective histone deacetylase (HDAC) inhibitor, for its effect on the TIME and its antitumoral efficacy using syngeneic mouse models with CTL-high or CTL-low tumors.

Methods: Domatinostat was evaluated in PD-1 blockade-insensitive CTL-low (CT26) and CTL-high (C38) syngeneic models alone and in combination with different immune-inhibitory and -stimulatory approaches. Effects on the immunophenotype were assessed via flow cytometry and RNA-seq analyses. The changes in RNA-seq-based immune signatures determined in a murine setting were investigated in patient samples from the first-dose cohort of the SENSITIZE trial (NCT03278665) evaluating domatinostat combined with pembrolizumab in advanced-stage melanoma patients refractory/nonresponding to PD-1 blockade.

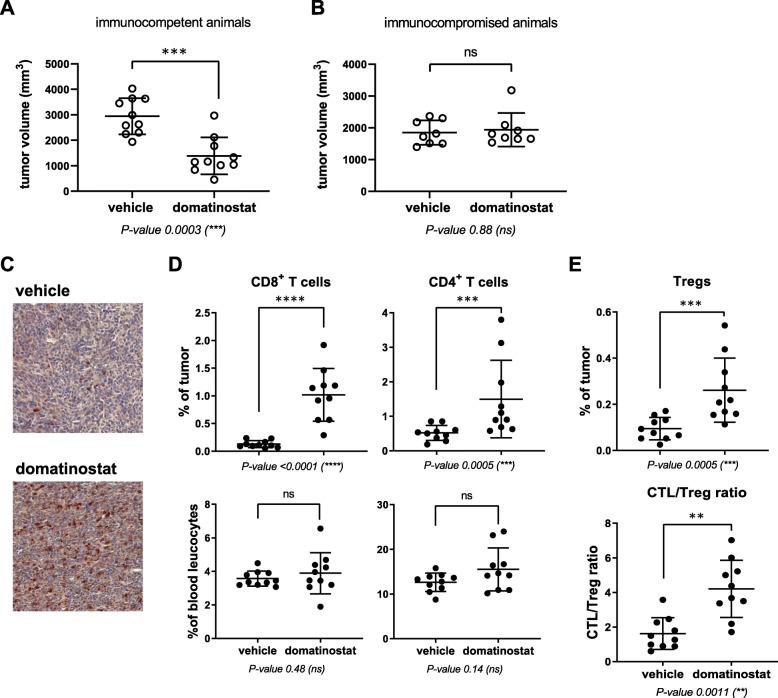
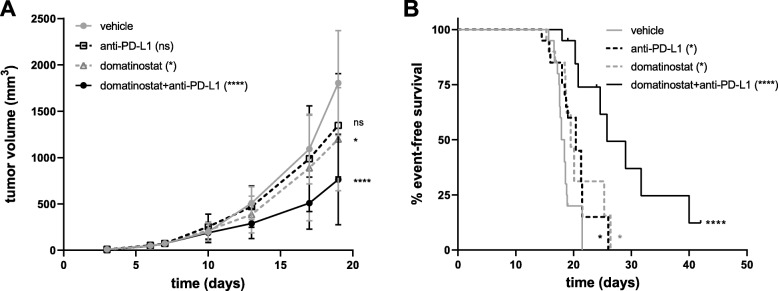
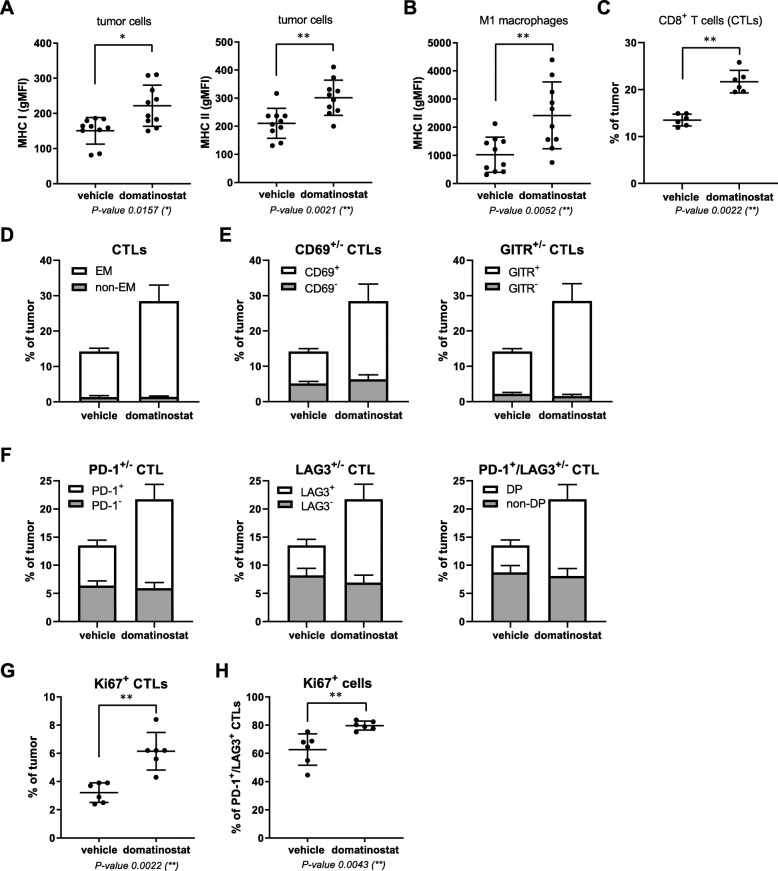
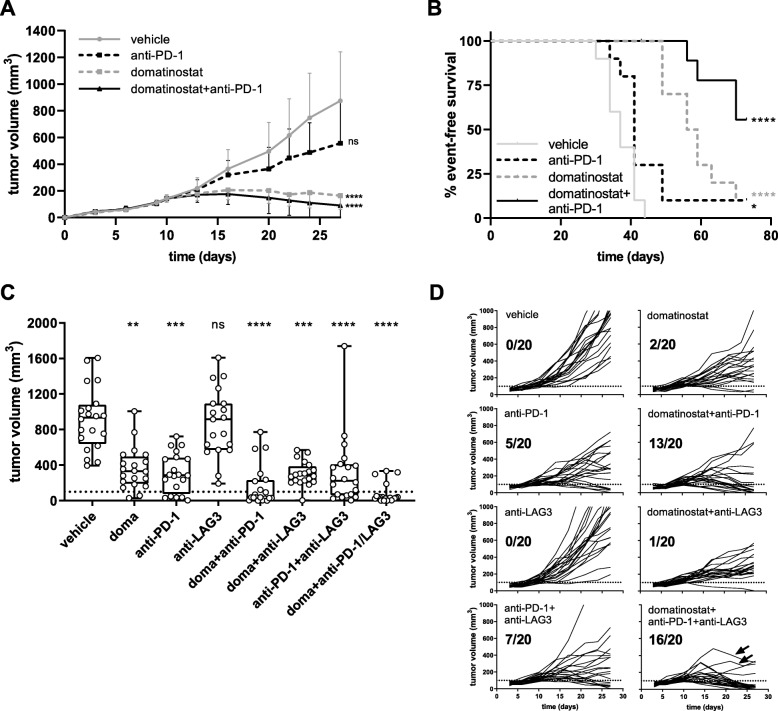
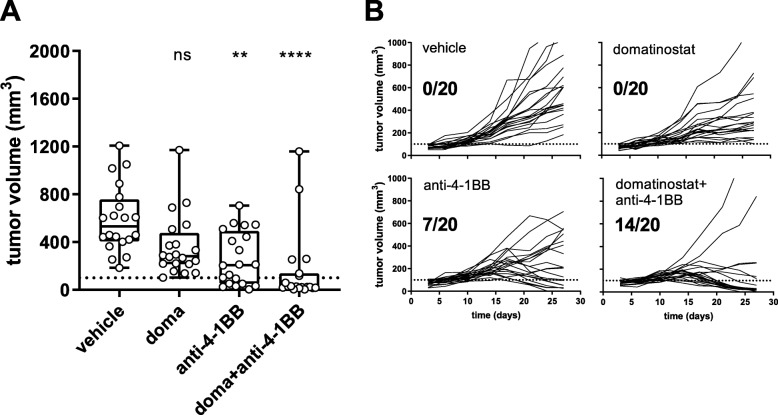
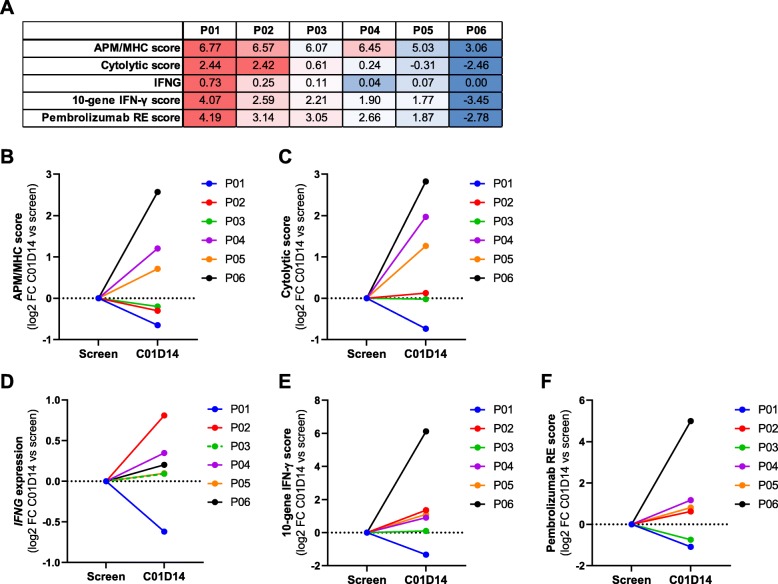
Results: Domatinostat increased the expression of antigen-presenting machinery (APM) genes and MHC class I and II molecules, along with CTL infiltration, in tumors of both immune phenotypes. In combination with PD-(L)1 blockade, domatinostat augmented antitumor effects substantially above the effects of single-agent therapies, displaying greater benefit in tumors with pre-existing CTLs. In this setting, the combination of domatinostat with agonistic anti-4-1BB or both PD-1 and LAG3 blockade further increased the antitumor efficacy. In CTL-low tumors, domatinostat enhanced the expression of genes known to reinforce immune responses against tumors. Specifically, domatinostat increased the expression of Ifng and genes associated with responses to pembrolizumab and nivolumab. Clinically, these findings were confirmed in patients with advanced melanoma treated with domatinostat for 14 days, who demonstrated elevated expression of APM and MHC genes, the IFNG gene, and the IFN-γ and pembrolizumab response signatures in individual tumor samples.

Conclusion: In summary, these data suggest a promising potential of domatinostat in combination with immunotherapy to improve the outcome of refractory cancer patients.

Keywords: Checkpoint inhibitor; Domatinostat; HDAC; IFN-γ signature; Immunotherapy; PD-1 blockade response signature; Tumor immune microenvironment.


Conflict of interest statement

ACB, UP, KK, TD, RB, FH, AA, TW, SH are employees of 4SC; TD, SH are stakeholders of 4SC. FH, RB, and SH are currently applying for patents covering combination of domatinostat with immunotherapies.

Figures

Fig. 1
Fig. 1
Domatinostat decreases tumor volume and induces strong CTL infiltration in the CTL-low CT26 tumor model. CT26 cells (1 × 106) were inoculated s.c. into immunocompetent (a, c-e; n = 10 per group) and immunocompromised (b; n = 8 per group) BALB/c mice; when tumor volumes reached 150 mm3, animals were treated with domatinostat (20 mg/kg twice daily) or vehicle; after the end of treatment, tumors were harvested for flow cytometry and IHC. a, b, Tumor volumes in immunocompetent (a) and immunocompromised animals (b). c, CD3-AP (red) and CD8-DAB (brown) double IHC staining of the tumor core. d, Proportion of CD8+ and CD4+ T cells in tumors (upper panel) and blood (lower panel). e, Proportion of Tregs and CTL/Treg ratio in tumors. a, b, d, e, Mean ± SD showing all data points; P-values: Mann-Whitney test, two-tailed, **, P < 0.01; ***, P < 0.001; ****, P < 0.0001; ns, not significant
Fig. 2
Fig. 2
Domatinostat increases gene expression signatures correlated with the clinical benefit of PD-1 blockade. CT26 tumor model (n = 10 per group) as in Fig. 1; end-of-treatment tumors were analyzed for gene expression by RNA-seq. a, Heatmap of antigen-processing machinery (APM) and major histocompatibility complex (MHC) class I and II gene expression with scores per sample. b, APM/MHC signature score based on (a). c, Ifng gene expression. d, IFN-γ response signature score (MSigDB hallmark gene set). e, Gene set enrichment analysis (GSEA) plot for the correlation of domatinostat-regulated gene expression with the IFN-γ response signature (MSigDB). NES: normalized enrichment score; FDR: false discovery rate. f, Heatmap of pembrolizumab response signature gene expression (adapted from Ayer’s T cell inflamed signature) [5]. g, Pembrolizumab response (RE) signature score based on (f). h, Nivolumab response (RE) signature score [27]. b, c, d, g, h, Mean ± SD showing all data points; signature scores were calculated by mean log2(TPM + 0.001) of their respective member genes; P-values: Mann-Whitney test, two-tailed. *, P < 0.05; **, P < 0.01; ***, P < 0.001; ns, not significant. TPM, transcripts per million; DGE, differential gene expression
Fig. 3
Fig. 3
Domatinostat synergizes with PD-L1 blockade to prolong survival. CT26 tumor model as in Fig. 1; animals were treated with 20 mg/kg domatinostat twice daily, 10 mg/kg anti-PD-L1 antibody twice a week or the combination of both and were compared with vehicle-treated animals (n = 20 per group). a, Tumor volumes (mean ± SD) over time. b, Kaplan-Meier event-free survival plots. An event was defined as a tumor volume of 1500 mm3. P-values: a, Kruskal-Wallis test (d19); Dunn’s multiple comparison to vehicle. b, Log-rank (Mantel-Cox) test, comparison to vehicle. *, P < 0.05; ****, P < 0.0001; ns, not significant
Fig. 4
Fig. 4
In CTL-high C38 tumors, domatinostat treatment results in activated effector CTL populations expressing PD-1/LAG3. C38 tumor fragments were inoculated s.c. into C57BL/6 J mice; when tumor volumes reached 150 mm3, animals were treated with 20 mg/kg domatinostat or vehicle twice daily; tumors were harvested for analysis of cell populations by flow cytometry after 9 (c-h, n = 6) or 18 treatment days (a, b, n = 10). a, MHC class I and II expression on tumor cells (CD45). b, MHC class II expression on M1 macrophages (CD45+CD3CD11b+CD38+). c, Proportion of CTLs (CD3+CD8+) within tumors. d-h, Characterization of intratumoral CTLs: proportions of the effector memory (EM, CD44+CD62L) (d), CD69+ and GITR+ (e), PD-1+, LAG3+ and PD-1+/LAG3+ double-positive (DP) (f) and Ki67+ CTLs (g) and of Ki67+ cells within the PD-1+/LAG3+ CTL population (h). a-c, g, h, Mean ± SD showing all data points; gMFI, geometric mean fluorescence intensity. d-f, Mean + SD shown in stacked bars. P-value: Mann-Whitney test, two-tailed. *, P < 0.05; **, P < 0.01
Fig. 5
Fig. 5
Combination therapy of domatinostat with PD-1 and LAG3 blockade significantly increases antitumoral responses. C38 tumor model as in Fig. 4; animals were treated with 60 mg/kg domatinostat once daily (a, b) or 20 mg/kg domatinostat twice daily (c, d); anti-PD-1 and anti-LAG3 antibodies were administered at 10 mg/kg as detailed in the Methods (n = 20 per group). a, Tumor volumes (mean + SD) over time. b, Kaplan-Meier event-free survival plots. An event was defined as a tumor volume of 1500 mm3. End of study was day 70. c, Tumor volumes at day 27; response was defined as tumor regression below a volume of 100 mm3 (dotted line). d, Changes in tumor volumes over time for each individual animal and the number of responding animals out of the total for treatment regimens corresponding to (c); arrows indicate two animals with an incipient tumor regression after initial progress. c, Box and whiskers (min, max) showing all points. a, c, P-value: Kruskal-Wallis test; Dunn’s multiple comparison (d27) to vehicle. b, P-value: log-rank (Mantel-Cox) test, comparison to vehicle. *, P < 0.05; **, P < 0.01; ***, P < 0.001; ****, P < 0.0001; ns, not significant
Fig. 6
Fig. 6
Combination therapy of domatinostat with the agonistic anti-4-1BB antibody significantly increases antitumoral responses. C38 tumor model as in Figs. 4 and 5; animals were treated with 20 mg/kg domatinostat twice daily; agonistic anti-4-1BB antibody was administered at 10 mg/kg as detailed in the Methods (n = 20 per group). a, Tumor volumes at day 27; response was defined as tumor regression below a volume of 100 mm3 (dotted line). b, Changes in tumor volume over time for each individual animal and for responding animals out of the total for each treatment regimen listed in (a). a, Box and whiskers (min, max) showing all points, P-value: Kruskal-Wallis test; Dunn’s multiple comparison (d27) to vehicle. *, P < 0.05; **, P < 0.01; ***, P < 0.001; ****, P < 0.0001; ns, not significant
Fig. 7
Fig. 7
Domatinostat increases IFN-γ, APM/MHC and PD-1 therapy response scores in biopsies of domatinostat-treated melanoma patients. Six patients (P01-P06) with advanced cutaneous melanoma treated with 100 mg domatinostat once daily in a phase I/II clinical trial (SENSITIZE trial: NCT03278665) were subjected to biopsy of tumor lesions before (screen, baseline) and after 14 days of treatment (C01D14) for analysis of gene expression (RNA-seq). a, Baseline expression scores (mean log2(TPM + 0.001)) for selected gene sets per patient. b-f, Expression changes after 14 days of domatinostat monotherapy (C01D14) shown as log2 fold change (FC) from the baseline score for APM/MHC genes (b), cytolytic activity genes (c), IFNG (d), the 10-gene IFN-γ-related signature [5] (e) and the pembrolizumab response (RE) signature [5] (f)

References

    1. Nghiem PT, Bhatia S, Lipson EJ, Kudchadkar RR, Miller NJ, Annamalai L, et al. PD-1 blockade with Pembrolizumab in advanced Merkel-cell carcinoma. N Engl J Med. 2016;374:2542–2552. - PMC - PubMed
    1. Chen Q, Li T, Yue W. Drug response to PD-1/PD-L1 blockade: based on biomarkers. Onco Targets Ther. 2018;11:4673–4683. - PMC - PubMed
    1. Hegde PS, Karanikas V, Evers S. The where, the when, and the how of immune monitoring for Cancer immunotherapies in the era of checkpoint inhibition. Clin Cancer Res. 2016;22:1865–1874. - PubMed
    1. Bindea G, Mlecnik B, Angell HK, Galon J. The immune landscape of human tumors. Oncoimmunology. 2014;3:e27456. - PMC - PubMed
    1. Ayers M, Lunceford J, Nebozhyn M, Murphy E, Loboda A, Kaufman DR, et al. IFN- γ – related mRNA profile predicts clinical response to PD-1 blockade. J Clin Invest. 2017;127:2930–2940. - PMC - PubMed

Publication types

MeSH terms