

Brain volumes as predictors of tDCS effects in primary progressive aphasia
- PMID: 31704518
- PMCID: PMC7709910
- DOI: 10.1016/j.bandl.2019.104707
Brain volumes as predictors of tDCS effects in primary progressive aphasia
Abstract
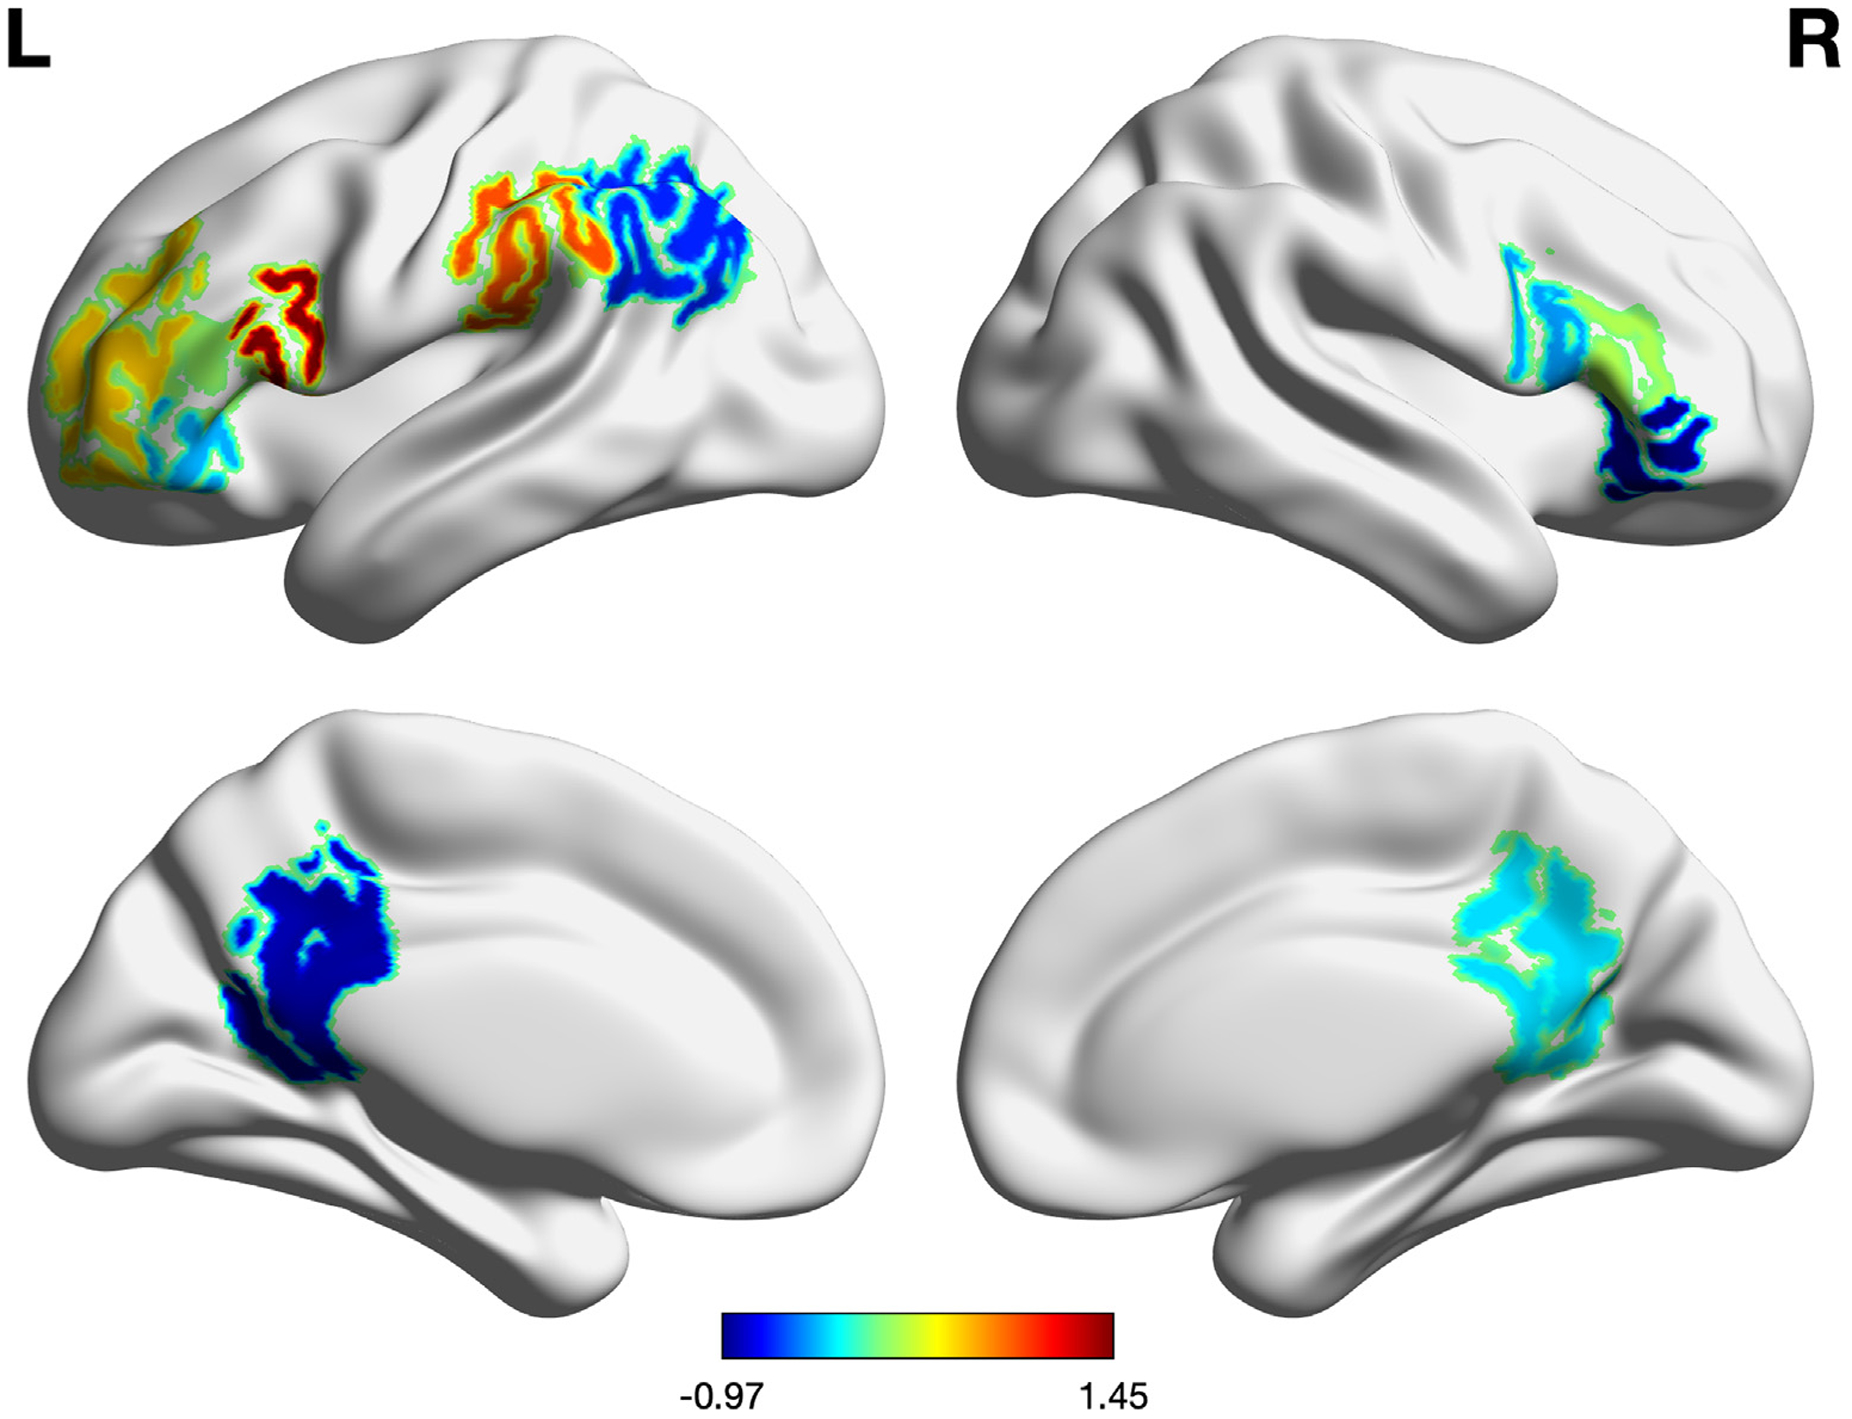
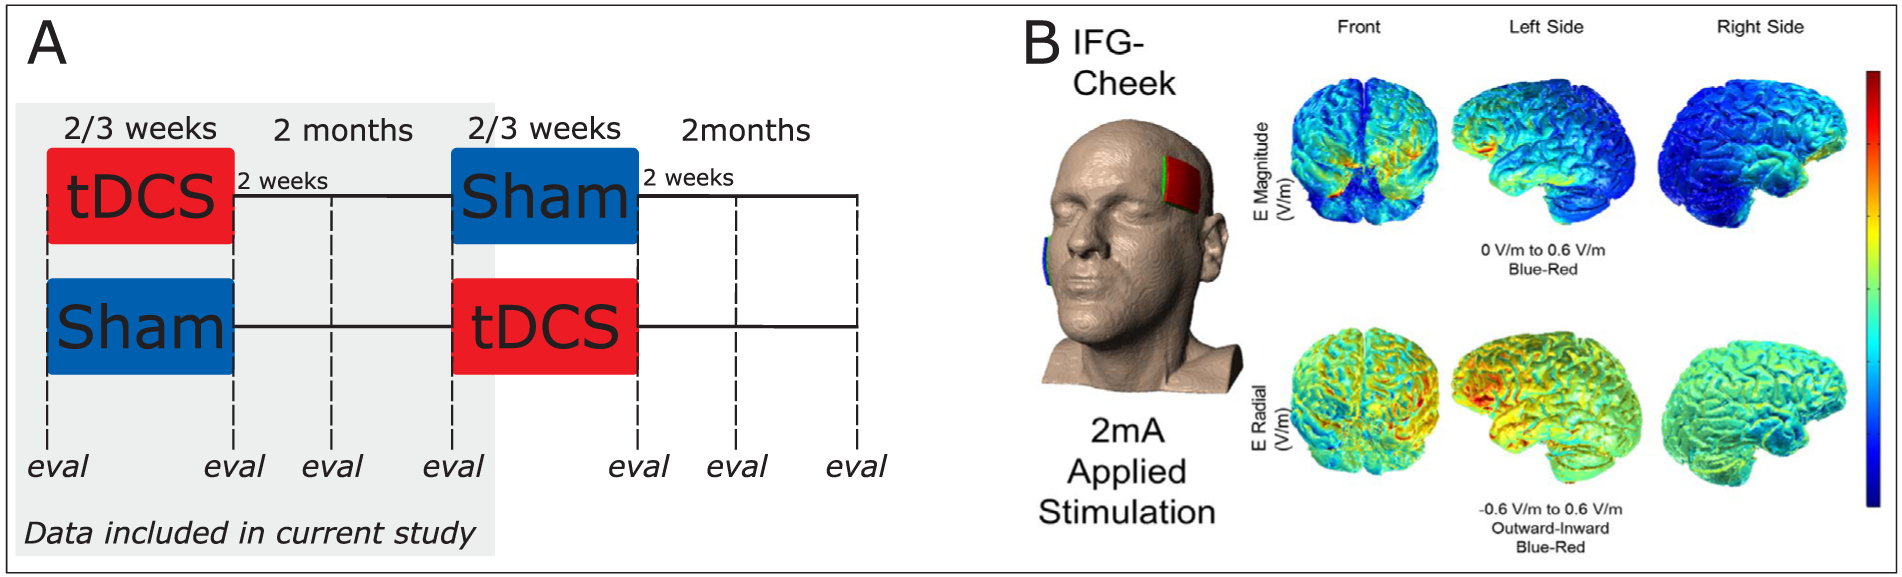
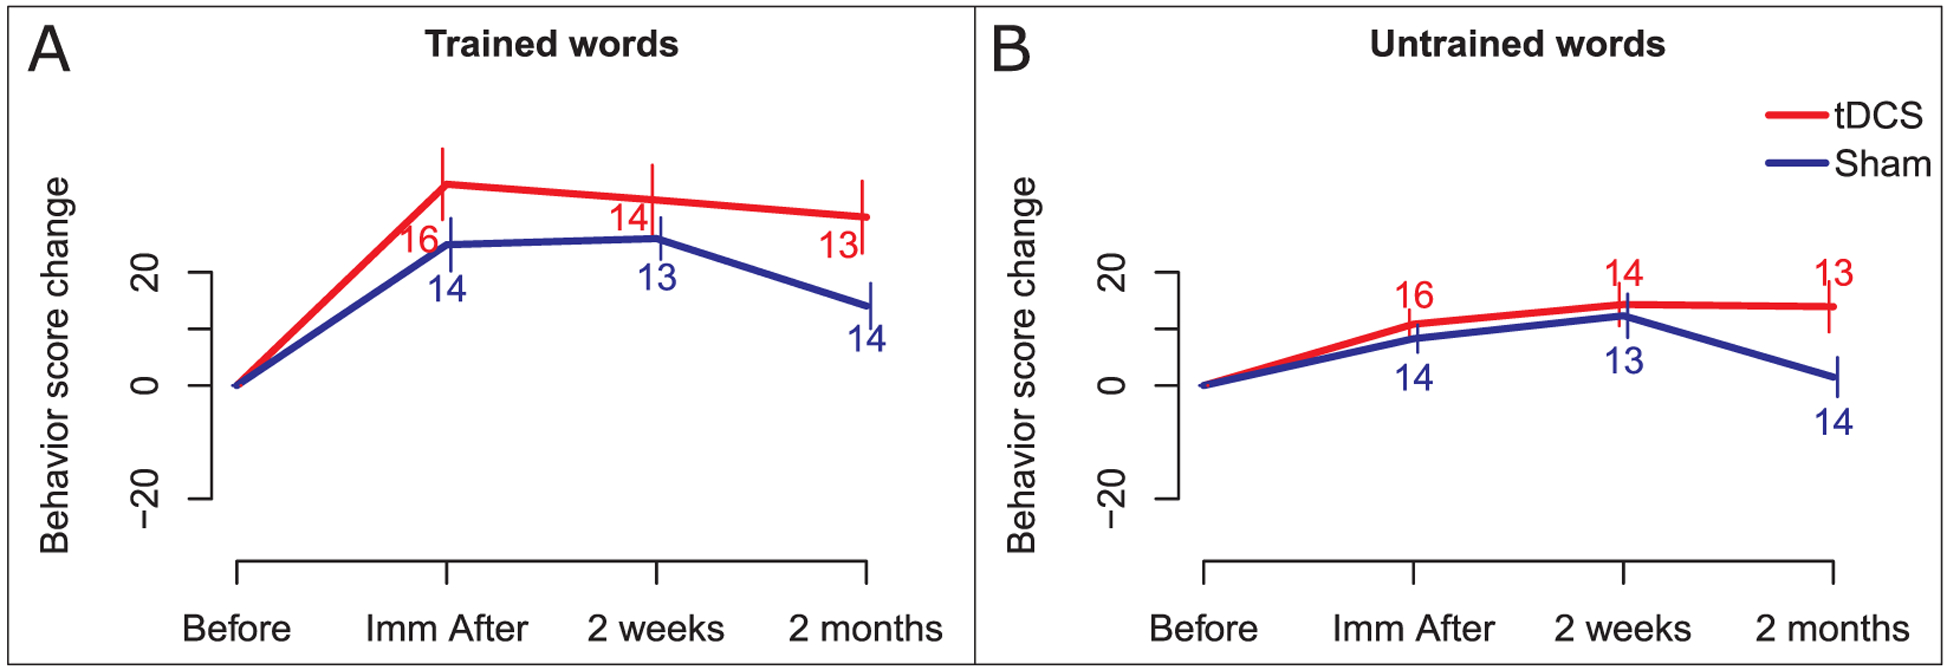
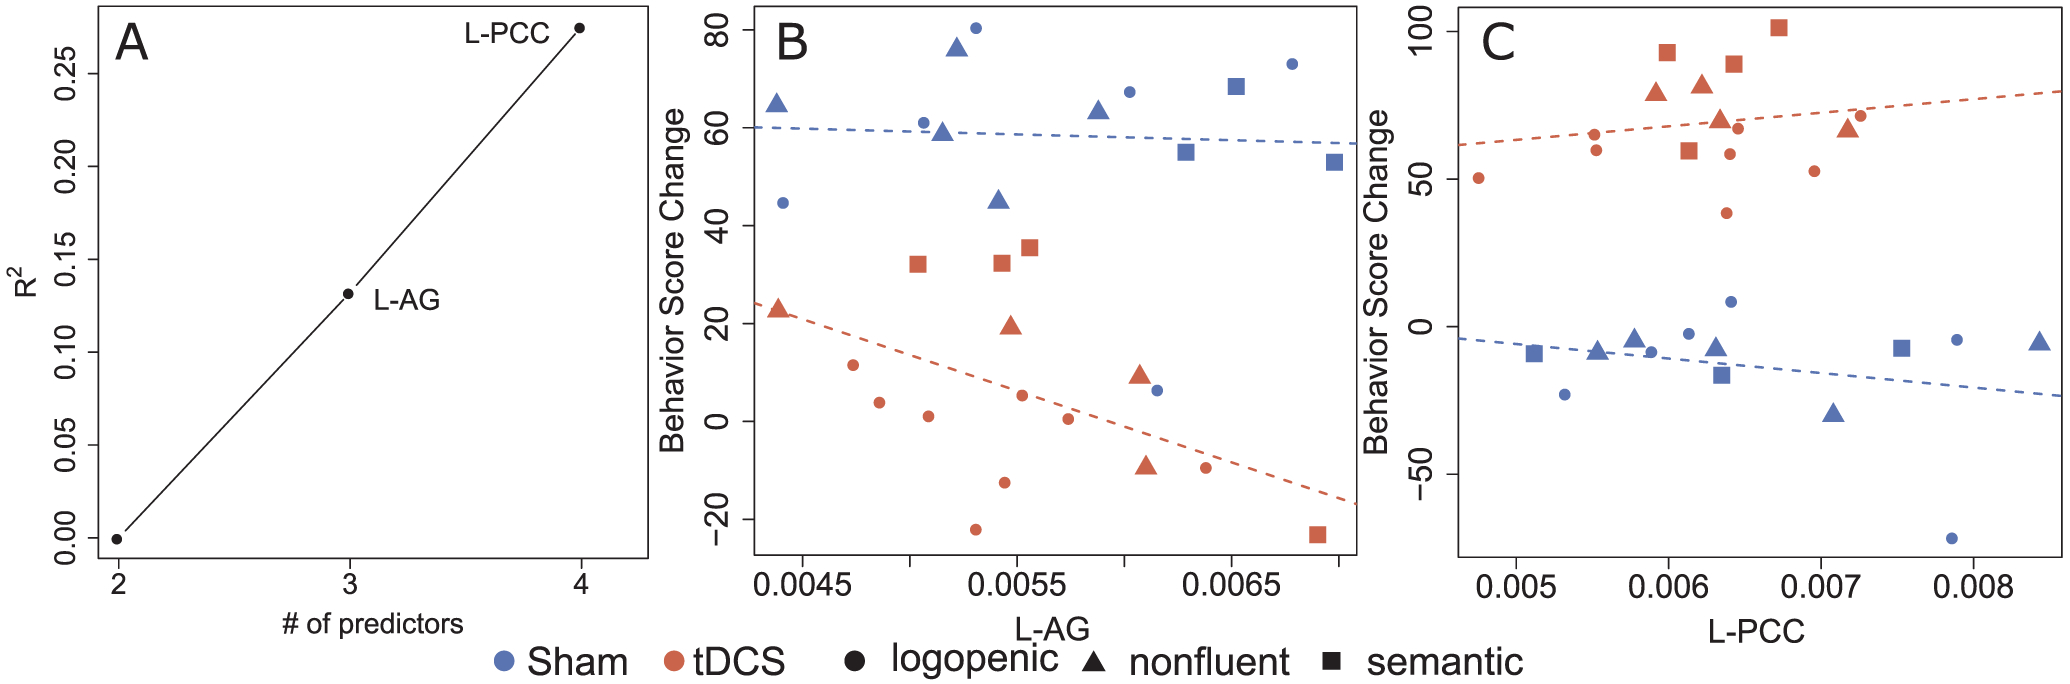
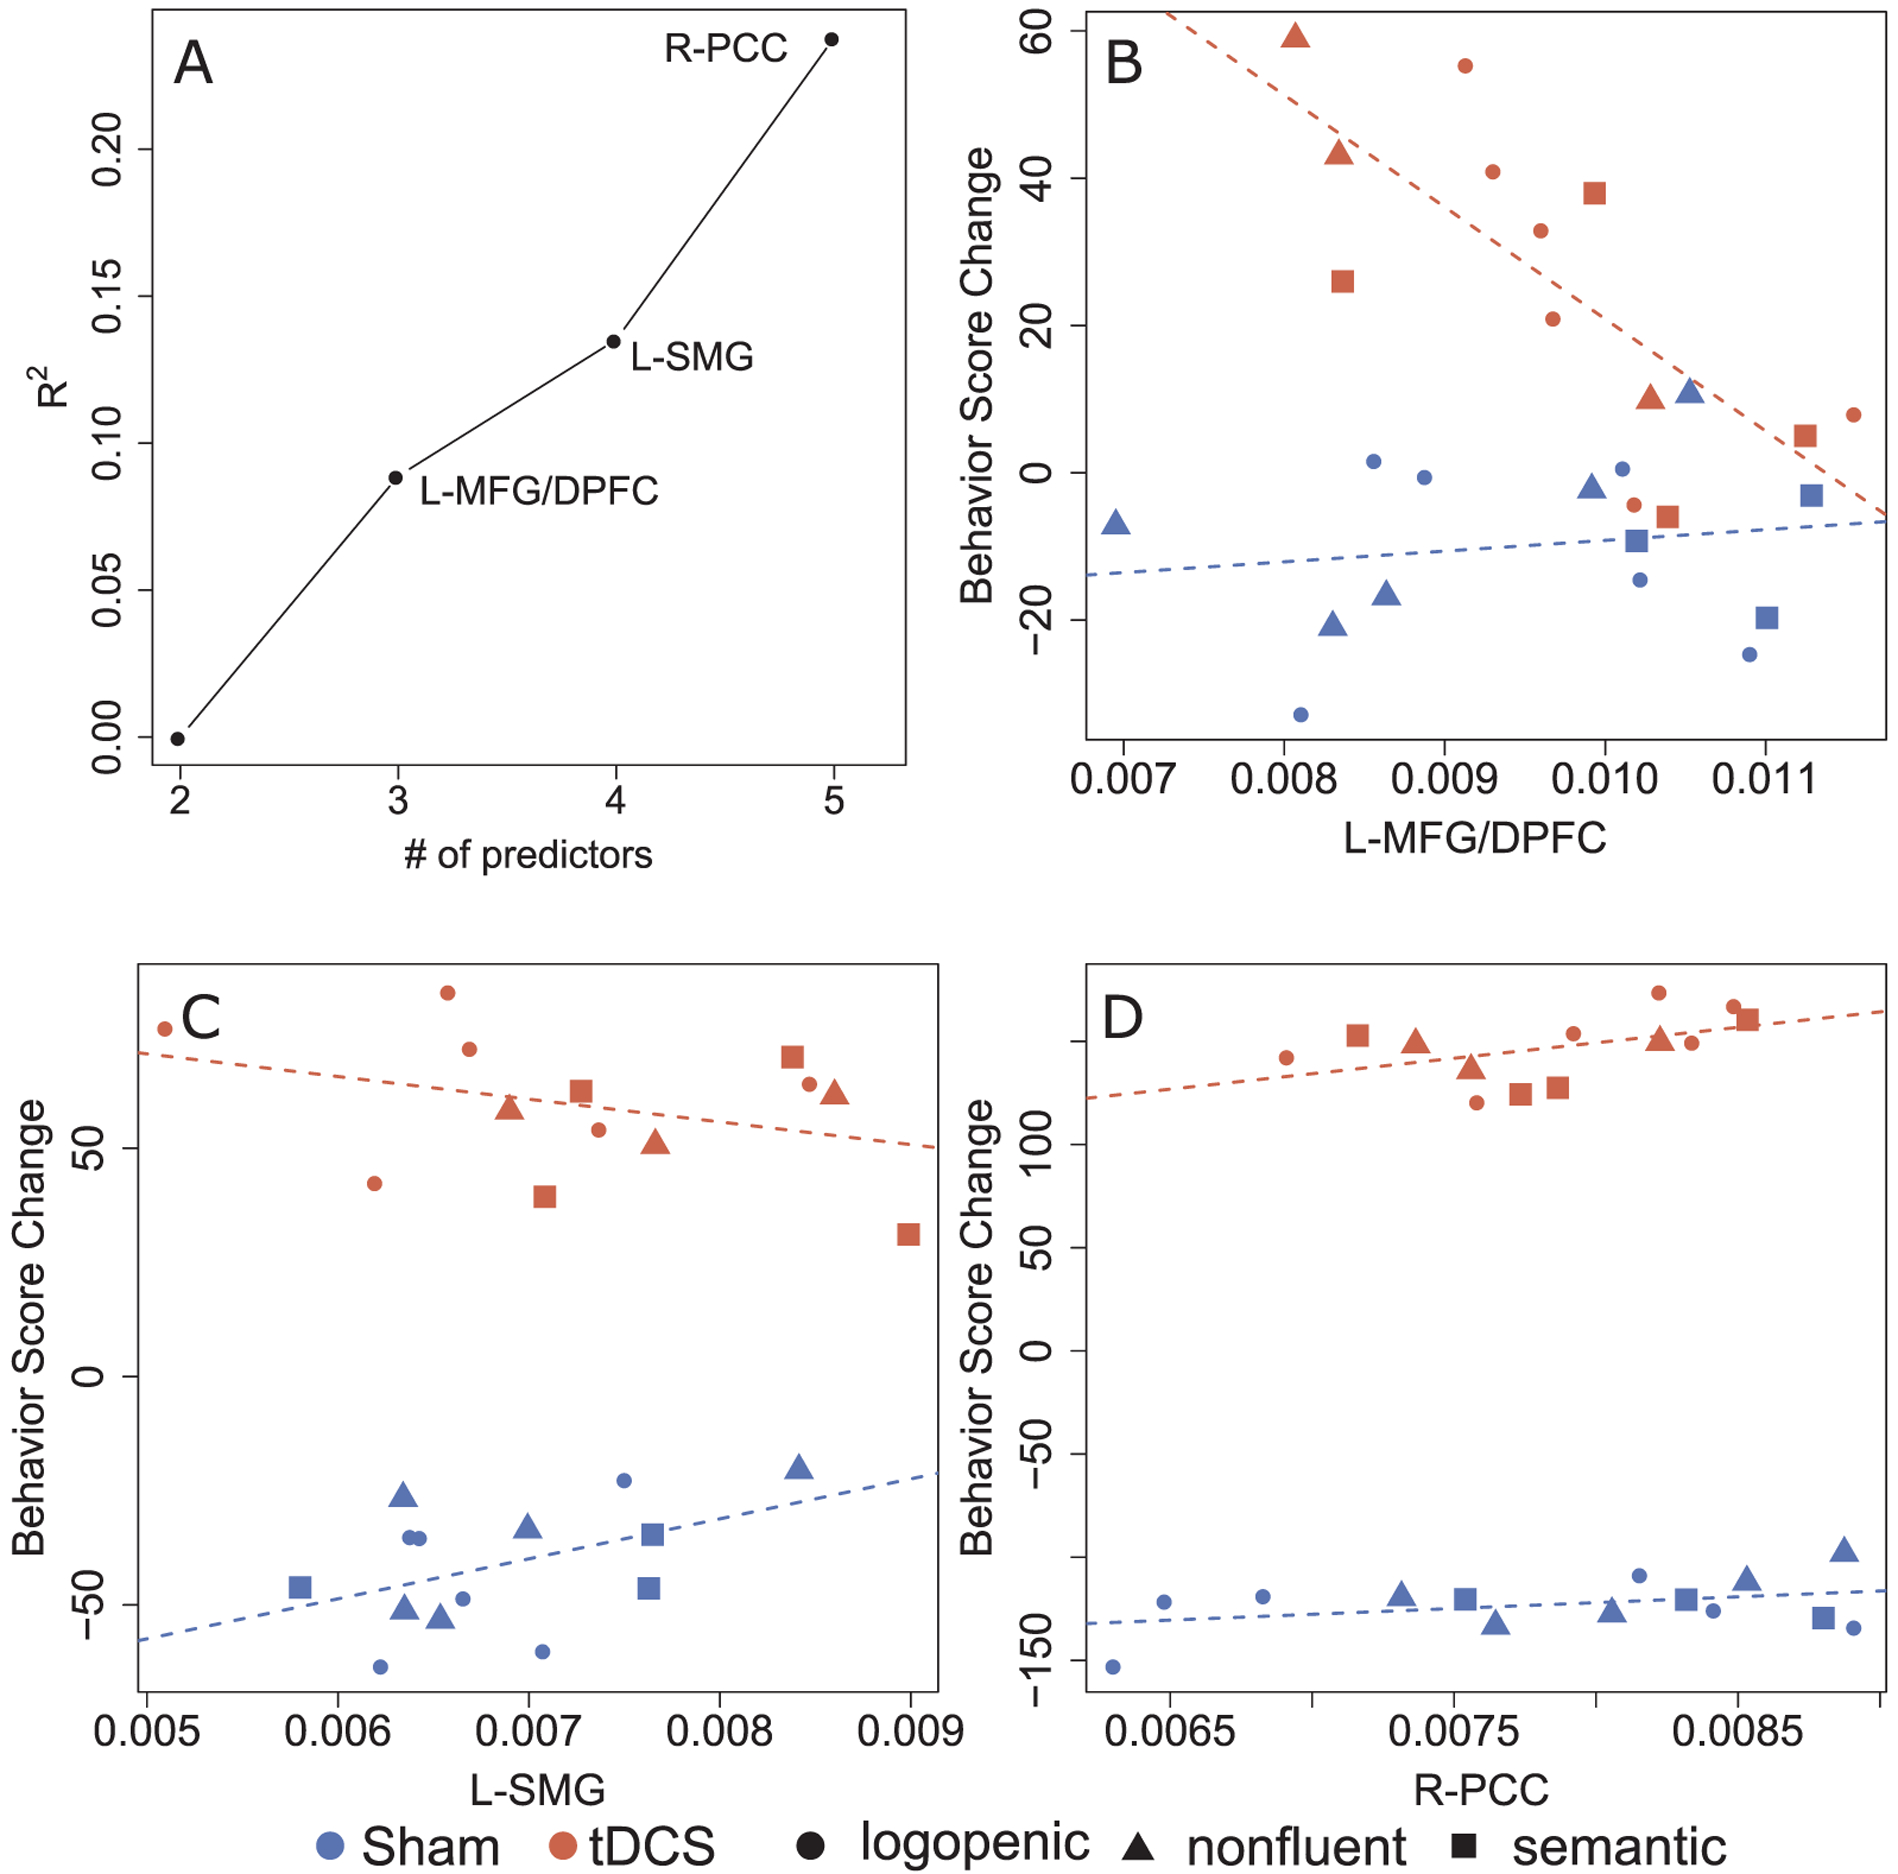
The current study aims to determine the brain areas critical for response to anodal transcranial direct current stimulation (tDCS) in PPA. Anodal tDCS and sham were administered over the left inferior frontal gyrus (IFG), combined with written naming/spelling therapy. Thirty people with PPA were included in this study, and assessed immediately, 2 weeks, and 2 months post-therapy. We identified anatomical areas whose volumes significantly predicted the additional tDCS effects. For trained words, the volumes of the left Angular Gyrus and left Posterior Cingulate Cortex predicted the additional tDCS gain. For untrained words, the volumes of the left Middle Frontal Gyrus, left Supramarginal Gyrus, and right Posterior Cingulate Cortex predicted the additional tDCS gain. These findings show that areas involved in language, attention and working memory contribute to the maintenance and generalization of stimulation effects. The findings highlight that tDCS possibly affects areas anatomically or functionally connected to stimulation targets.
Keywords: Intervention; Language rehabilitation; PPA; Prediction of treatment outcomes; Spelling; Writing; tDCS.
Copyright © 2019 The Author(s). Published by Elsevier Inc. All rights reserved.
Figures
Similar articles
-
The effect of tDCS on functional connectivity in primary progressive aphasia.Neuroimage Clin. 2018 May 21;19:703-715. doi: 10.1016/j.nicl.2018.05.023. eCollection 2018. Neuroimage Clin. 2018. PMID: 30009127 Free PMC article.
-
White Matter Integrity Predicts Electrical Stimulation (tDCS) and Language Therapy Effects in Primary Progressive Aphasia.Neurorehabil Neural Repair. 2021 Jan;35(1):44-57. doi: 10.1177/1545968320971741. Neurorehabil Neural Repair. 2021. PMID: 33317422 Free PMC article. Clinical Trial.
-
Cognitive and language performance predicts effects of spelling intervention and tDCS in Primary Progressive Aphasia.Cortex. 2020 Mar;124:66-84. doi: 10.1016/j.cortex.2019.11.001. Epub 2019 Nov 19. Cortex. 2020. PMID: 31838450 Free PMC article.
-
Effectiveness of language training and non-invasive brain stimulation on oral and written naming performance in Primary Progressive Aphasia: A meta-analysis and systematic review.Neurosci Biobehav Rev. 2020 Jan;108:498-525. doi: 10.1016/j.neubiorev.2019.12.003. Epub 2019 Dec 4. Neurosci Biobehav Rev. 2020. PMID: 31811834
-
Transcranial direct current stimulation in post stroke aphasia and primary progressive aphasia: Current knowledge and future clinical applications.NeuroRehabilitation. 2016 Jun 13;39(1):141-52. doi: 10.3233/NRE-161346. NeuroRehabilitation. 2016. PMID: 27314871 Free PMC article. Review.
Cited by
-
Home-Based Transcranial Direct Current Stimulation in Primary Progressive Aphasia: A Pilot Study.Brain Sci. 2024 Apr 17;14(4):391. doi: 10.3390/brainsci14040391. Brain Sci. 2024. PMID: 38672040 Free PMC article.
-
Dysgraphia and Memory: Insights into the Cognitive Mechanisms, Neural Correlates, and Intervention Strategies.Integr Psychol Behav Sci. 2024 Dec;58(4):1778-1792. doi: 10.1007/s12124-024-09835-x. Epub 2024 Nov 7. Integr Psychol Behav Sci. 2024. PMID: 39505782 Review.
-
The role of structural and functional parameters in designing pathology-specific tDCS protocols for primary progressive aphasia.Alzheimers Res Ther. 2025 Jul 14;17(1):156. doi: 10.1186/s13195-025-01737-3. Alzheimers Res Ther. 2025. PMID: 40660278 Free PMC article.
-
Through Thick and Thin: Baseline Cortical Volume and Thickness Predict Performance and Response to Transcranial Direct Current Stimulation in Primary Progressive Aphasia.Front Hum Neurosci. 2022 Jul 7;16:907425. doi: 10.3389/fnhum.2022.907425. eCollection 2022. Front Hum Neurosci. 2022. PMID: 35874157 Free PMC article.
-
Neuroanatomical Predictors of Transcranial Direct Current Stimulation (tDCS)-Induced Modifications in Neurocognitive Task Performance in Typically Developing Individuals.J Neurosci. 2024 May 29;44(22):e1372232024. doi: 10.1523/JNEUROSCI.1372-23.2024. J Neurosci. 2024. PMID: 38548336 Free PMC article.
References
-
- Bonilha L, Gleichgerrcht E, Nesland T, Rorden C, & Fridriksson J (2016). Success of anomia treatment in aphasia is associated with preserved architecture of global and left temporal lobe structural networks. Neurorehabilitation and Neural Repair, 30(3), 266–279. 10.1177/1545968315593808. - DOI - PMC - PubMed
-
- Caramazza A, Miceli G, Villa G, & Romani C (1987). The role of the Graphemic Buffer in spelling: Evidence from a case of acquired dysgraphia. Cognition, 26(1), 59–85. - PubMed
