. 2020 Jan 2;40(1):237-254.
doi: 10.1523/JNEUROSCI.0222-19.2019. Epub 2019 Nov 8.

NEXMIF/KIDLIA Knock-out Mouse Demonstrates Autism-Like Behaviors, Memory Deficits, and Impairments in Synapse Formation and Function

Affiliations

NEXMIF/KIDLIA Knock-out Mouse Demonstrates Autism-Like Behaviors, Memory Deficits, and Impairments in Synapse Formation and Function

James Gilbert et al. J Neurosci. .

Abstract

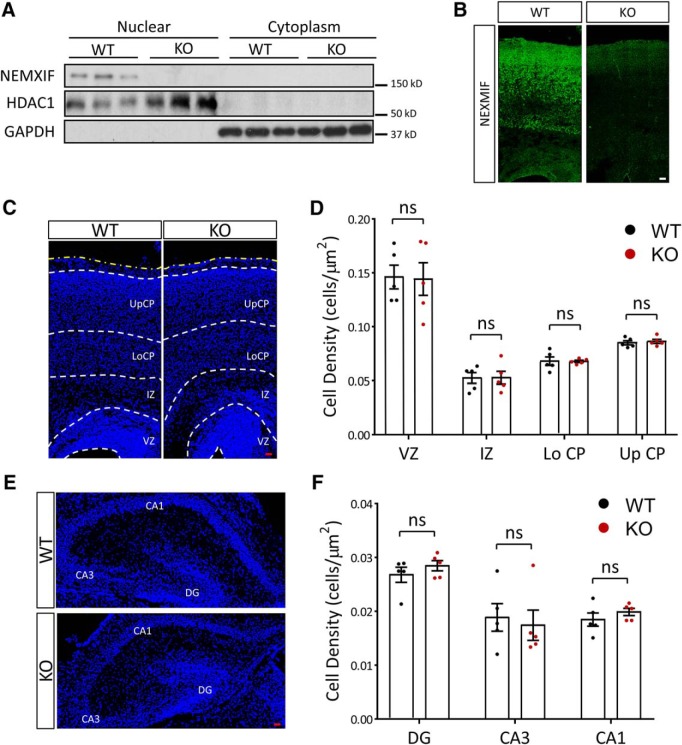
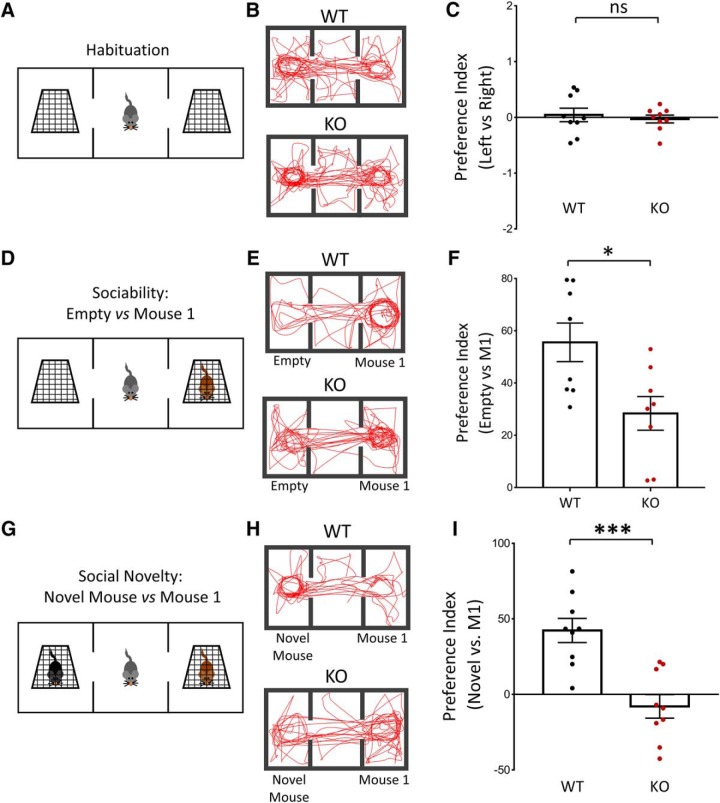
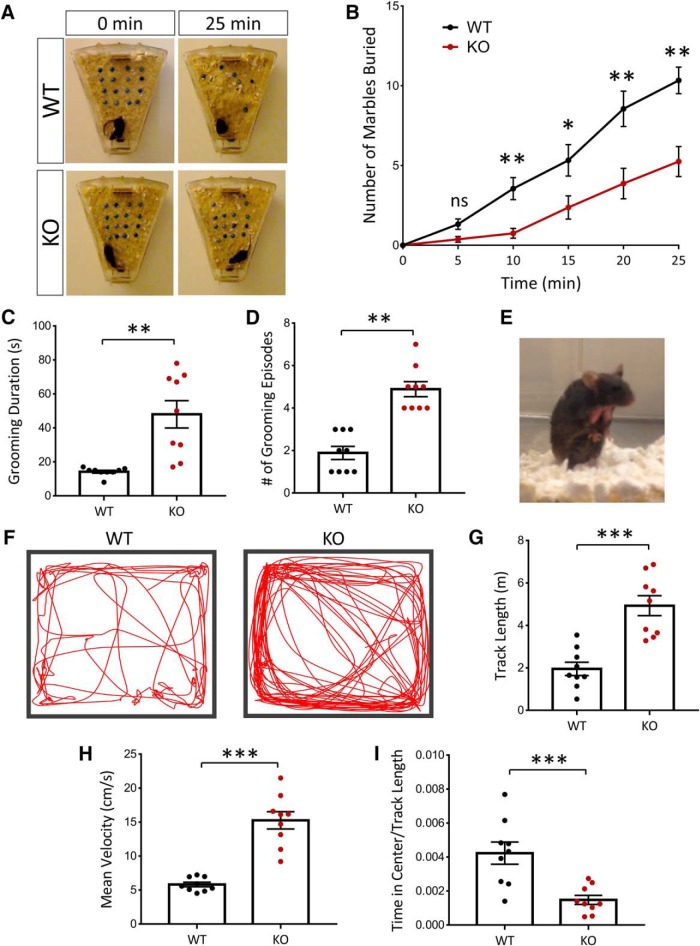
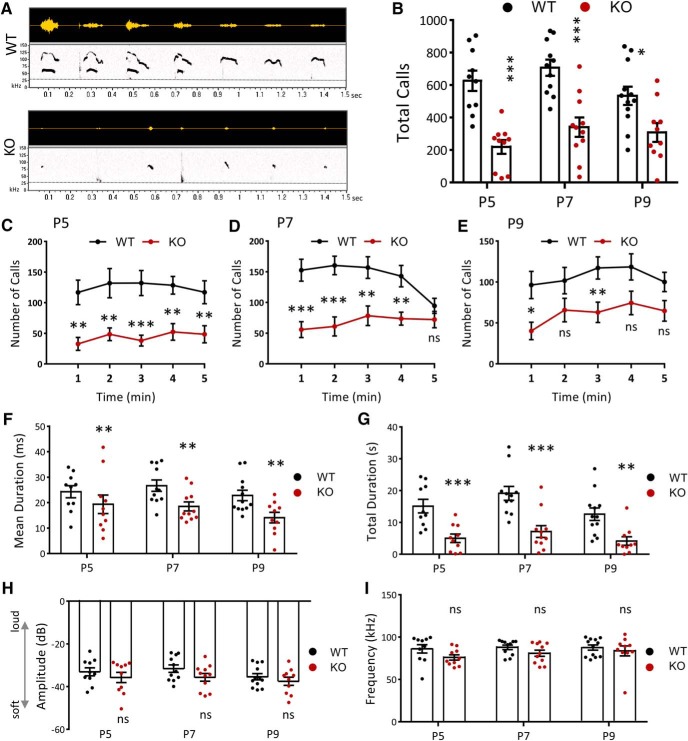
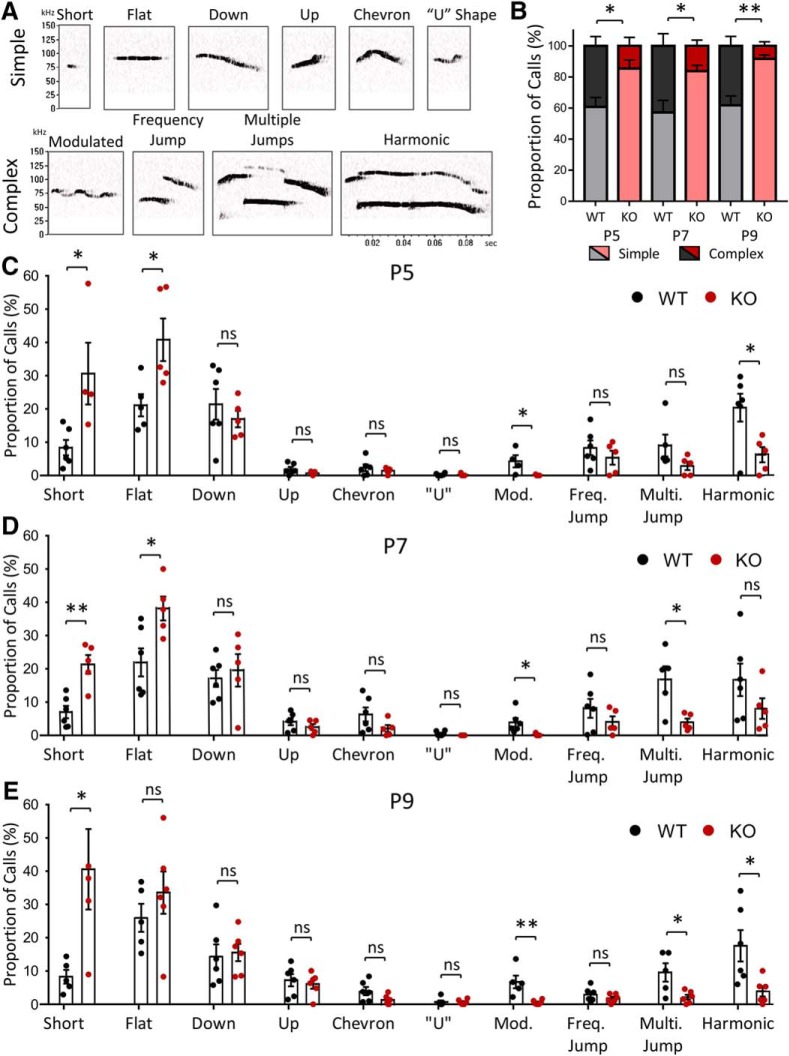
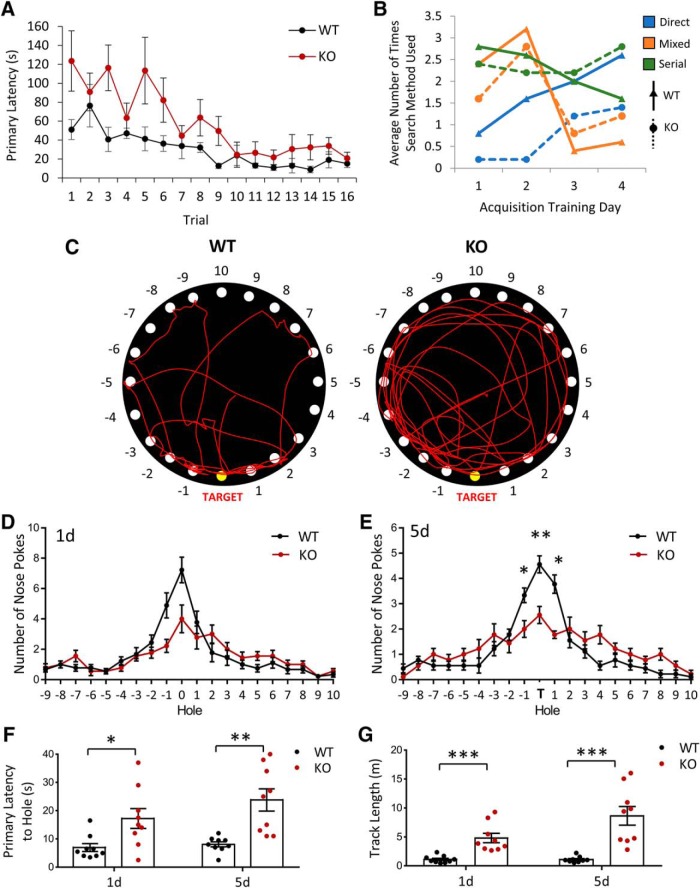
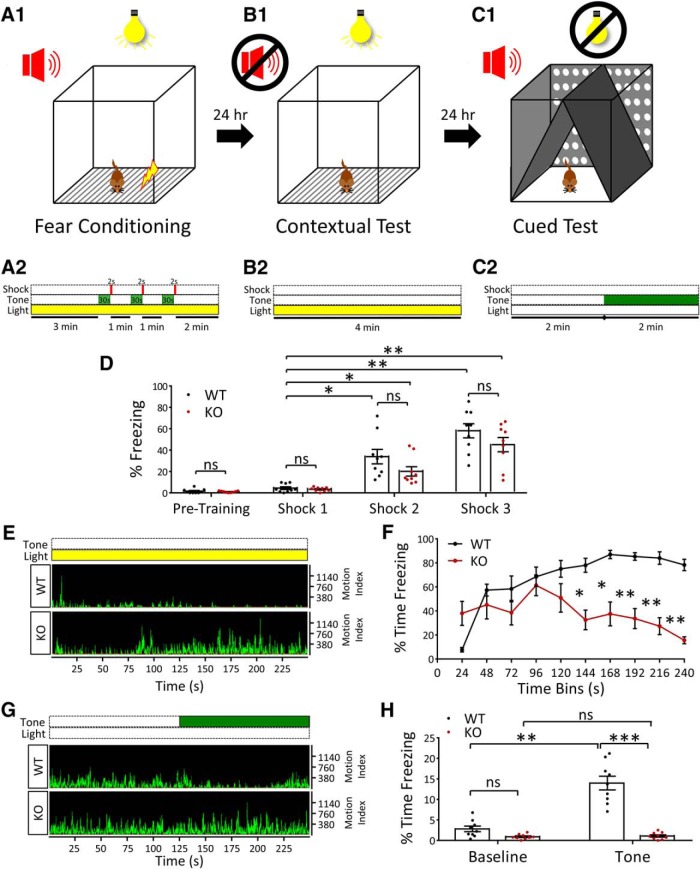
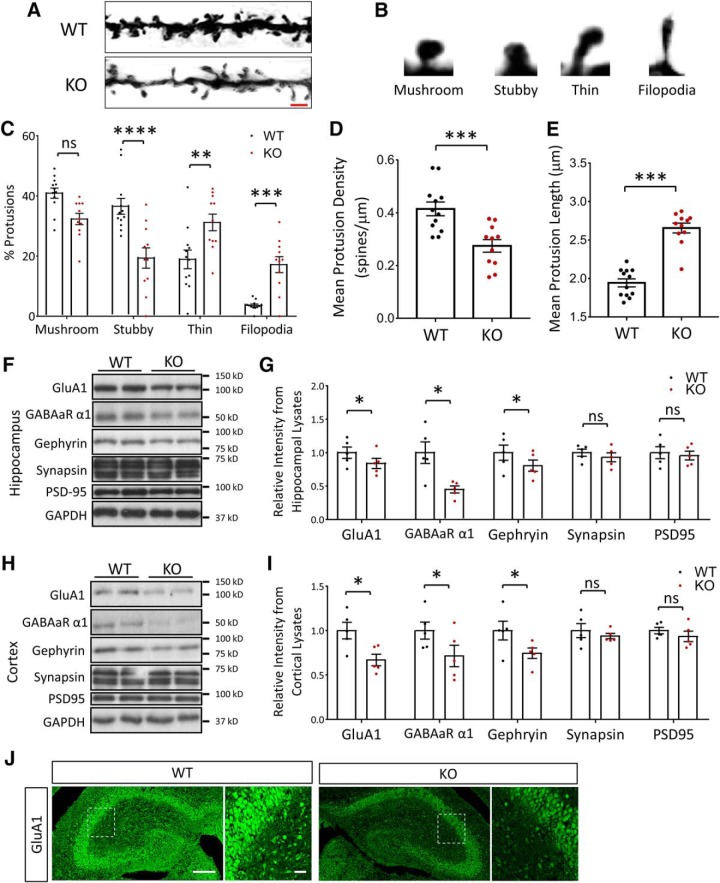
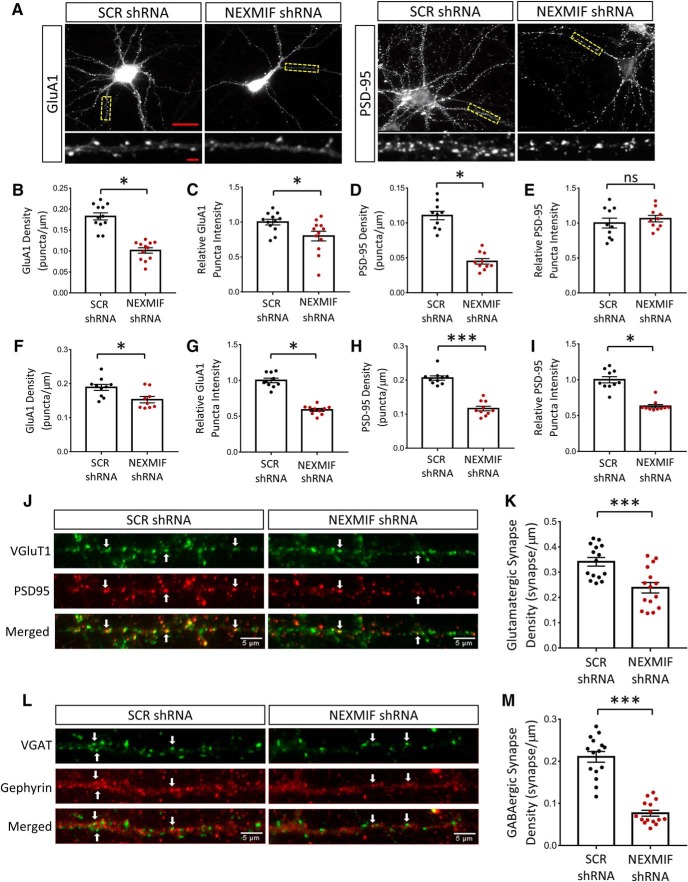
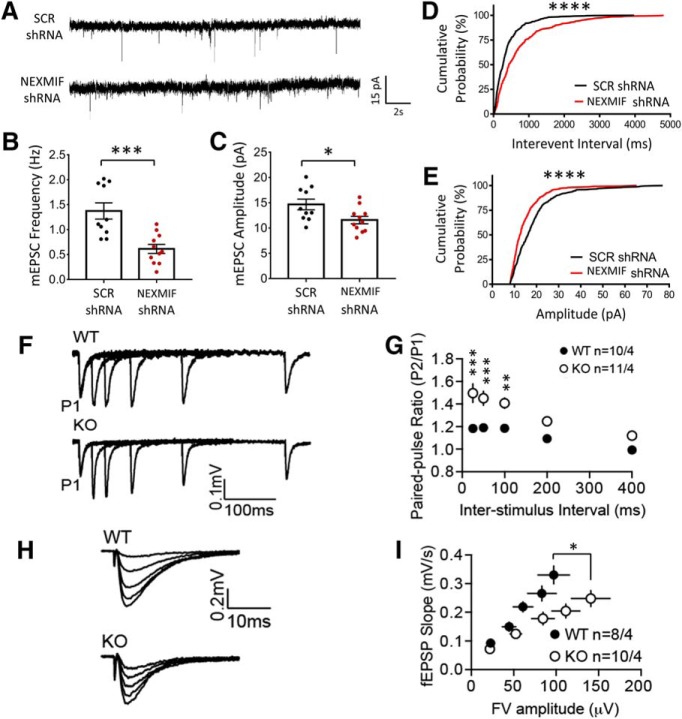
Autism spectrum disorder (ASD) is a heterogeneous neurodevelopmental disability that demonstrates impaired social interactions, communication deficits, and restrictive and repetitive behaviors. ASD has a strong genetic basis and many ASD-associated genes have been discovered thus far. Our previous work has shown that loss of expression of the X-linked gene NEXMIF/KIDLIA is implicated in patients with autistic features and intellectual disability (ID). To further determine the causal role of the gene in the disorder, and to understand the cellular and molecular mechanisms underlying the pathology, we have generated a NEXMIF knock-out (KO) mouse. We find that male NEXMIF KO mice demonstrate reduced sociability and communication, elevated repetitive grooming behavior, and deficits in learning and memory. Loss of NEXMIF/KIDLIA expression results in a significant decrease in synapse density and synaptic protein expression. Consistently, male KO animals show aberrant synaptic function as measured by excitatory miniatures and postsynaptic currents in the hippocampus. These findings indicate that NEXMIF KO mice recapitulate the phenotypes of the human disorder. The NEXMIF KO mouse model will be a valuable tool for studying the complex mechanisms involved in ASD and for the development of novel therapeutics for this disorder.SIGNIFICANCE STATEMENT Autism spectrum disorder (ASD) is a heterogeneous neurodevelopmental disorder characterized by behavioral phenotypes. Based on our previous work, which indicated the loss of NEXMIF/KIDLIA was associated with ASD, we generated NEXMIF knock-out (KO) mice. The NEXMIF KO mice demonstrate autism-like behaviors including deficits in social interaction, increased repetitive self-grooming, and impairments in communication and in learning and memory. The KO neurons show reduced synapse density and a suppression in synaptic transmission, indicating a role for NEXMIF in regulating synapse development and function. The NEXMIF KO mouse faithfully recapitulates the human disorder, and thus serves as an animal model for future investigation of the NEXMIF-dependent neurodevelopmental disorders.

Keywords: ASD; NEXMIF; autism spectrum disorder; brain development; synapse.


Figures

Figure 1.
Figure 1.
Molecular characterization of the NEXMIF KO mouse. A, NEXMIF expression was observed only in the nuclear fraction of wild-type mouse cortical lysates but not in cytoplasmic or KO animal lysates. B, Immunohistochemistry in P0 mouse cortical brain slices shows NEXMIF signal in the cortical plate from WT animals, with only background signal in brain slices from KO animals. Scale bar, 20 μm. CF, Cell density in cortex (C,D) or in hippocampus (E,F) was similar in KO and WT animals at P0. UpCP, Upper cortical plate; LoCp, lower cortical plate; IZ, intermediate zone; VZ, ventricular zone; CA1, cornu ammonis area 1; CA3, cornu ammonis area 3; DG, dentate gyrus. The yellow dashed line indicates the pia. Scale bars, 20 μm. Data are represented as average ± SEM. ns, Not significant. For post hoc power analyses, see Figure 1-1.
Figure 2.
Figure 2.
NEXMIF KO mice show impaired social behavior in the three-chamber social test. A, Habituation to the three-chamber apparatus. Mice were released from the center chamber, with empty cages in the adjacent chambers, and allowed to move freely within the apparatus for 5 min before beginning the sociability and social novelty tests. B, Traces of animal track paths in the habituation phase for WT and KO mice. C, Neither WT or KO animals showed any preference for either side chamber during habituation. D, Paradigm for the sociability test. An unfamiliar mouse (Mouse 1) was placed into either of the side chambers and the test mouse was allowed to move freely within the apparatus. E, Traces of animal track paths in the sociability test for WT and KO mice. F, Quantification of the preference index (see methods) showed a decrease in preference for Mouse 1 in NEXMIF KO animals compared with WT controls. G, Paradigm for the social novelty test. A second mouse (Novel Mouse) was placed into the remaining empty chamber opposite to Mouse 1, and the test mouse was allowed to interact with both mice. H, Traces of animal track paths in the social novelty test for WT and KO mice. I, In the social novelty test, KO animals showed no preference for the novel animal. Data are represented as average ± SEM. *p < 0.05; ***p < 0.001. ns, Not significant.
Figure 3.
Figure 3.
NEXMIF KO mice show decreased interest in the external environment and increased repetitive grooming behavior and hyperactivity. A, B, In the marble-burying test, KO animals buried significantly fewer marbles, indicating a decreased interest in the environment. C, D, NEXMIF KO mice showed increased time spent grooming and an increase in grooming episodes. E, Example of the resulting fur loss due to excessive grooming behavior in the KO animals. F, Track paths of WT and KO animals in the open-field test. GI, KO animals showed increased track lengths, increased mean velocities and decreased relative time in center in the open-field test. Data are represented as average ± SEM. *p < 0.05; **p < 0.01; ***p < 0.001. ns, Not significant.
Figure 4.
Figure 4.
NEXMIF KO mice show impairments in communication. A, Representative vocalizations from P7 recordings for WT and KO mice. Top, Raw USV signals. Bottom, Associated spectrograms; all are 1.5 s in length. Dashed line depicts the 30 kHz frequency threshold for eliminating noise. B, Quantification of the call rate shows a decrease in the number of calls made by NEXMIF KO animals compared with WT controls at each developmental time point recorded. CE, Mean number of calls emitted across the 5 min recording period at each developmental time point P5 (C: WT, n = 10; KO, n = 10), P7 (D: WT, n = 11; KO, n = 11), and P9 (E: WT, n = 12; KO, n = 11). F, G, NEXMIF KO mice showed a decreased mean call syllable duration (F) and a decrease in total time spent calling (G) at each time point. H, I, Quantification of the peak amplitude (H) and peak frequency (I) of calls shows no change between NEXMIF WT and KO animals at any time point. Data are represented as average ± SEM. *p < 0.05; **p < 0.01; ***p < 0.001. ns, Not significant.
Figure 5.
Figure 5.
Syllable classification of USV calls in NEXMIF mice. A, Representative calls of each type used in syllable characterization. B, KO animals showed an increase in Simple type calls and a decrease in Complex type calls compared with WT animals at each time point. C, Call syllable classification at P5 shows an increase in short and flat calls and a decrease in modulated and harmonic calls made by KO animals compared with WT animals. D, KO mice made significantly more short and flat calls compared with WT mice and significantly less modulated and multiple jump calls at P7. E, Call syllable classification at P9 shows an increase in short calls and decrease in modulated, multiple jump, and harmonic calls made by KO animals compared with WT animals. (WT, n = 6; KO, n = 5). Data are represented as average ± SEM. *p < 0.05; **p < 0.01. ns, Not significant.
Figure 6.
Figure 6.
NEXMIF KO mice show impairments in Barnes maze spatial learning and memory. A, Quantification of the primary latency (in seconds) to find the target hole across all training trials (4 trials per day over 4 d) for WT and KO animals. B, Quantification of the types of search strategies used for locating the target hole over the 4 training days. C, Traces of track paths in the Barnes spatial memory maze during the 5 d memory probe for WT and KO animals. D, Distribution of nose pokes on the board showed no difference 24 h after training. E, Quantification of the distribution of nose pokes across different holes on the board showed a significant decrease for the target and adjacent holes in the 5 d memory probe. F, G, Primary latency to the target hole (F) and total track length (G) were increased in the KO animals probing both 1 and 5 d after training Data are represented as average ± SEM. *p < 0.05; **p < 0.01; ***p < 0.001. ns, Not significant.
Figure 7.
Figure 7.
NEXMIF KO mice show impairments in fear conditioning learning and memory. AC, Paradigm used for fear conditioning, contextual and cued memory tests. On day 1 after habituation, animals were placed into the box (A1) and given three 2 s foot shocks after playing a 30 s tone (A2). On day 2, contextual memory was tested by placing animals into the same box (B1) with no tone played (B2). On day 3, the environment in the box was completely changed (C1) and animals were played the tone used during fear conditioning (C2). D, Quantification of freezing time in WT and KO animals before fear conditioning showed no freezing behavior and during the 30 s tones played during fear conditioning training showed that both WT and KO animals learned to associate the tone with the fear stimulus (foot shock). E, Representative motion indices during the contextual memory test for WT and KO animals. F, Quantification of the time spent freezing (%) throughout the contextual memory test. G, Representative motion indices during the cued memory test for WT and KO animals. H, Quantification of the time spent freezing (%) pretone (Baseline) and after playing the cue (Tone) during the cued memory test. Data are represented as average ± SEM. *p < 0.05; **p < 0.01; ***p < 0.001. ns, Not significant.
Figure 8.
Figure 8.
Altered spine morphology and synaptic protein composition in the NEXMIF KO mice. A, Golgi staining of spines from pyramidal neurons in P90 mouse hippocampus. Scale bar, 3 μm. B, Representative morphologies of the different dendritic protrusion types classified. C, Quantification of protrusion morphologies in WT and KO animals showed an increase in immature morphologies. D, E, Spine density (D) was decreased and spine length (E) increased in KO animals. F, Western blot of synaptic-related proteins from WT and NEXMIF KO hippocampus. G, Quantification of Western blot data from hippocampus showed a reduction in GluA1, GABAα1, gephyrin, no change in synapsin and no change in PSD-95 intensity. H, Western blot of synaptic-related proteins from WT and NEXMIF KO cortex. I, Quantification of Western blot data from cortex showed a reduction in GluA1, GABAα1, gephyrin, no change in synapsin and no change in PSD-95 intensity. J, Immunohistochemistry of KO and WT hippocampal brain slices at P0 shows a clear decrease in total GluA1 staining intensity Scale bars, 100 μm (full picture); 50 μm (enlarged area). Data are represented as average ± SEM. *p < 0.05; **p < 0.01; ***p < 0.001; ****p < 0.0001. ns, Not significant.
Figure 9.
Figure 9.
Altered synaptic protein composition in cultured neurons with shRNA-mediated NEXMIF knock-down. A, Representative images of immunohistochemistry for GluA1 and PSD-95 at DIV 15 in rat hippocampal cultures after infection with scrambled (SCR shRNA) or NEXMIF shRNA at DIV0. Scale bars, 15 μm (full picture); 5 μm (enlarged area). B, C, Quantification of GluA1 immunostaining in hippocampal neurons showing a decrease in puncta density and puncta intensity. D, E, Quantification of PSD-95 immunostaining in hippocampal neurons showing a decrease in PSD-95 density with no significant change in PSD-95 intensity. F, G, Quantification of GluA1 immunostaining in cortical neurons showing a decrease in puncta density and intensity from shRNA mediated NEXMIF knock-down. H, I, Quantification of PSD-95 immunostaining in cortical neurons showing a decrease in puncta density and intensity from shRNA mediated NEXMIF knock-down (n = 10 cells). J, Glutamatergic synapses were identified from colocalized VGluT1 and PSD95 puncta florescent signals. K, Quantification showing that shRNA-mediated NEXMIF knock-down resulted in a decrease in glutamatergic synapse density. L, GABAergic synapses were identified from colocalized VGAT and gephyrin puncta florescent signals. M, Quantification showing shRNA mediated NEXMIF knock-down resulted in a decrease in GABAergic synapse density. Examples of colocalization are marked by arrows (n = 15 cells). Data are represented as average ±SEM. *p < 0.05; ***p < 0.001. ns, Not significant.
Figure 10.
Figure 10.
Loss of NEXMIF results in altered synaptic transmission. A, mEPSC recordings from rat hippocampal neurons after infection with lentiviral scrambled (SCR shRNA) or NEXMIF shRNA, together with GFP. B, C, Quantification of mEPSC recordings showing a significant decrease in frequency and amplitude. D, E, Cumulative probability plots of mEPSCs showing a leftward shift in amplitude and a rightward shift in interevent interval for NEXMIF shRNA treated neurons. F, Representative traces from recordings performed in acute hippocampal slices from NEXMIF KO and WT mice to measure the paired-pulse ratio using an interstimulus interval of 25, 50, 100, 200, and 400 ms. G, Quantification of the paired-pulse ratio from recordings shown in I showed a significant increase in KO animals compared with WT controls (n = 10–11). H, Input/output curves from acute hippocampal slices from KO and WT hippocampal brain slices. Five stimulus intensities were chosen to elicit field excitatory postsynaptic responses. I, Quantification of the input/output curves showed that KO mice had a reduction in basal synaptic transmission compared with WT controls (n = 8–10). Data are represented as average ± SEM. *p < 0.05; **p < 0.01; ***p < 0.001; ****p < 0.0001.

Similar articles

Cited by

References

    1. Abrahams BS, Arking DE, Campbell DB, Mefford HC, Morrow EM, Weiss LA, Menashe I, Wadkins T, Banerjee-Basu S, Packer A (2013) SFARI Gene 2.0: a community-driven knowledgebase for the autism spectrum disorders (ASDs). Mol Autism 4:36. 10.1186/2040-2392-4-36 - DOI - PMC - PubMed
    1. Alarcon-Martinez T, Khan A, Myers KA (2019) Torpedo maculopathy associated with NEXMIF mutation. Mol Syndromol 10:229–233. 10.1159/000498835 - DOI - PMC - PubMed
    1. Allen Institute for Brain Science (2004) Allen Mouse Brain Alatas. Experiment 69531127, Gene C77370. Available at brain-map.org/api/index.html.
    1. Bagni C, Zukin RS (2019) A synaptic perspective of fragile X syndrome and autism spectrum disorders. Neuron 101:1070–1088. 10.1016/j.neuron.2019.02.041 - DOI - PMC - PubMed
    1. Baio J, Wiggins L, Christensen DL, Maenner MJ, Daniels J, Warren Z, Kurzius-Spencer M, Zahorodny W, Robinson Rosenberg C, White T, Durkin MS, Imm P, Nikolaou L, Yeargin-Allsopp M, Lee LC, Harrington R, Lopez M, Fitzgerald RT, Hewitt A, Pettygrove S, et al. (2018) Prevalence of autism spectrum disorder among children aged 8 years: autism and developmental disabilities monitoring network, 11 sites, United States, 2014. MMWR Surveill Summ 67:1–23. 10.15585/mmwr.ss6706a1 - DOI - PMC - PubMed

Publication types

MeSH terms