. 2020 Feb 3;217(2):e20191155.
doi: 10.1084/jem.20191155.

Extensive dissemination and intraclonal maturation of HIV Env vaccine-induced B cell responses

Affiliations

Extensive dissemination and intraclonal maturation of HIV Env vaccine-induced B cell responses

Ganesh E Phad et al. J Exp Med. .

Abstract

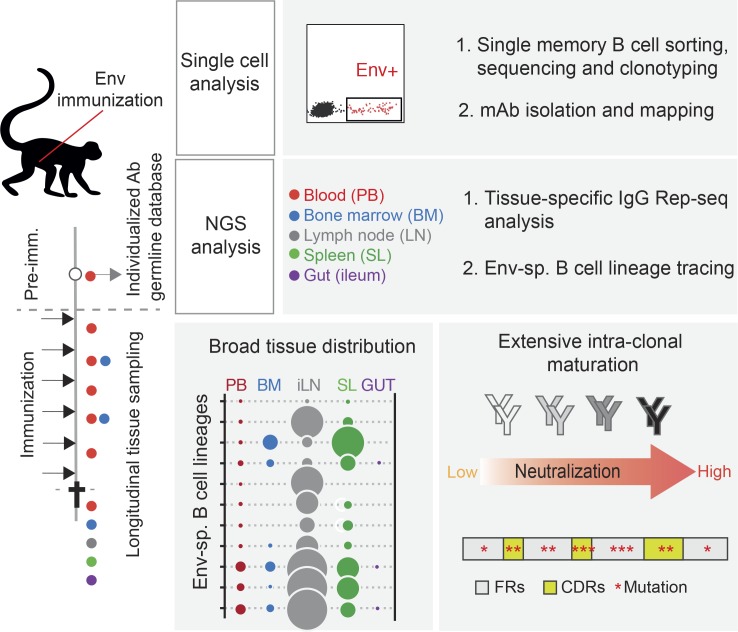
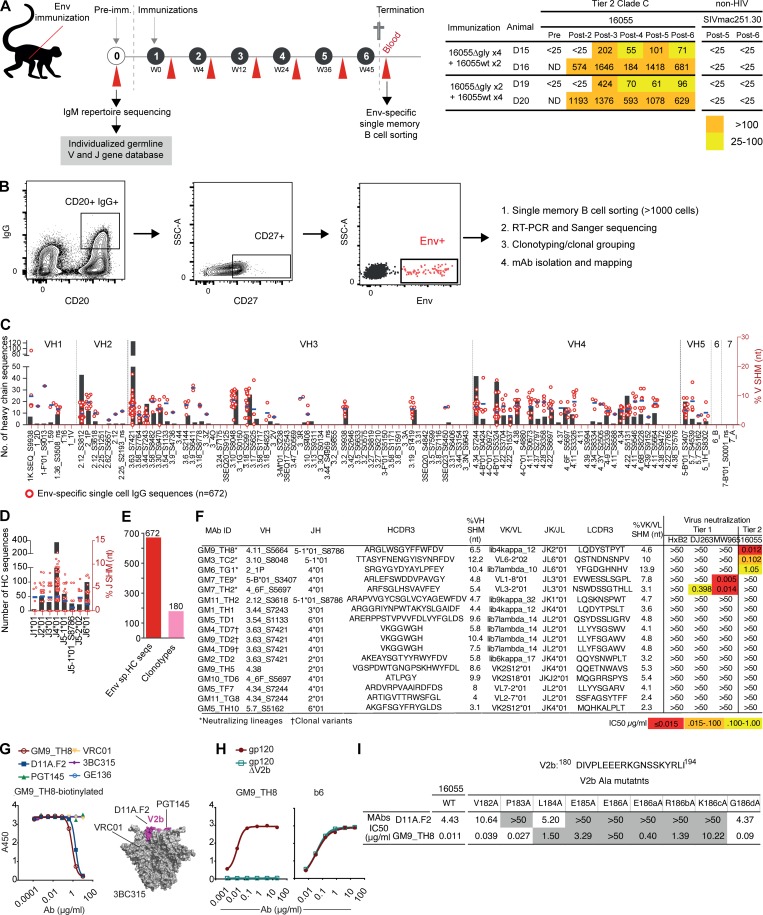
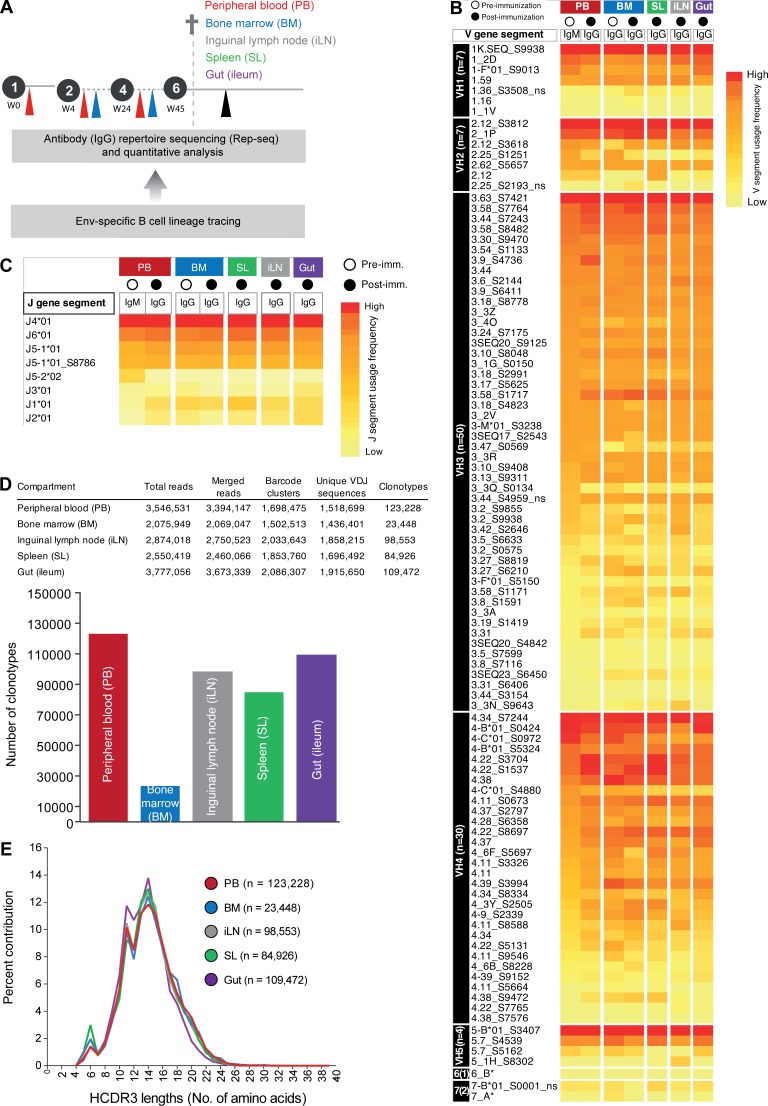
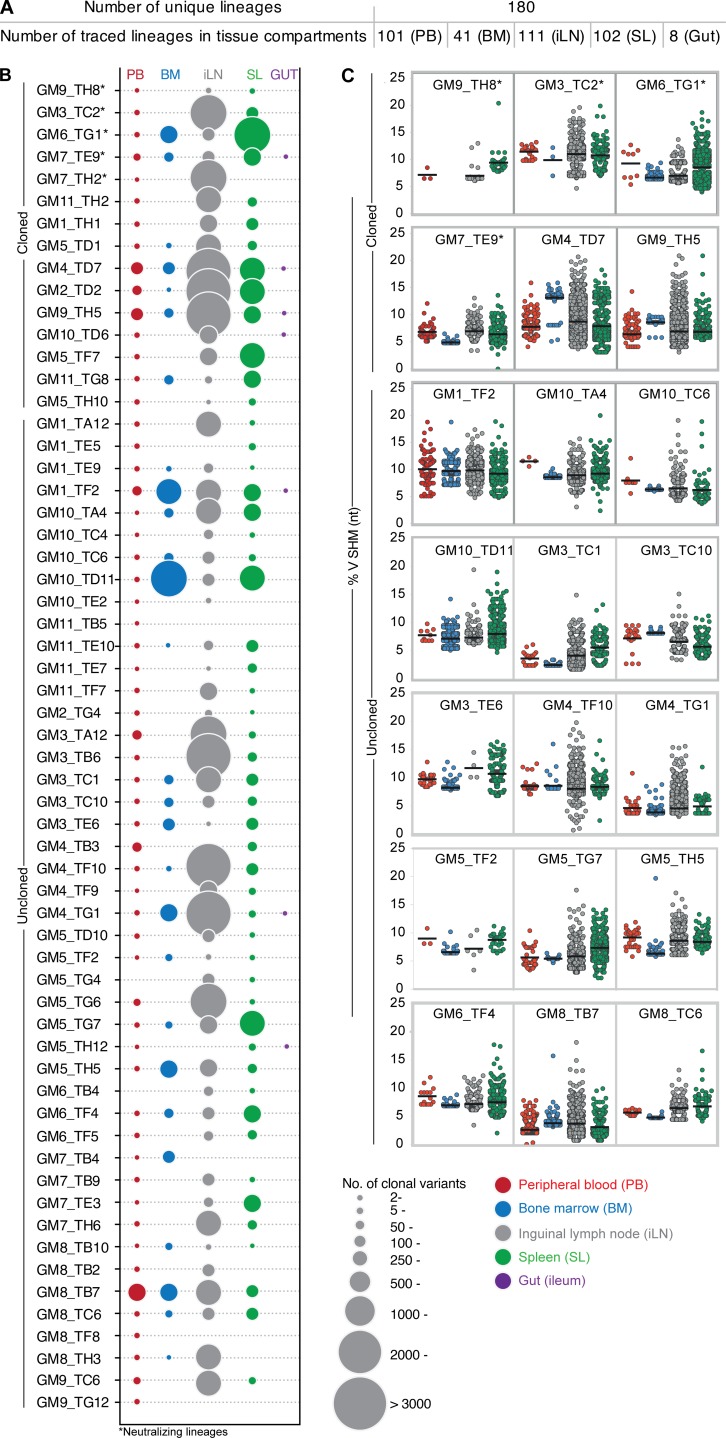
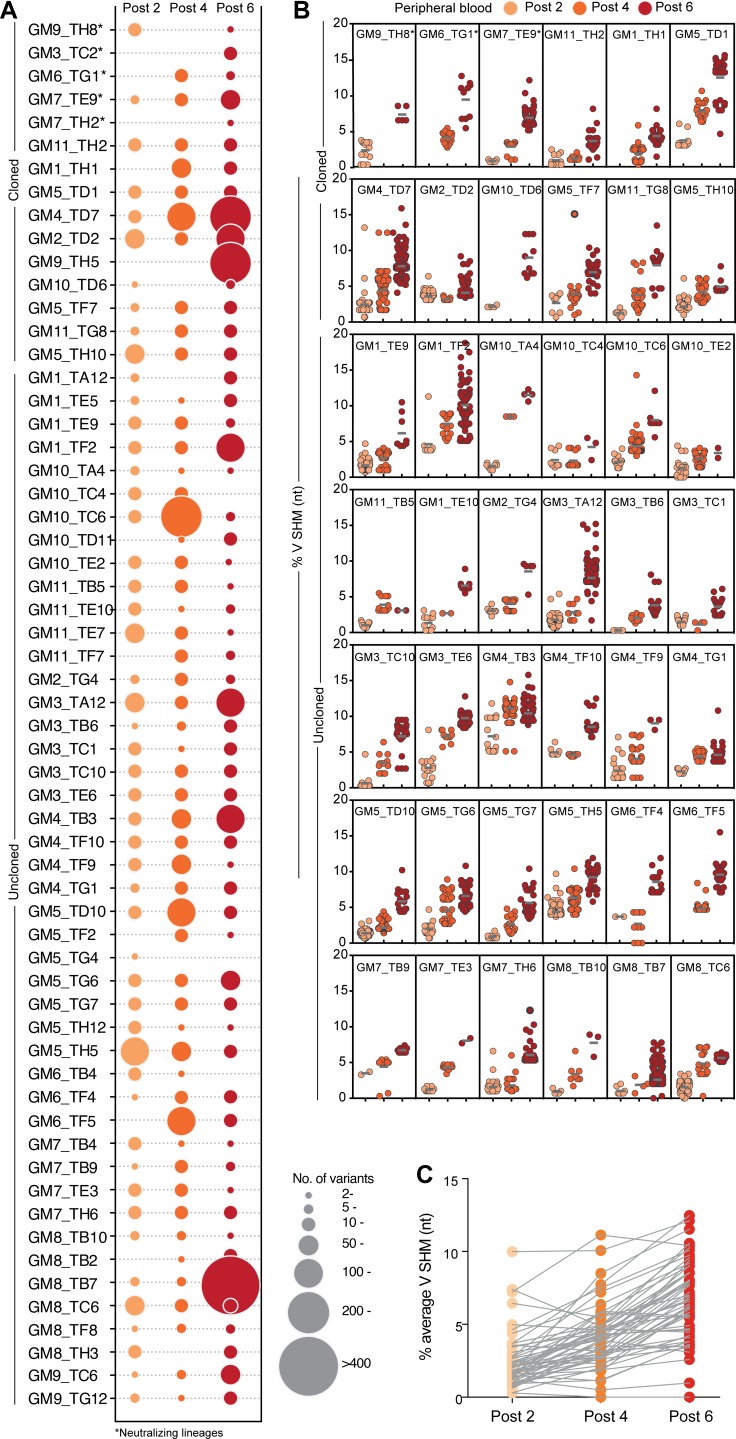
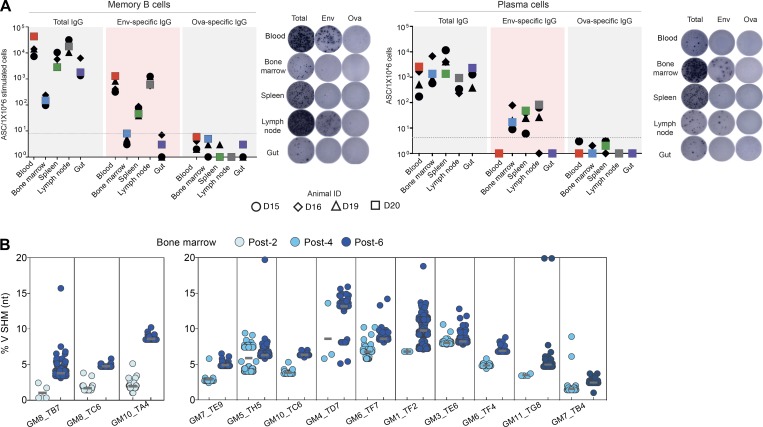
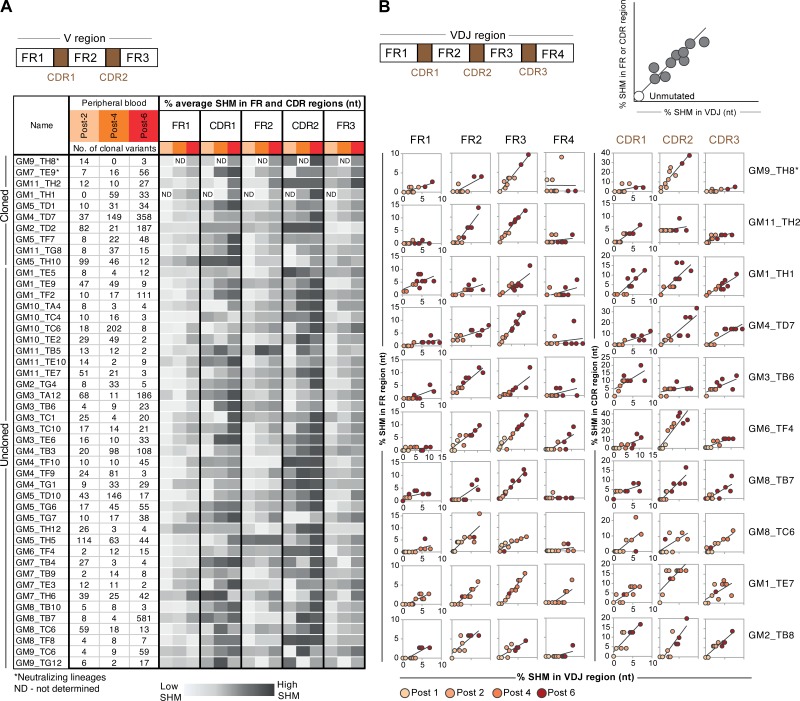
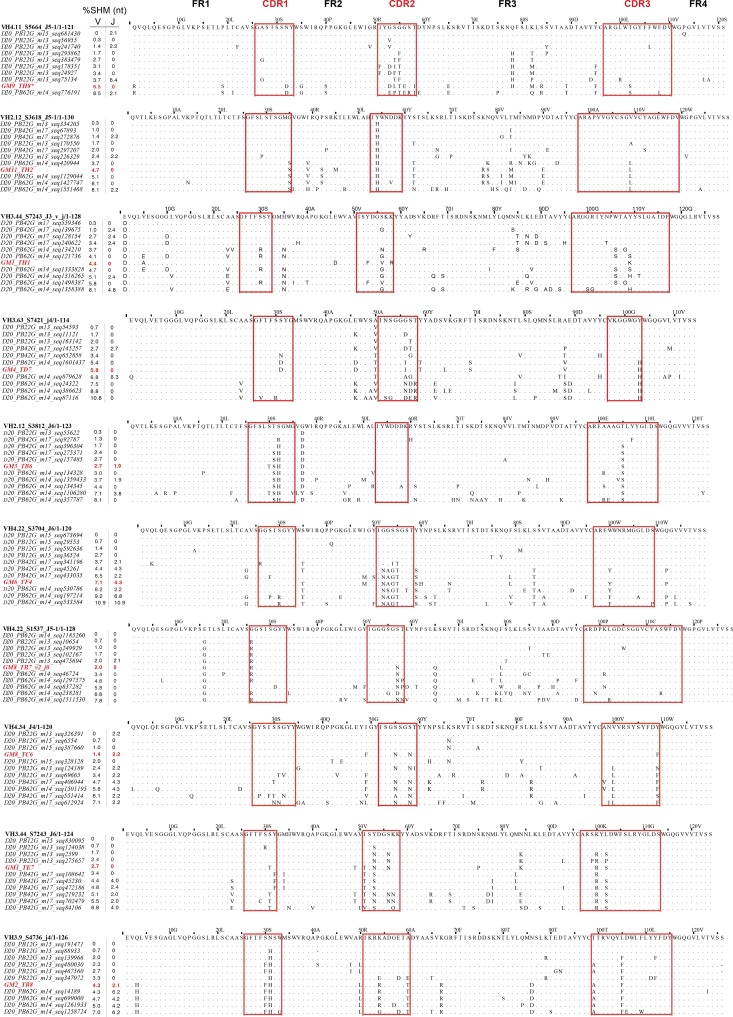
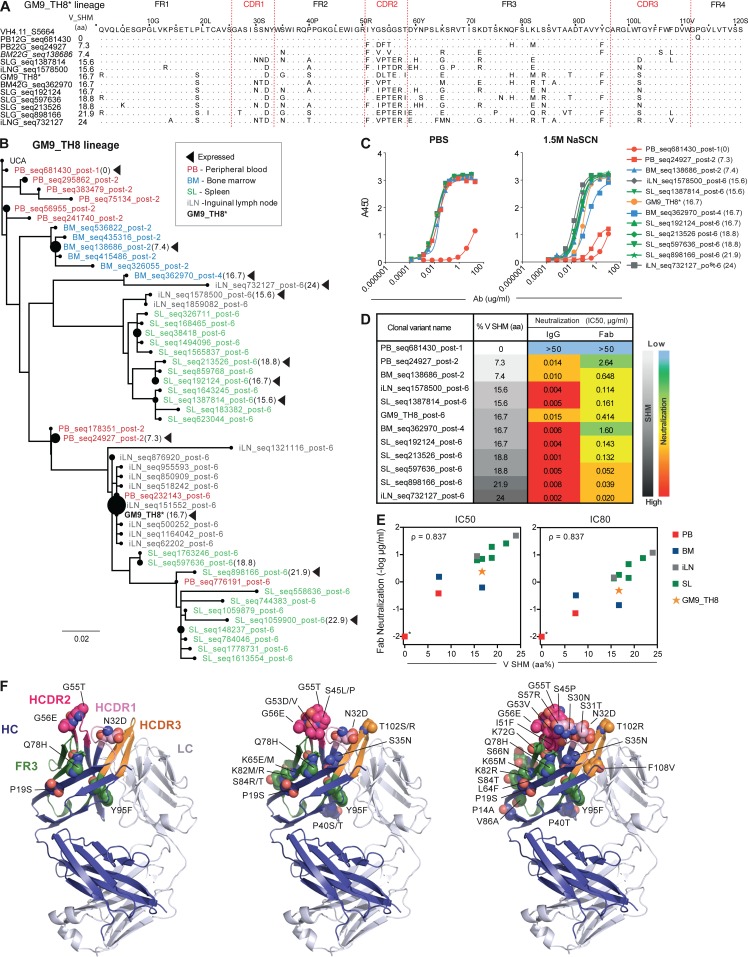
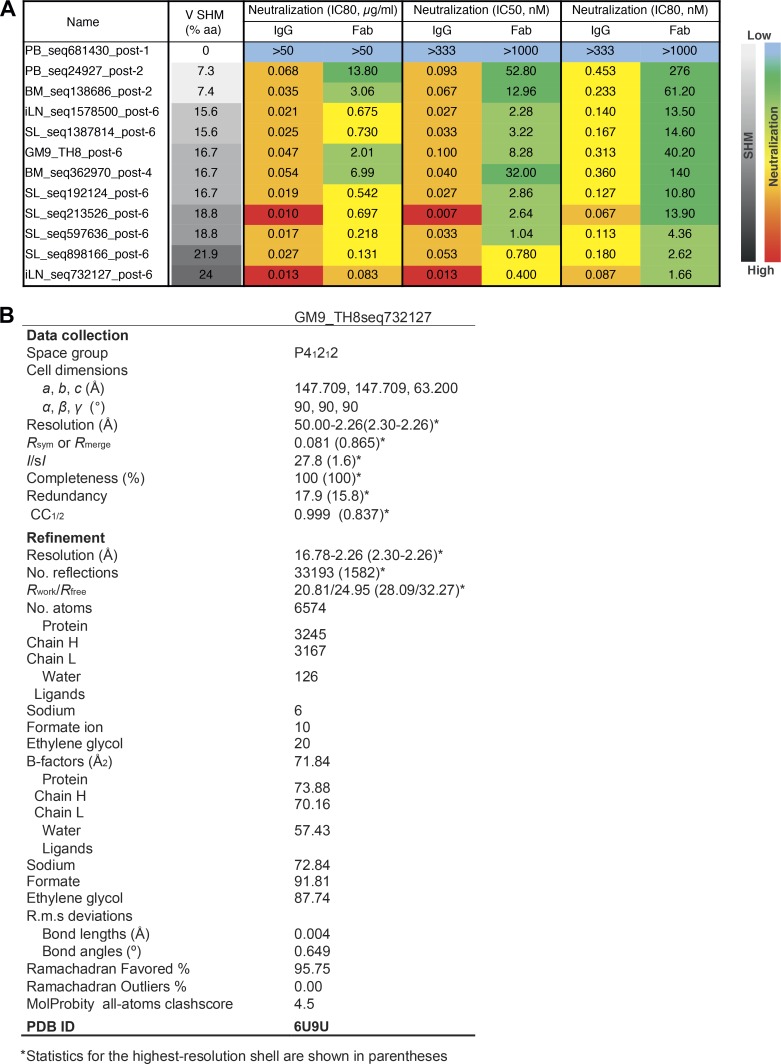
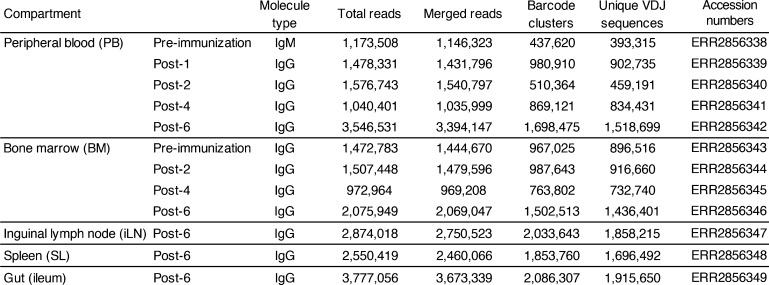
Well-ordered HIV-1 envelope glycoprotein (Env) trimers are prioritized for clinical evaluation, and there is a need for an improved understanding about how elicited B cell responses evolve following immunization. To accomplish this, we prime-boosted rhesus macaques with clade C NFL trimers and identified 180 unique Ab lineages from ∼1,000 single-sorted Env-specific memory B cells. We traced all lineages in high-throughput heavy chain (HC) repertoire (Rep-seq) data generated from multiple immune compartments and time points and expressed several as monoclonal Abs (mAbs). Our results revealed broad dissemination and high levels of somatic hypermutation (SHM) of most lineages, including tier 2 virus neutralizing lineages, following boosting. SHM was highest in the Ab complementarity determining regions (CDRs) but also surprisingly high in the framework regions (FRs), especially FR3. Our results demonstrate the capacity of the immune system to affinity-mature large numbers of Env-specific B cell lineages simultaneously, supporting the use of regimens consisting of repeated boosts to improve each Ab, even those belonging to less expanded lineages.


Figures

None
Graphical abstract
Figure 1.
Figure 1.
HIV-1 Env-specific Ab responses and memory B cell repertoire. (A) Overview of the immunization regimen. Chinese origin rhesus macaques (n = 4, from one independent experiment) were inoculated i.m. six times at weeks 0, 4, 12, 24, 36, and 45 with 16055 Env NFL trimers formulated in the Matrix-M adjuvant. Blood samples were collected before the first inoculation and 2 wk after each inoculation (left). Measurements of the plasma neutralizing titers against the 16055 virus identified D20 as the best responder animal (right; representative data from two independent experiments). (B) Single memory B cell sorting 2 wk after the sixth immunization. Approximately 1,000 single Env-specific IgG+ memory B cells were sorted for isolation of Ab HC sequences. For a subset of the cells, the matching LC was isolated for expression of the corresponding Env-specific mAbs (one independent experiment). (C and D) V and J gene assignments. The V and J gene usage of all full-length HC sequences (n = 672) is shown as black bars, with the level of SHM for each Ab sequence shown as superimposed red circles. The average SHM for each V or J gene at the nucleotide level is shown as blue bars. (E) Clonality of the Env-specific response. Applying a definition of clonal relatedness as HC sequences with the same V and J gene assignments, identical HCDR3 length and 80%* HCDR3 sequence identity to the 672 HC sequences (red bar) resulted in the identification of 180 Env-specific clonotypes (pink bar). (F) Genetic characteristics and IC50 neutralizing titers of Env-specific mAbs. Of the 17 cloned Env-specific mAbs, three neutralized the tier 2 isolate 16055, with the GM9_TH8 mAb being most potent (data from one independent experiment). (G) Binding of the biotinylated GM9_TH8 mAb to the 16055 NFL trimers (His-captured) in the presence of nonbiotinylated mAb competitors measured by ELISA. The GE136 mAb, a non–broadly neutralizing CD4bs-directed Ab (Sundling et al., 2012a), was used as a negative control (representative data from duplicate wells from two independent experiments). The trimer crystal structure (PDB: 5FYJ) shows the approximate epitope locations of the various mAbs as indicated. Residues corresponding to the V2b loop are shaded in magenta. (H) GM9_TH8 and b6 binding to 16055 gp120 and to a variant of gp120 lacking the V2b region (ΔV2b) as measured by ELISA. (I) Epitope specificity of the D11A.F2 and GM9_TH8 mAbs as measured by neutralizing activity (IC50, µg/ml) against a panel of Ala mutants along the V2b region compared with WT 16055. Mutations resulting in a significant loss of neutralization capacity (>30-fold) are shaded in gray.
Figure S1.
Figure S1.
Env-specific memory B cell sorting FACS gating and epitope specificity of the isolated mAbs. (A) Details from the Env-specific single memory B cell sorting, listing numbers and frequencies of the indicated cell populations. (B) Antigen-specific memory B cells were identified as live CD3CD14CD20+ IgG+CD27+Env+ cells as indicated by the FACS gating. The upper panels show preimmunization PBMCs from animal D20 serving as a negative control. The lower panel shows 16055 Env-specific single memory B cells from PBMCs isolated from D20 after the sixth immunization. The numbers indicate population frequencies from the parent gate (one independent experiment). FSC, forward scatter; SSC, side scatter. (C) List of IgDiscover-identified VH alleles in D20. (D) HCDR3 length distribution shown as the percentage of sequences with a given HCDR3 length of the total number Env-specific single cell sequences (n = 672; upper panel) and the number of clonotypes (n = 180; lower panel). (E) List of cloned mAbs with their epitope specificities and neutralizing activities indicated (left). ELISA binding of the mAbs to 16055 Env gp140 or gp120 (middle). ELISA binding of selected mAbs to WT 16055 gp120, gp120ΔV1, gp120ΔV1V2, gp120ΔV2b, and the 16055 V3 peptide (right; representative data from duplicate wells from two independent experiments).
Figure 2.
Figure 2.
VH and JH gene usage and clonality of Ab repertoires in different immune compartments. (A) Tissue sampling from D20. IgG HC libraries from blood, BM, draining iLN, spleen, and gut (ileum) were constructed and deep sequenced. (B and C) After processing, the sequences were assigned to the VH (B) and JH (C) germline alleles identified in the D20 animal. The genes are shown familywise (VH1–VH7), with the most frequently used VH (B) and JH (C) allele in each family, based on the IgM library, at the top. (D) Top: Sequencing metadata. Total reads, number of raw sequences generated using the MiSeq 2× 300-bp sequencing platform in libraries made from different tissue compartments; merged reads, number of paired sequences; barcode clusters, number of sequences after collapsing sequences with identical barcodes and HCDR3 into a single consensus sequence (including singletons); unique VDJ sequences, total number of uniquely barcoded in-frame Ab sequences; clonotypes, number of unique clonotypes defined as sequences with the same VH and JH gene assignments, identical HCDR3 length, and 80%* HCDR3 sequence identity, also depicted in the lower panel (data from one independent experiment). (E) HCDR3 length distribution shown as the percentage of sequences with a given HCDR3 length of the total number of clonotypes. The Next Generation Sequencing experiment was performed once, and the analyses, at least twice.
Figure 3.
Figure 3.
Clonal expansion, dissemination, and SHM at the post-6 time point in different immune compartments. (A) Number of variants traced in each immune compartment, defining a lineage as successfully traced when at least two clonally related variants were identified in the Rep-seq data (data from one independent experiment). (B) Bubble plot showing the relative distribution and expansion of Env-specific B cell lineages in blood (red), BM (blue), draining iLN (gray), spleen (green), and gut (ileum; purple). The sizes of the bubbles correspond to the number of somatic variants identified for each lineage (data from one independent experiment). (C) Intraclonal analysis of SHM shown as percentage divergence from the assigned germline V gene sequence at the nucleotide level. Each box shows one clonal lineage, with each variant of the lineage identified in the Rep-seq represented as one dot (data from one independent experiment). Data from Rep-seq libraries generated from blood (red), BM (blue), draining iLN (gray), and spleen (green). The experiment was performed once, and the analyses, at least twice.
Figure 4.
Figure 4.
Clonal expansion, dissemination, and SHM at different time points. (A) Bubble plot showing the relative expansion of representative Env-specific B cell lineages in Rep-seq data generated from blood after the second, fourth, or sixth immunizations. The sizes of the bubbles correspond to the number of somatic variants identified for each lineage (data from one independent experiment). (B) Intraclonal analysis of SHM shown as percentage divergence from the assigned germline V gene sequence at the nucleotide level. Each box shows one clonal lineage, with each variant of the lineage identified in the Rep-seq represented as one dot. Data from Rep-seq libraries generated from the blood post-2, post-4, and post-6 time points (data from one independent experiment). (C) Average V region SHM of all the variants identified at the different time points per Ab lineage. The experiment was performed once, and the analyses, at least twice.
Figure S3.
Figure S3.
B cell ELISpot analysis of the different immune compartments 2 wk after the sixth immunization and intraclonal SHM analysis of Ab lineages traced in the BM compartment. (A) B cell ELISpot assay was performed on PBMC, BM, LN, spleen, and gut samples collected from all four animals, with each symbol in the graph representing one rhesus macaque; D20 is highlighted in color. Total and antigen-specific memory B cells or IgG-secreting plasma cells were enumerated using two different B cell ELISpot formats: with prior in vitro stimulation to differentiate memory B cells into Ab-secreting cells or with direct plating to direct plasma cells present in the sample. Ovalbumin was used as a negative control antigen. The images on the right show representative ELISpot wells from the different samples, where each spot denotes one IgG-secreting cell. (B) Level of divergence from assigned germline VH gene sequence at the nucleotide level, shown for individual Env-specific B cell lineages. Each box shows one clonal lineage, with each variant of the lineage identified in the Rep-seq represented as one dot. Data from Rep-seq libraries generated from the BM post-2, post-4, and post-6 time points (representative data from one independent experiment analyzed at least twice).
Figure 5.
Figure 5.
SHM in FRs and CDRs. (A) Representative Env-specific lineages traced in the Rep-seq data generated from the blood post-2, post-4, and post-6 time points, with the number of identified somatic variants for each lineage indicated. The columns labeled FR1, CDR1, FR2, CDR2, and FR3 denotes the different subregions of the Ab V region. For every lineage, the percentage average SHM (nucleotide level) for each subregion was calculated from the number of variants identified at a given time point. The percentage average SHM for a given subregion from different time points is indicated with different shades, where darker and lighter gray correspond to higher and lower SHM levels, respectively (representative data from one independent experiment analyzed at least twice). (B) SHM (nucleotide level) in subregions (FR1–4 and CDR1–3) plotted relative to the total SHM in the corresponding full VDJ region (upper right schematic) for lineages where unmutated, or close to unmutated, sequences were identified in the Rep-seq data. Ten variants ranging from low to high SHM levels are shown for each lineage (representative data from one independent experiment analyzed at least twice).
Figure S4.
Figure S4.
Alignments of variants displaying increasing SHM for subset of Ab lineages found in blood. Env-specific Ab HC sequences (red) were aligned to 10 somatic variants, each ranging from low to high SHM. The top row shows the inferred germline sequence of each HC, where the VD and DJ junctions were determined based on the least-mutated variant found in the blood Rep-seq data for each lineage.
Figure 6.
Figure 6.
Impact of SHM on the neutralizing capacity of GM9_TH8 lineage. (A) The alignment of 11 HC somatic variants of GM9_TH8 lineage selected from multiple immune compartments, in addition to the HC of cloned GM9_TH8 mAb, with levels of SHM ranging from 0 to 24% at the amino acid level. The top row shows the inferred germline sequence of HC, where the VD and DJ junctions were determined based on the least-mutated variant found in the blood Rep-seq data. (B) Maximum likelihood phylogenetic tree showing HC sequences from the GM9_TH8 lineage with the 12 expressed GM9_TH8 variants (representative data from two independent experiments) indicated with arrows. (C) Binding curves for each of the 12 GM9_TH8 variants analyzed in conventional ELISA (PBS) or in the presence of high salt (NaSCN; representative data from duplicate wells from two independent experiments). (D) Autologous tier 2 neutralizing activity of the 12 GM9_TH8 variants as IgG or Fab shown in the order of increasing SHM (data from one independent experiment). (E) Scatter plots of SHM versus Fab neutralizing activity (IC50 or IC80) were generated, and the Spearman rank correlation coefficient (ρ) was computed using Prism software (GraphPad, v7; ρ = 0.837). Asterisk indicates that the non-neutralizing PB_seq681430_post-1 Ab was assigned IC50 and IC80 values of 100 for the purpose of the calculation. Data points are color-coded according to compartment. The analyses of Ab function were performed twice. (F) Representation of the GM9_TH8seq732127 Fab structure. LC is shown in light blue/gray and HC in dark blue, with HCDR1 in pink, HCDR2 in magenta, HCDR3 in orange, and FR3 in green. Mutated residues are shown in spheres and labeled. Left: Shared SHM between the GM9_TH8 HC and the GM9_TH8seq732127 HC. Middle: SHM at the same position but mutated to a different aa residue for GM9_TH8 (first letter) compared to GM9_TH8seq732127 (second letter). Right: All SHM in the GM9_TH8seq732127 HC.
Figure S5.
Figure S5.
Autologous tier 2 neutralizing Ab titers and data collection and refinement statistics for the structural analysis of GM9_TH8seq732127. (A) Autologous 16055 tier 2 neutralizing activity of the 12 GM9_TH8 variants as IgG or Fabs, shown in the order of increasing SHM (data from one independent experiment). (B) Data collection and refinement statistics for the GM9_TH8eq732127 Fab. Statistics for the highest-resolution shell are shown in parentheses (data from one independent experiment).
Figure S2.
Figure S2.
Ab repertoire sequencing metadata. Total reads, number of raw sequences generated using MiSeqs 2X300bp sequencing platform from different tissue compartments and time points from animal D20; merged reads, number of paired sequences; barcode clusters, number of sequences after collapsing sequences with identical barcodes and HCDR3 into a single consensus sequence (including singletons); unique VDJ sequences, total number of uniquely barcoded in-frame Ab sequences (data from one independent experiment).

Similar articles

Cited by

References

    1. Adams P.D., Afonine P.V., Bunkóczi G., Chen V.B., Davis I.W., Echols N., Headd J.J., Hung L.W., Kapral G.J., Grosse-Kunstleve R.W., et al. . 2010. PHENIX: a comprehensive Python-based system for macromolecular structure solution. Acta Crystallogr. D Biol. Crystallogr. 66:213–221. 10.1107/S0907444909052925 - DOI - PMC - PubMed
    1. Bonsignori M., Zhou T., Sheng Z., Chen L., Gao F., Joyce M.G., Ozorowski G., Chuang G.Y., Schramm C.A., Wiehe K., et al. . NISC Comparative Sequencing Program . 2016. Maturation Pathway from Germline to Broad HIV-1 Neutralizer of a CD4-Mimic Antibody. Cell. 165:449–463. 10.1016/j.cell.2016.02.022 - DOI - PMC - PubMed
    1. Cirelli K.M., Carnathan D.G., Nogal B., Martin J.T., Rodriguez O.L., Upadhyay A.A., Enemuo C.A., Gebru E.H., Choe Y., Viviano F., et al. . 2019. Slow Delivery Immunization Enhances HIV Neutralizing Antibody and Germinal Center Responses via Modulation of Immunodominance. Cell. 177:1153–1171.e28. 10.1016/j.cell.2019.04.012 - DOI - PMC - PubMed
    1. Collaborative Computational Project, Number 4 1994. The CCP4 suite: programs for protein crystallography. Acta Crystallogr. D Biol. Crystallogr. 50:760–763. 10.1107/S0907444994003112 - DOI - PubMed
    1. Corcoran M.M., Phad G.E., Vázquez Bernat N., Stahl-Hennig C., Sumida N., Persson M.A., Martin M., and Karlsson Hedestam G.B.. 2016. Production of individualized V gene databases reveals high levels of immunoglobulin genetic diversity. Nat. Commun. 7:13642 10.1038/ncomms13642 - DOI - PMC - PubMed

Publication types

MeSH terms

Substances