. 2020 Jan 15;80(2):334-346.
doi: 10.1158/0008-5472.CAN-19-1161. Epub 2019 Nov 8.

CoA Synthase (COASY) Mediates Radiation Resistance via PI3K Signaling in Rectal Cancer

Affiliations

CoA Synthase (COASY) Mediates Radiation Resistance via PI3K Signaling in Rectal Cancer

Sylvain Ferrandon et al. Cancer Res. .

Abstract

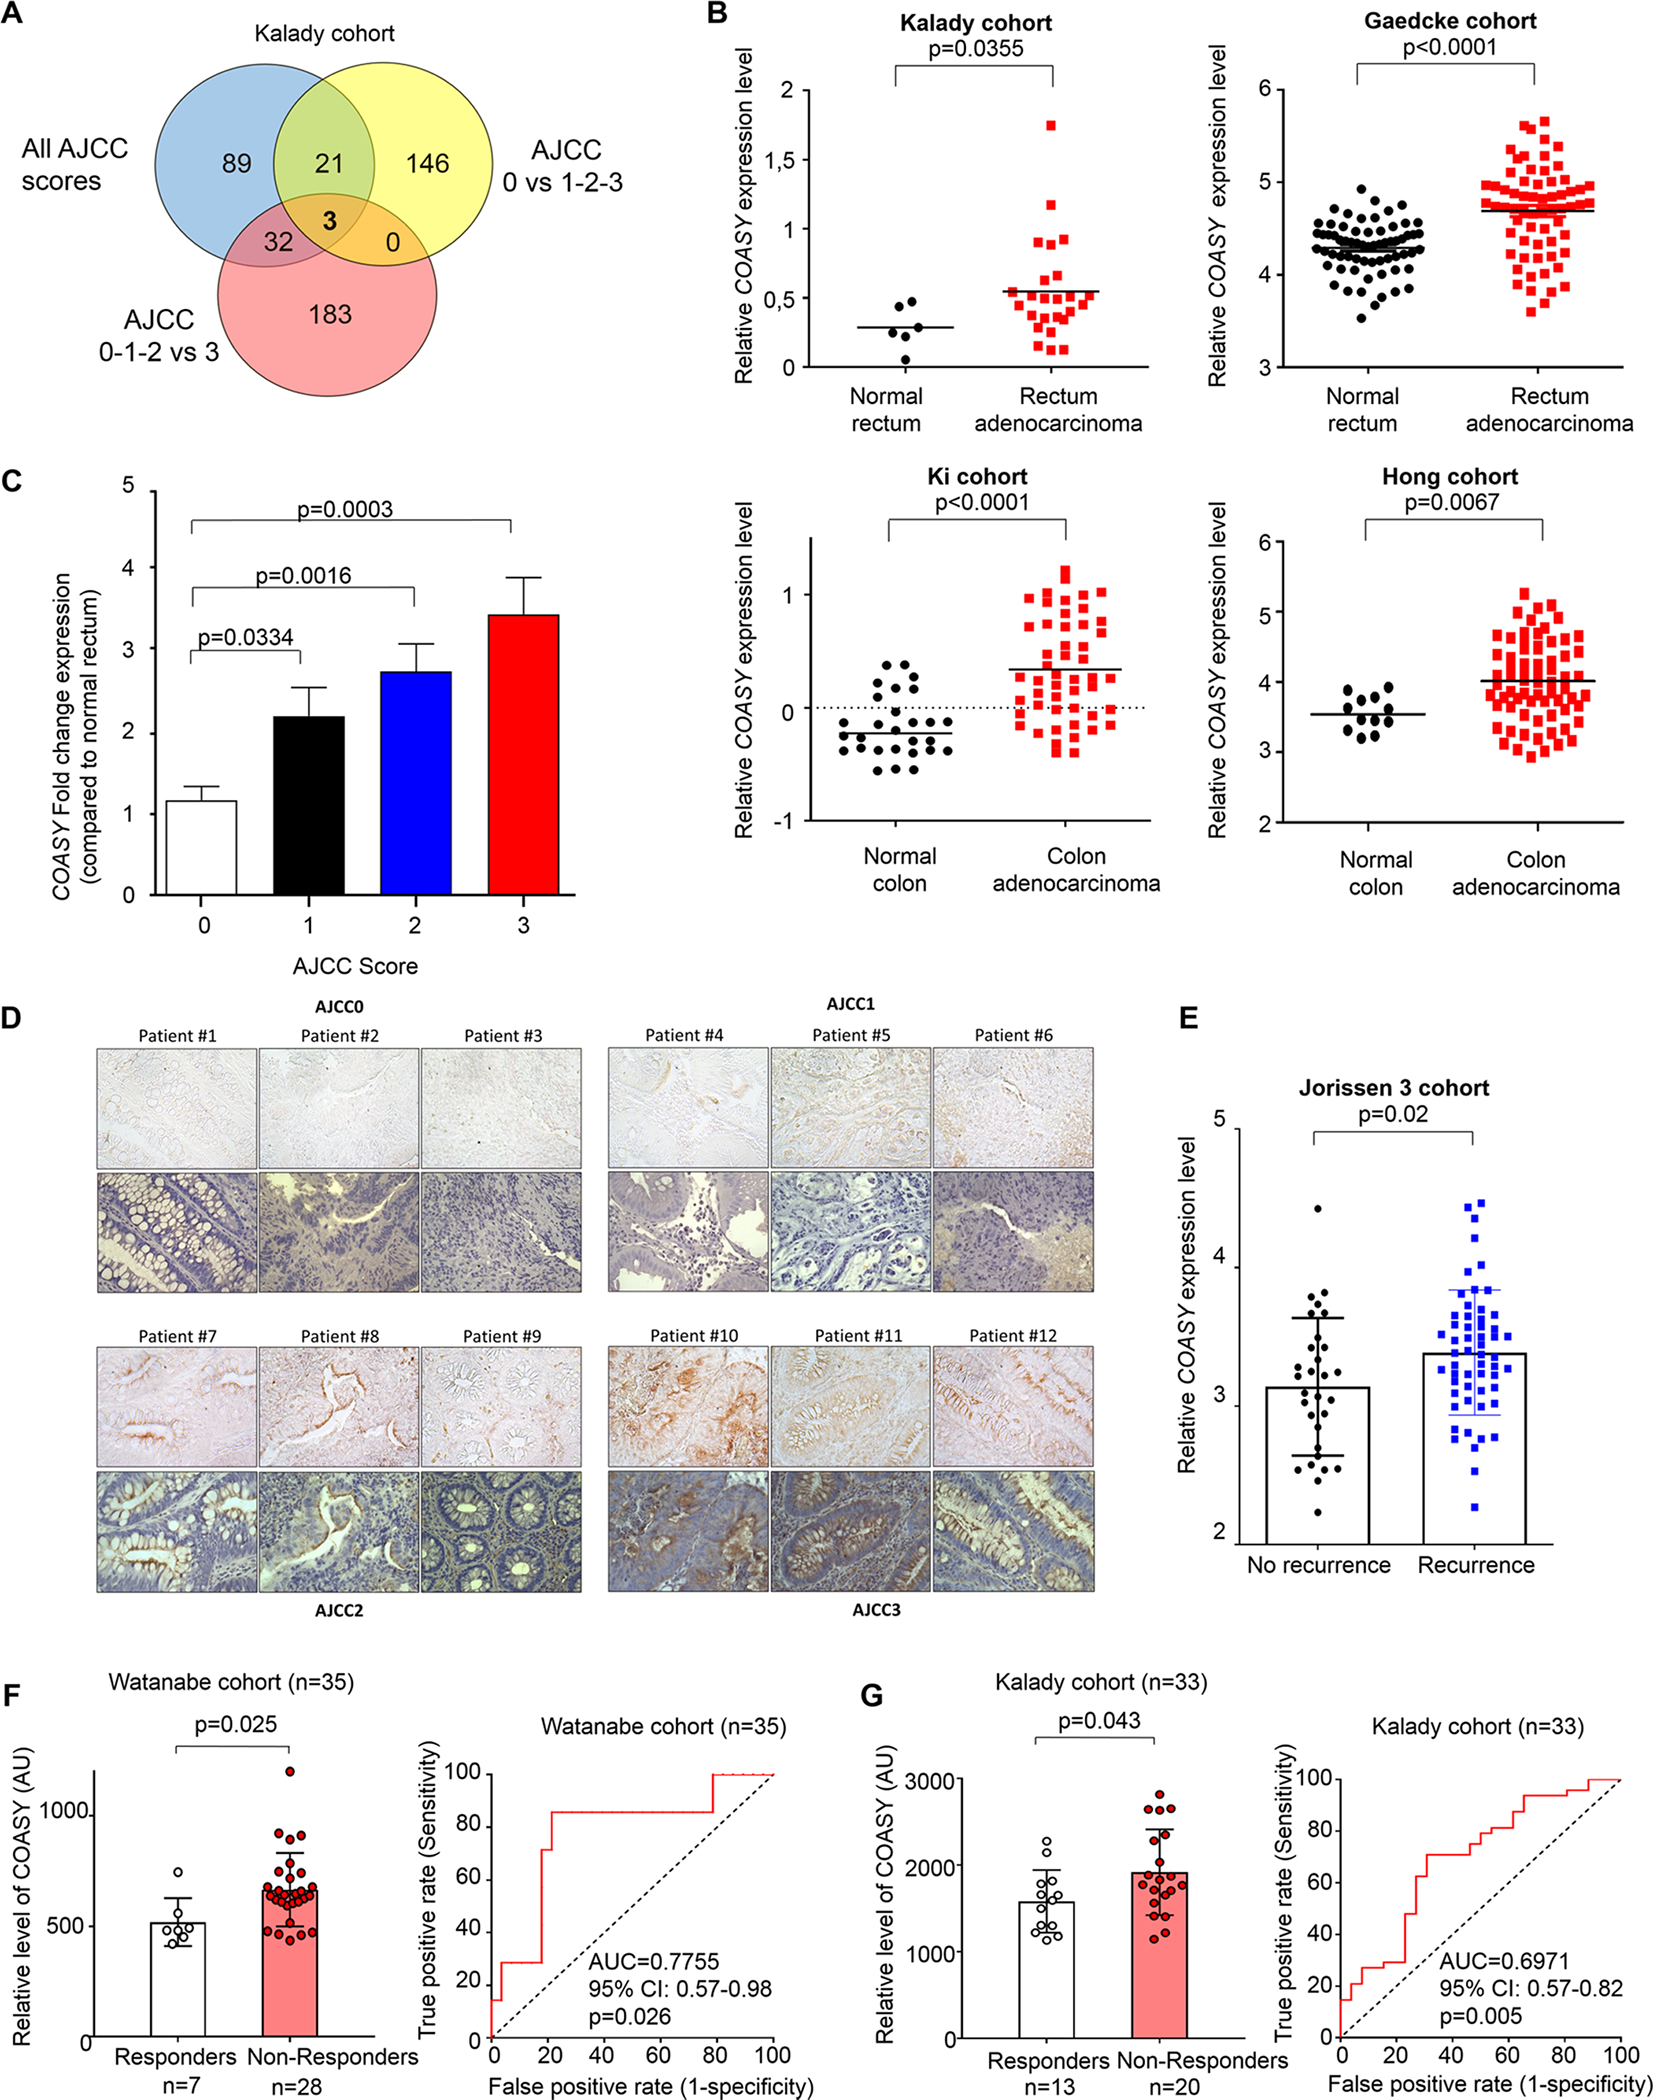
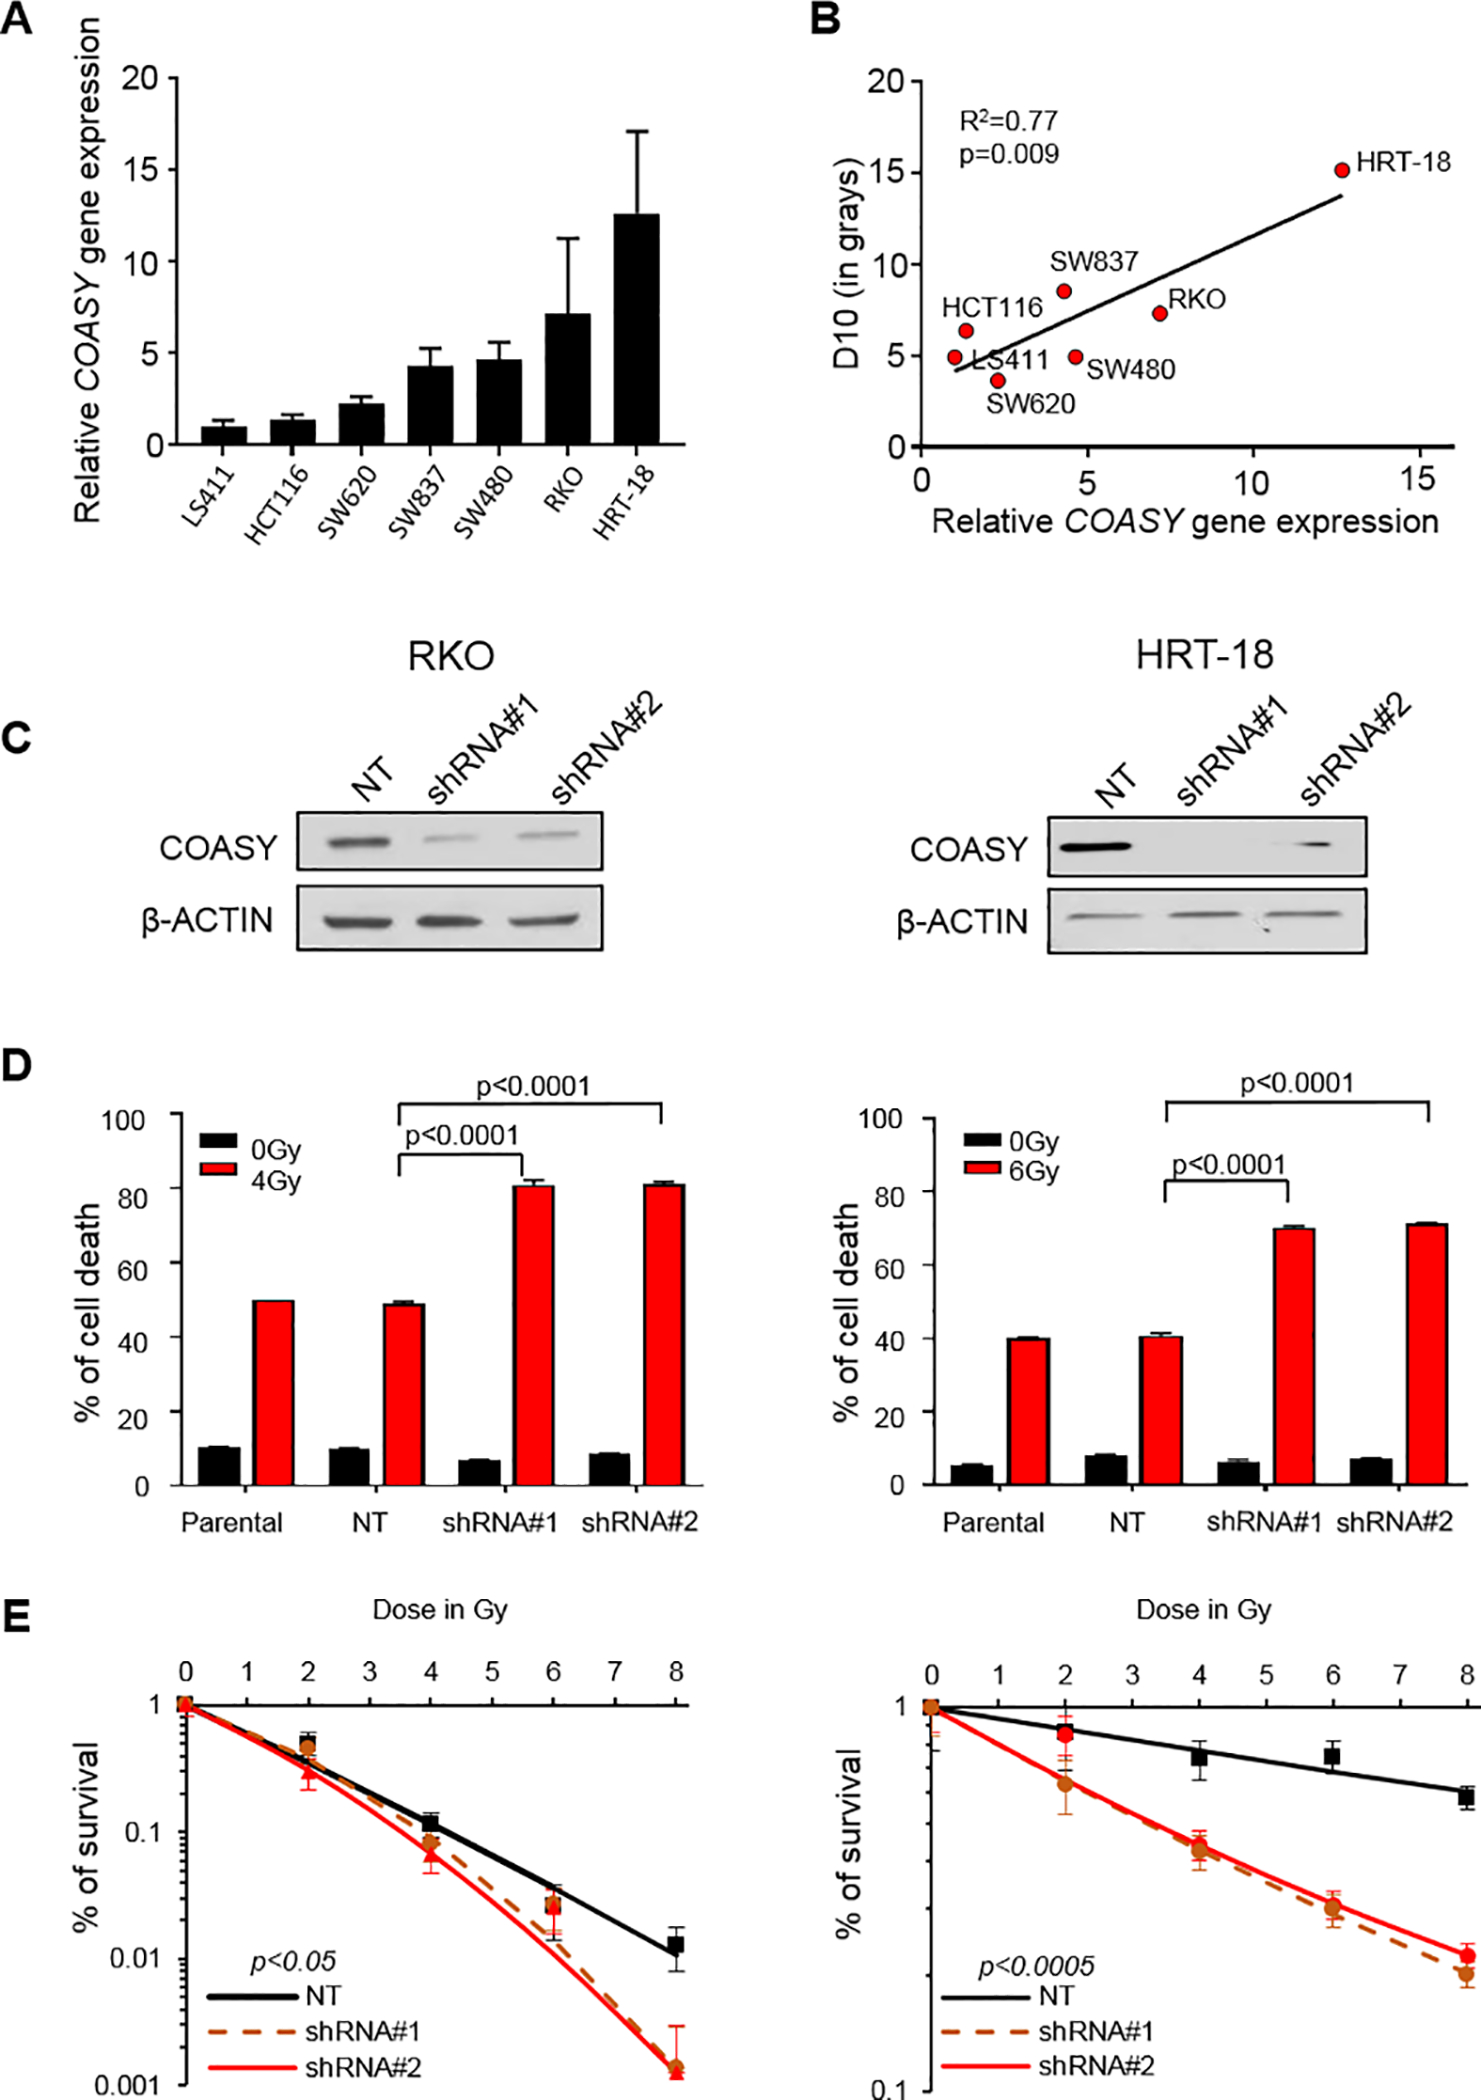
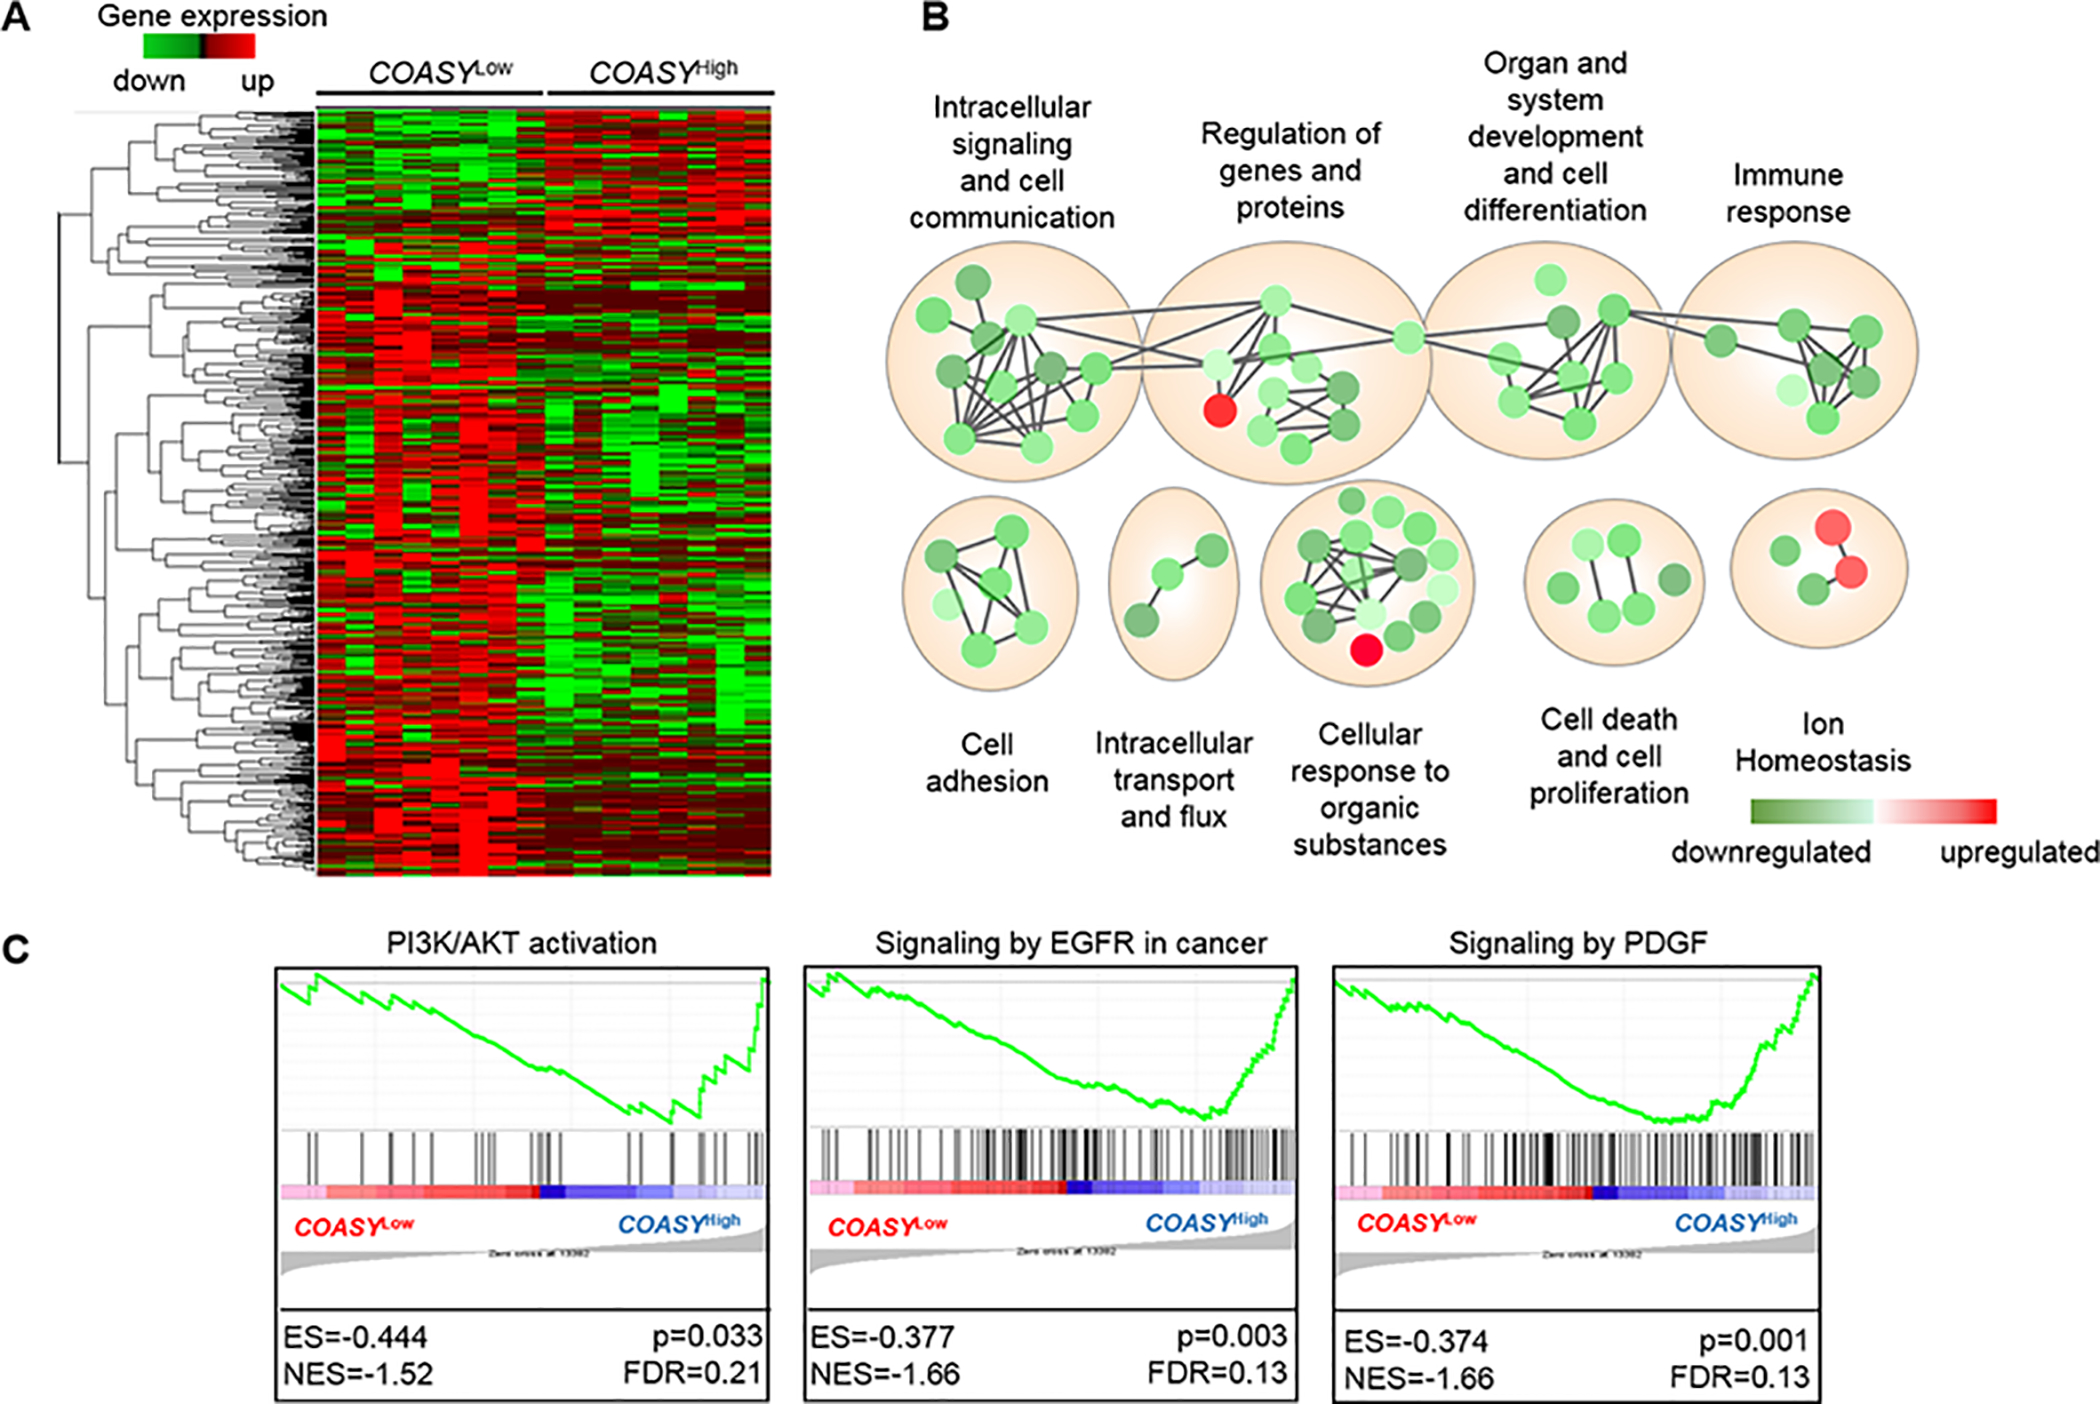
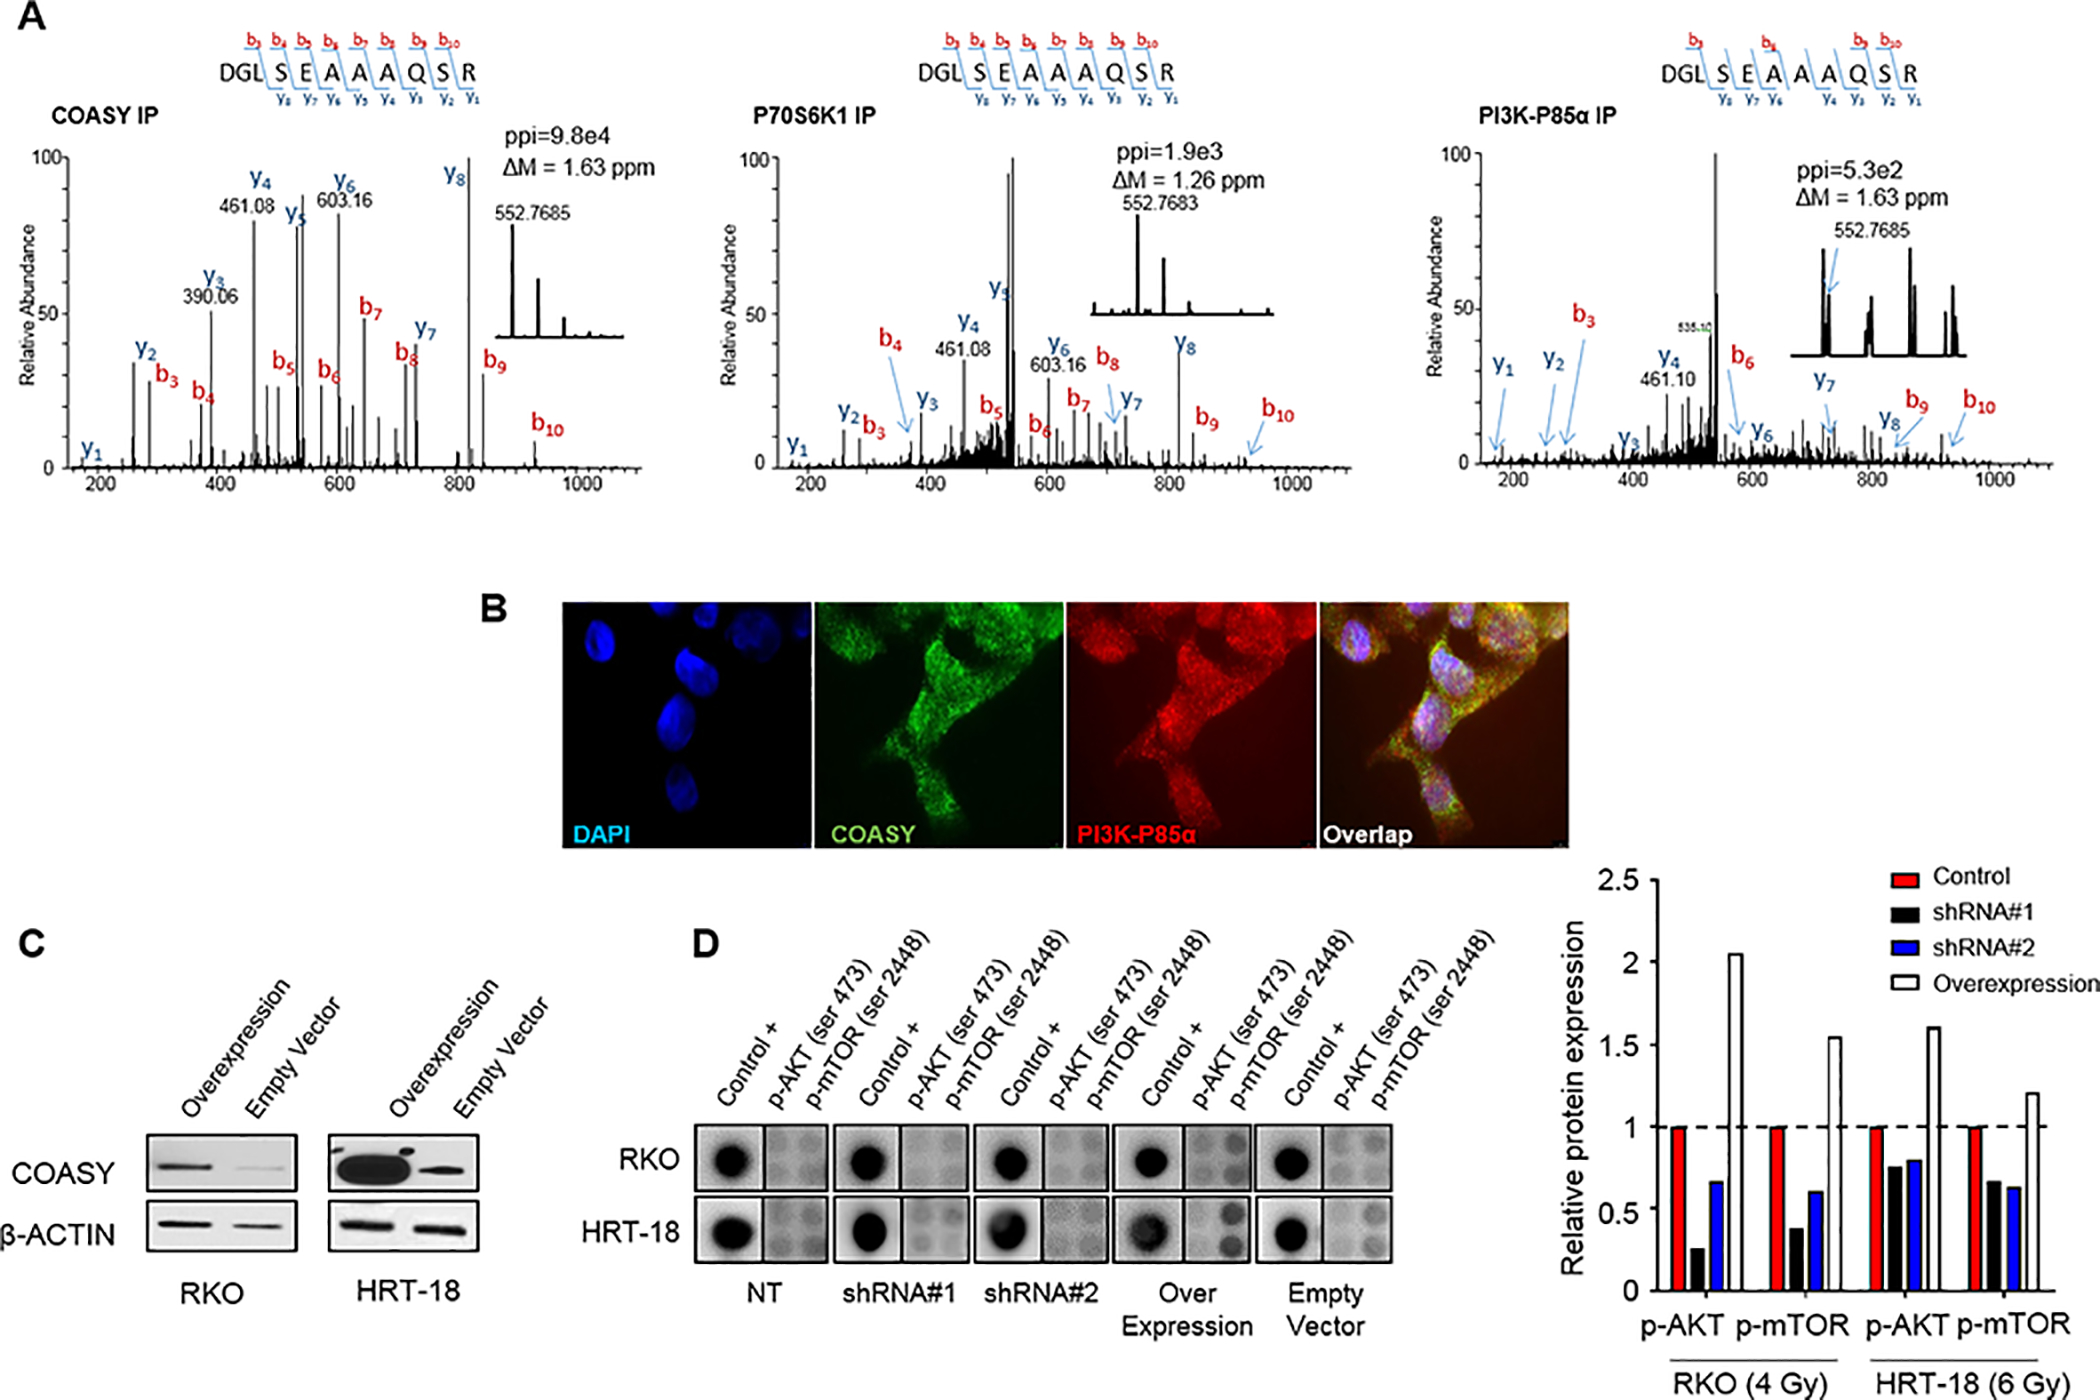
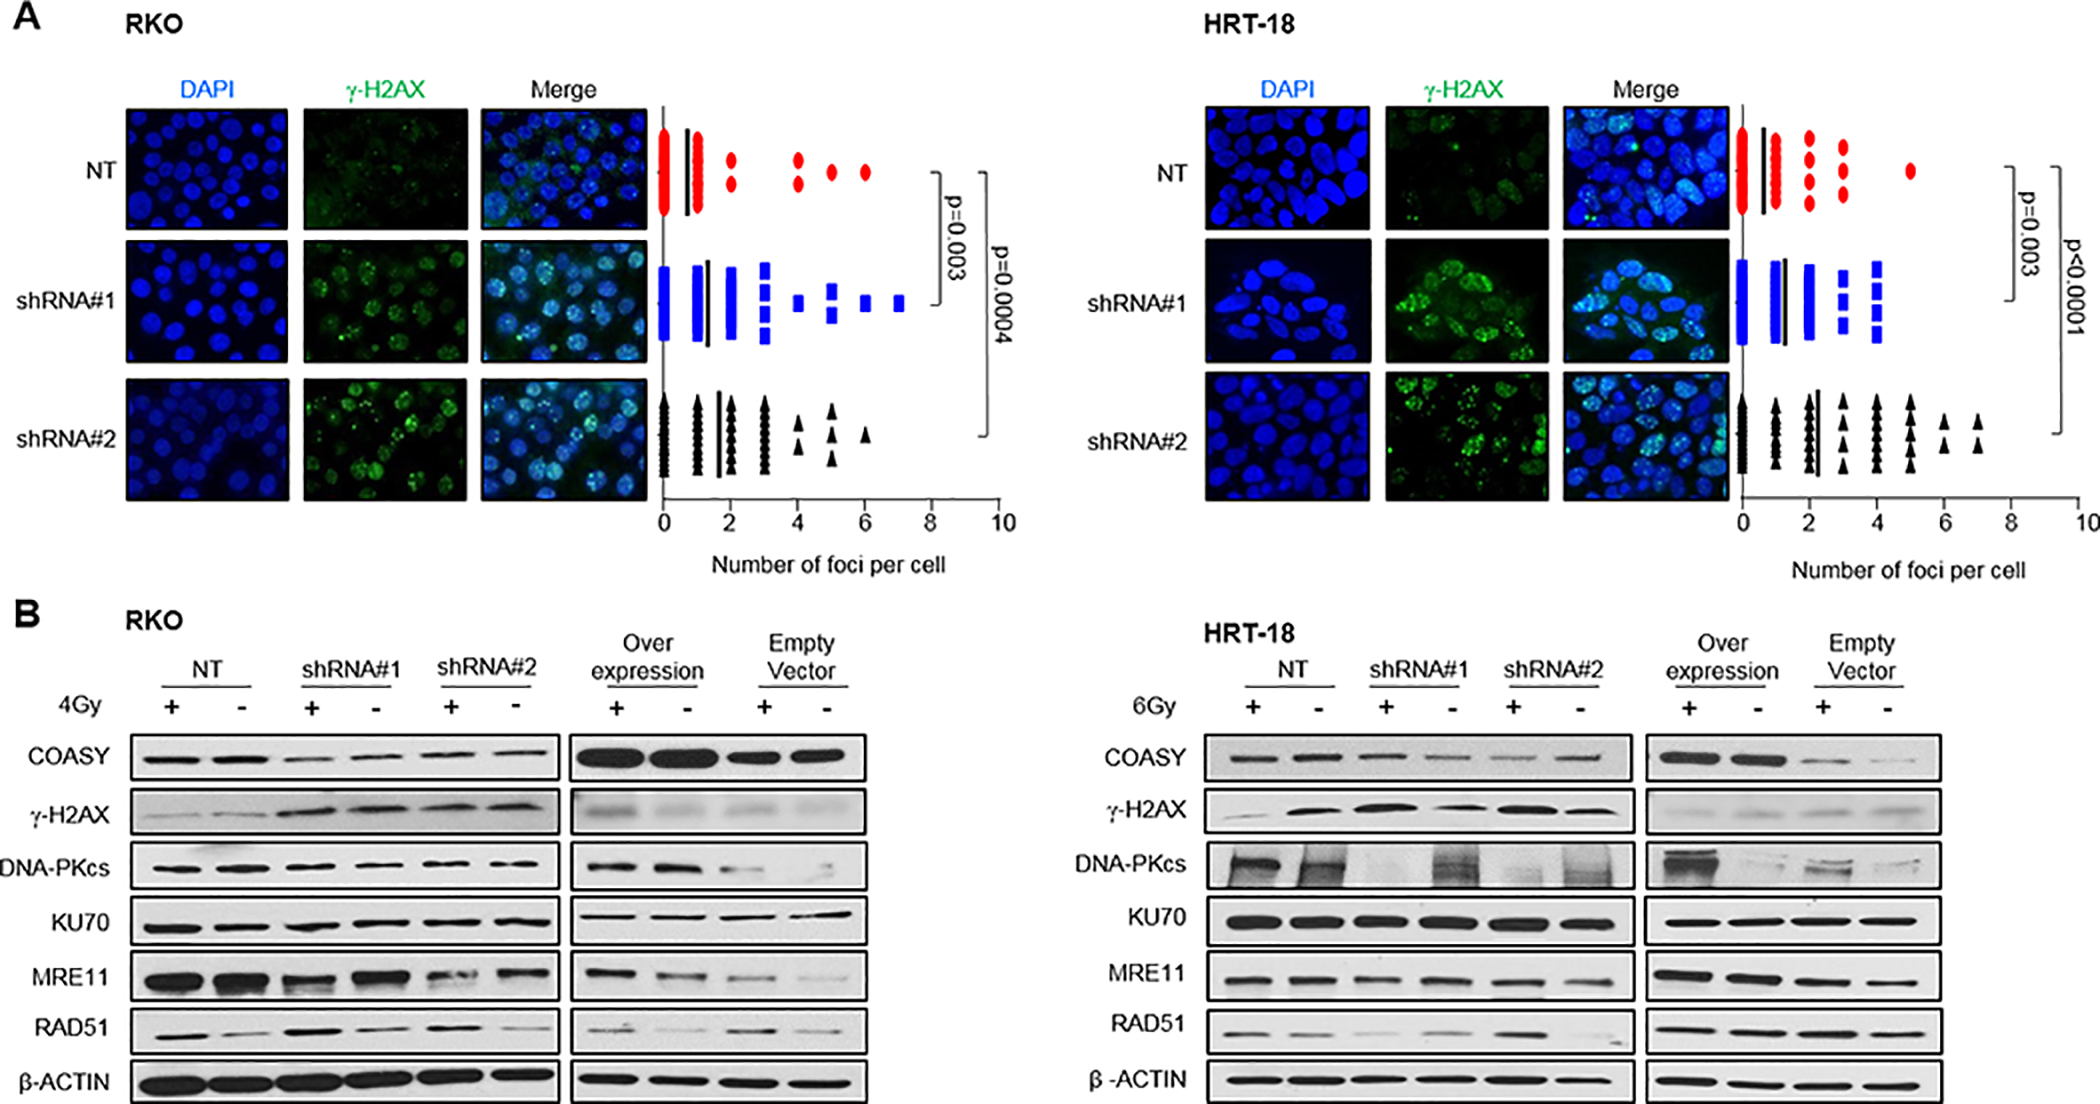
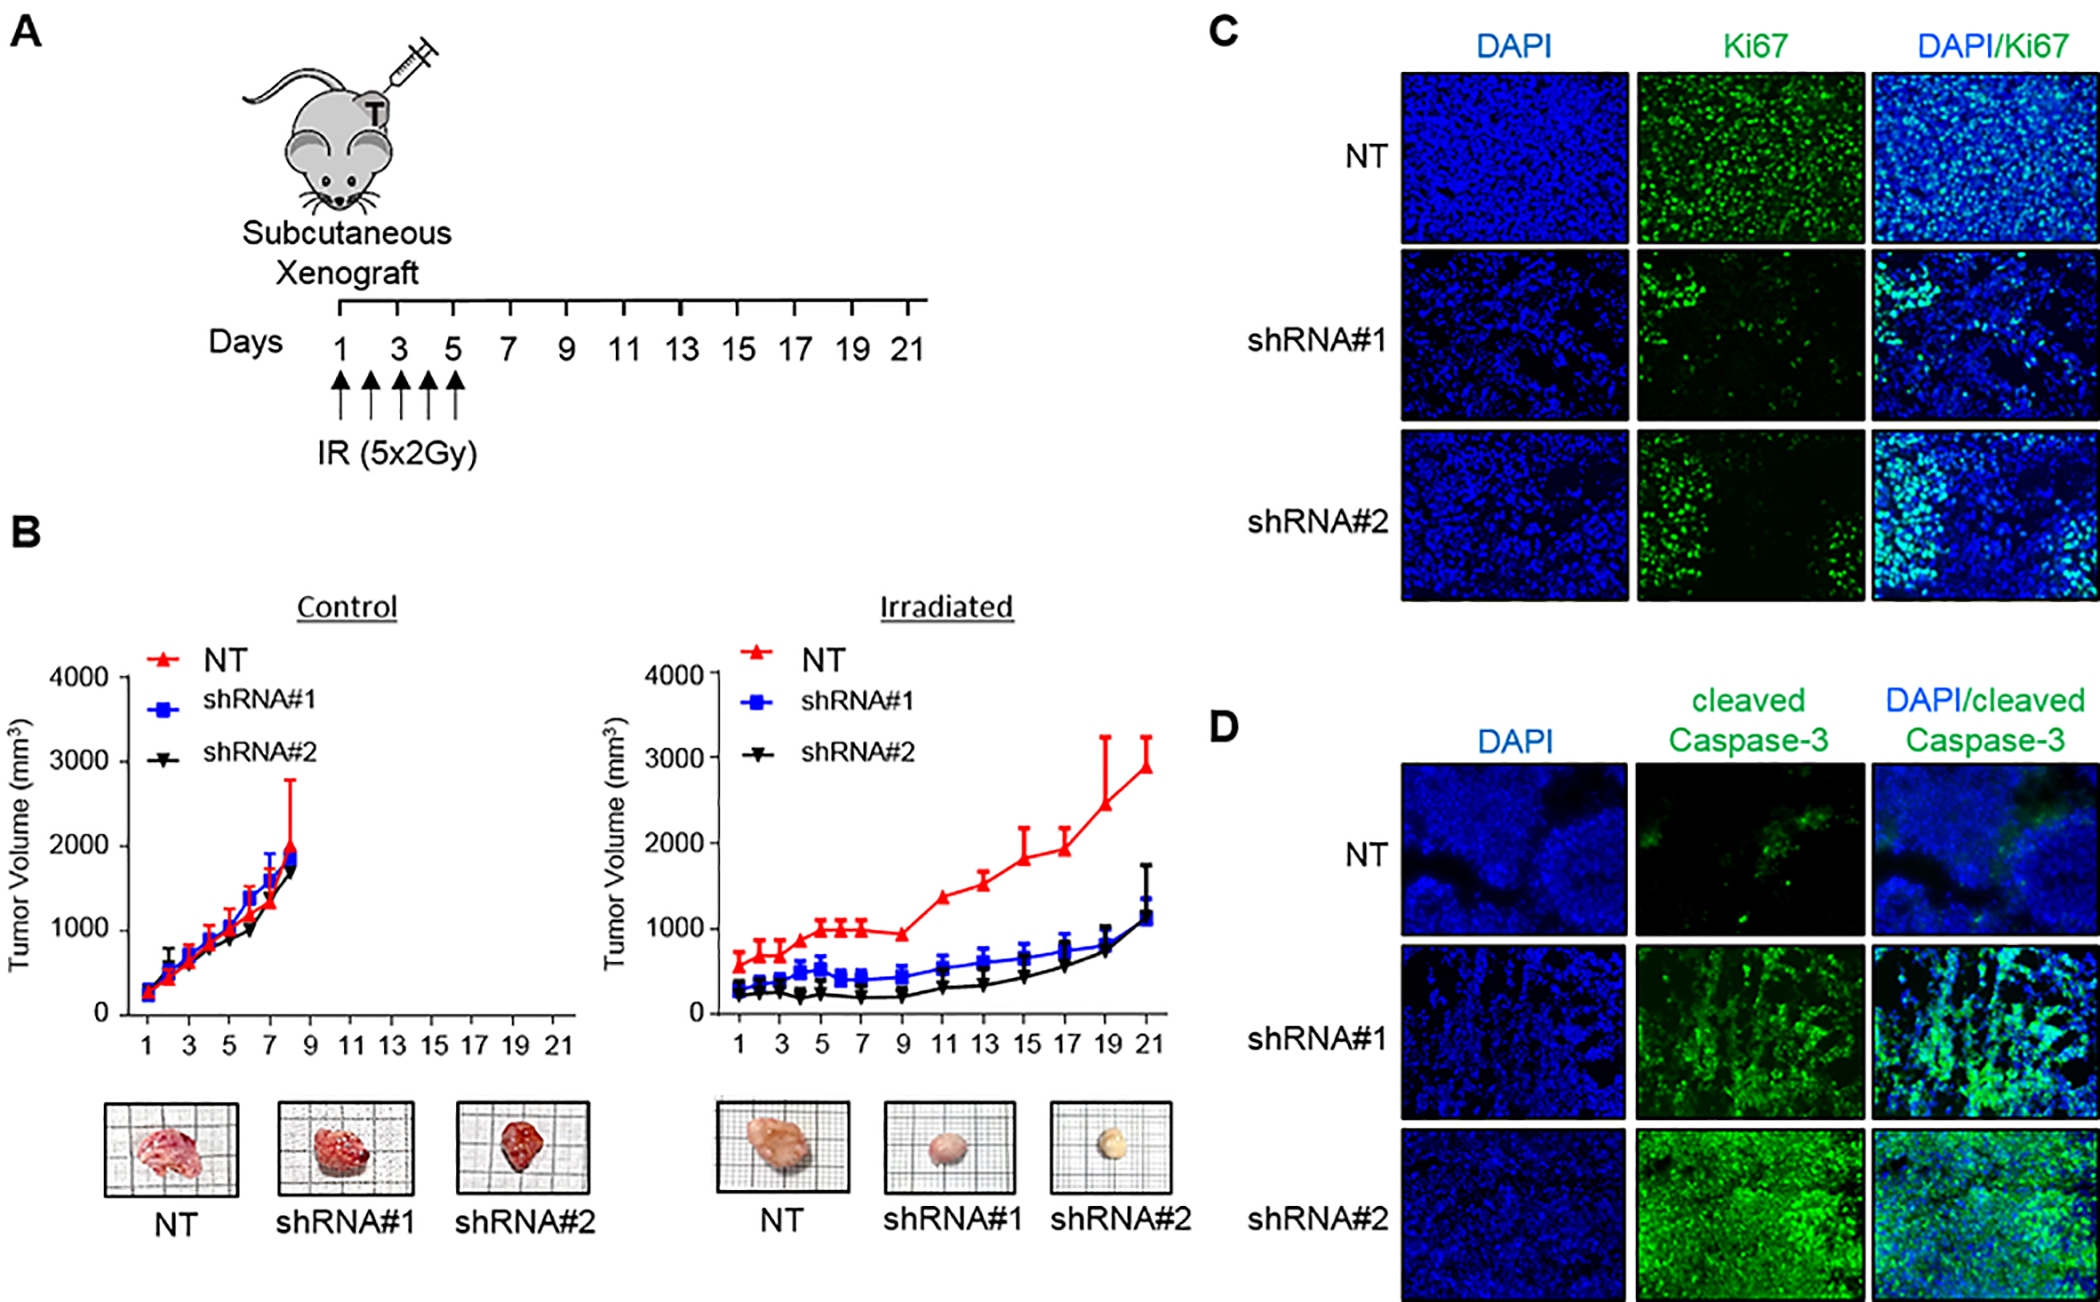
Neoadjuvant radiation is standard of care for locally advanced rectal cancer. Response to radiation is highly variable and directly linked with survival. However, there currently are no validated biomarkers or molecular targets to predict or improve radiation response, which would help develop personalized treatment and ideally targeted therapies. Here, we identified a novel biomarker, coenzyme A synthase (COASY), whose mRNA expression was consistently elevated in radioresistant human rectal cancers. This observation was validated in independent patient cohorts and further confirmed in colorectal cancer cell lines. Importantly, genetic overexpression and knockdown yielded radioresistant and sensitive phenotypes, respectively, in vitro and in vivo. COASY-knockdown xenografts were more vulnerable to radiation, showing delayed tumor growth, decreased proliferation, and increased apoptosis. Mechanistically, COASY protein directly interacted with the PI3K regulatory subunit PI3K-P85α, which increased AKT and mTOR phosphorylation, enhancing cell survival. Furthermore, shRNA COASY knockdown disrupted downstream PI3K pathway activation and also hindered DNA double-strand break repair, which both led to improved radiosensitivity. Collectively, this work reveals for the first time the biological relevance of COASY as a predictive rectal cancer biomarker for radiation response and offers mechanistic evidence to support COASY as a potential therapeutic target. SIGNIFICANCE: COASY is a novel radiotherapy response modulator in rectal cancer that regulates PI3K activation and DNA repair. Furthermore, COASY levels directly correlate with radiation response and serve as a predictive biomarker.


Conflict of interest statement

Conflict of interest: The authors declare no potential conflicts of interest.

Figures

Figure 1.
Figure 1.. COASY expression is a predictive biomarker for rectal cancer patient tumor response to neoadjuvant chemoradiation
A) The Venn diagram displays the number of genes differentially expressed between all scores (ANOVA test), between complete responders compared to all others (AJCC 0 vs 1-2-3), and non-responders compared to all others (AJCC 0-1-2 vs 3) (Wilcoxon test); (n=33, Kalady cohort). COASY is one of 3 genes differentially expressed in all comparisons. B) Comparative analysis of relative COASY expression level between normal tissue and colorectal cancer in Kalady cohort (upper left) and three independent cohorts (Hong, Gaedcke and Ki cohorts) available on Oncomine Database. Bold bar represents the mean. Statistics were performed using a Mann-Whitney test. C) RT-qPCR of COASY gene expression from 33 patients according to their respective AJCC tumor regression scores. Results were normalized by two references genes (β-ACTIN and PUM1). Data are represented as mean ± SE. Statistics were performed using a Mann-Whitney test. D) Immunohistochemistry analysis of COASY on paraffin-embedded pre-treatment rectal adenocarcinoma patient samples. Three patients were studied per each AJCC response score. For each group, top and bottom panel show the staining without and with hematoxylin counter staining, respectively. E) Comparative analysis of relative COASY expression level using the Jorissen 3 database comparing CRC patients with or without recurrence within 5 years. Statistics were performed using a Mann-Whitney test. F) COASY expression level measured by microarray in rectal cancer pretreatment biopsies and analyzed according to response to nCRT as a retrospective validation cohort (Watanabe et al., 2006. GSE3493) (left panel). A Receiver-Operating Characteristic (ROC) analysis showing the sensitivity and specificity of COASY expression to discriminate responders from non-responders in the Watanabe cohort G) By means of comparison, the same analysis is shown for the Kalady cohort. COASY expression level measured by microarray in rectal cancer pretreatment biopsies and analyzed according to response to nCRT. Data are represented as mean ± SE. Statistics were performed using a Mann-Whitney test (left panel). A ROC analysis showing the sensitivity and specificity of COASY expression to discriminate responders from non-responders right panel).
Figure 2.
Figure 2.. Elevated COASY levels correlate with increased CRC cell line radioresistance.
A) The expression of COASY was measured by RT-qPCR and normalized by β-ACTIN in 7 CRC cell lines. B) Correlation of COASY expression to radiation doses required to obtain 10% survival (D10), determined by clonogenic assays in the previously mentioned 7 CRC cell lines. C) Two different shRNA constructs (shRNA#1 and shRNA#2) targeted against COASY mRNA were stably transduced in two CRC cell lines (RKO and HRT-18) via lentiviral infection and compared to a control non-targeting shRNA (NT). COASY knockdown was observed by immunoblot. D) Flow cytometry was performed to determine the levels of apoptosis by AnnexinV/PI in parental and shRNA cell lines 72 hours after 4 Gy or 6 Gy irradiation in RKO and HRT-18, respectively. The percentage of cell death included the cells that were AnnexinV+/PI-; AnnexinV-/PI+ and AnnexinV+/PI+. Data are represented as mean ± SE. Statistical analysis was done using Mann-Whitney test. E) Clonogenic survival assays for various doses of irradiation. The percentage of cell survival is shown as a function of the irradiation dose in black (NT), dashed orange (shRNA#1), and red lines (shRNA#2) for RKO and HRT-18. ANOVA was performed to measure the interaction between the irradiation dose, the cell lines, and the survival percentage; p values are shown
Figure 3.
Figure 3.. Gene expression analysis and gene set enrichment identify distinct signatures and signaling pathways associated with COASY.
A) Heatmap from hierarchical clustering of 660 differentially expressed genes comparing two groups: COASYLow (bottom 25% of the cohort for COASY expression; n=8) to COASYHigh (Top 25% of the cohort for COASY expression; n=8. B) Gene clusters from COASYHigh hierarchical classification were subjected to Gene Ontology Analysis, and the most enriched term for each cluster was determined using the q-value from the FDR test. Green nodes represent downregulated gene families; red nodes represent upregulated gene families. Size of nodes represent the number of genes present in the cluster and color intensity represents the p-value. C) Gene Set Enrichment Assay (GSEA) made from microarray data of the Kalady cohort comparing two phenotypes, COASYLow and COASYHigh, with the REACTOME dataset. ES, enrichment score; NES, normalized enrichment score, FDR false discovery rate.
Figure 4.
Figure 4.. COASY-induced radioresistance is mediated by modulation of the PI3K/AKT/mTOR pathway.
A) Using RKO, endogenous PI3K-P85α and P70S6K1 were co-immunoprecipitated in a complex with COASY using a specific antibody from exponentially growing cells. Protein G magnetic beads alone were incubated with the same cell extract and used as a control for nonspecific binding. The immunoprecipitated proteins were fractionated on an SDS-Page gel, and LC-MS/MS. The MS/MS spectra for the COASY tryptic peptide, (504)DGLSEAAAQSR(514), is shown from the COASY IP, P70S6K1 IP, and PI3K-P85α IP. ppi stands for the peptide peak intensities. B) Co-staining analysis of COASY and PI3K-P85α protein in RKO cell line by immunofluorescence (100x). C) Immunoblotting was used to detect COASY expression in RKO and HRT-18 cell lines transfected with either a control vector (empty vector) or a COASY overexpression vector (overexpression). D) PI3K protein arrays were done 24h after irradiation (4 Gy for RKO and 6 Gy for HRT-18) comparing the knockdown cell line for COASY (shRNA#1 and shRNA#2) and overexpressing cell lines to their respective control transfected with non-targeting shRNA (NT) or an empty vector. Histograms correspond to the signal intensity quantification with background subtracted and normalized by the 3 internal positive controls.
Figure 5.
Figure 5.. COASY enhances DNA repair ability.
A) COASY knockdown and non-targeting irradiated cells were evaluated for DSB number by measuring γ-H2AX 24 hours after irradiation with 4 Gy and 6 Gy for RKO and HRT-18, respectively. For each cell line, the left panel shows representative pictures of γ-H2AX staining by immunofluorescence. The right panel box‐plot shows the distribution of cells counted in each cell population (n=50). Bold lines represent the mean number of foci per cell. Statistical analyses were done using Mann-Whitney test. B) COASY shRNAs and NT shRNA from RKO and HRT-18 cell lines were treated with 4 Gy and 6 Gy of irradiation, respectively. After 24 hours, lysates were prepared and analyzed for COASY, γ-H2AX, DNA-PKcs, KU70, MRE11, RAD51 and normalized by β-ACTIN via immunoblot.
Figure 6.
Figure 6.. Knockdown of COASY induces radiosensitization of CRC in vivo.
A) Experimental design: NSG mice underwent subcutaneous flank injection with RKONT, RKOshRNA#1, or RKOshRNA#2. When tumors reached approximatively 200 mm3, mice received radiation with 2 Gy using X-beam at 1 Gy/min per day during 5 consecutive days (arrows). B) Tumor growth was monitored in control condition (left panel) or treated with irradiation (right panel) every two days using calipers. Data are represented as mean ± SE (n=3 for control and n=4 for both shRNA groups). Representative images of harvested tumors on day 8 for control and day 21 for tumor treated with irradiation are shown. C) Ki67 immunofluorescence staining on tumors harvested on day 21. Representative pictures of each xenograft cell line are shown. D) Cleaved caspase-3 immunofluorescence staining on tumors harvested on day 21. Representative pictures of each xenograft cell line are shown.

Similar articles

Cited by

References

    1. Howlader N, Noone A, Krapcho M, Miller D, Bishop K, Kosary C, et al. SEER Cancer Statistics Review, 1975–2014, National Cancer Institute [Internet] Bethesda, MD; Report No.: based on November 2016 SEER data submission, posted to the SEER web site, April 2017.
    1. Murphy CC, Singal AG, Baron JA, Sandler RS. Decrease in Incidence of Young-Onset Colorectal Cancer Before Recent Increase. Gastroenterology. 2018. December 1;155(6):1716–1719.e4. - PMC - PubMed
    1. Sauer R, Becker H, Hohenberger W, Rödel C, Wittekind C, Fietkau R, et al. Preoperative versus postoperative chemoradiotherapy for rectal cancer. N Engl J Med. 2004. October 21;351(17):1731–40. - PubMed
    1. Sauer R, Liersch T, Merkel S, Fietkau R, Hohenberger W, Hess C, et al. Preoperative Versus Postoperative Chemoradiotherapy for Locally Advanced Rectal Cancer: Results of the German CAO/ARO/AIO-94 Randomized Phase III Trial After a Median Follow-Up of 11 Years. JCO. 2012. June 1;30(16):1926–33. - PubMed
    1. Monson JRT, Weiser MR, Buie WD, Chang GJ, Rafferty JF, Buie WD, et al. Practice parameters for the management of rectal cancer (revised). Dis Colon Rectum. 2013. May;56(5):535–50. - PubMed

Publication types

MeSH terms