. 2019 Nov 8;9(1):16282.
doi: 10.1038/s41598-019-52567-x.

Bacillus velezensis 5113 Induced Metabolic and Molecular Reprogramming during Abiotic Stress Tolerance in Wheat

Affiliations

Bacillus velezensis 5113 Induced Metabolic and Molecular Reprogramming during Abiotic Stress Tolerance in Wheat

Islam A Abd El-Daim et al. Sci Rep. .

Abstract

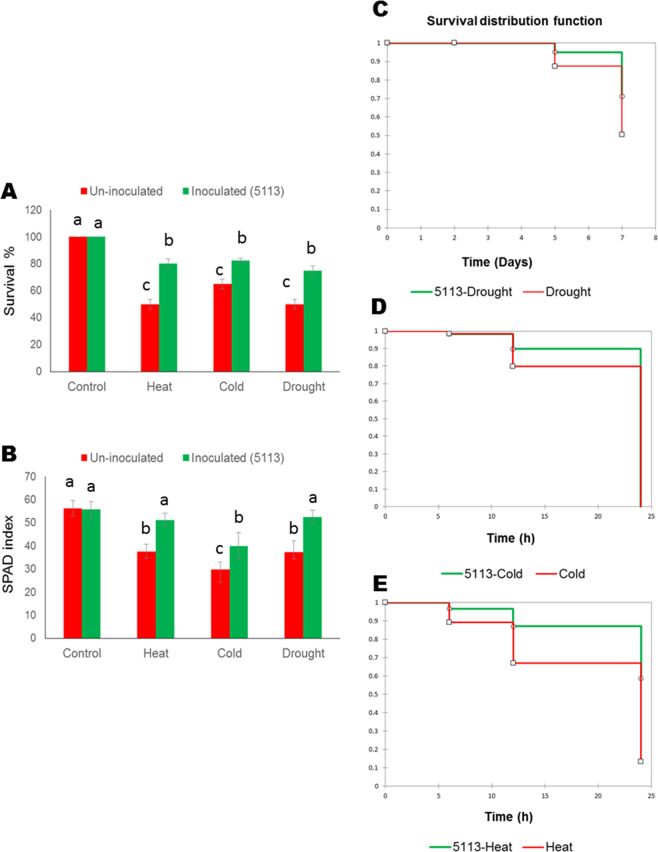
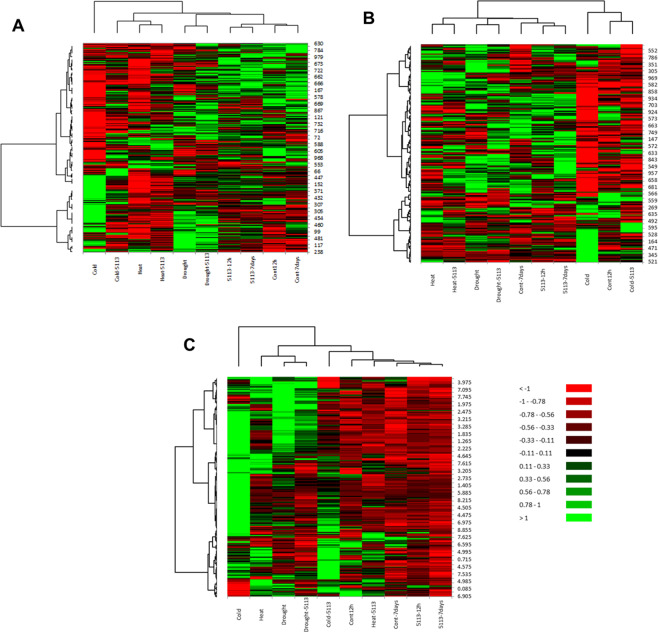
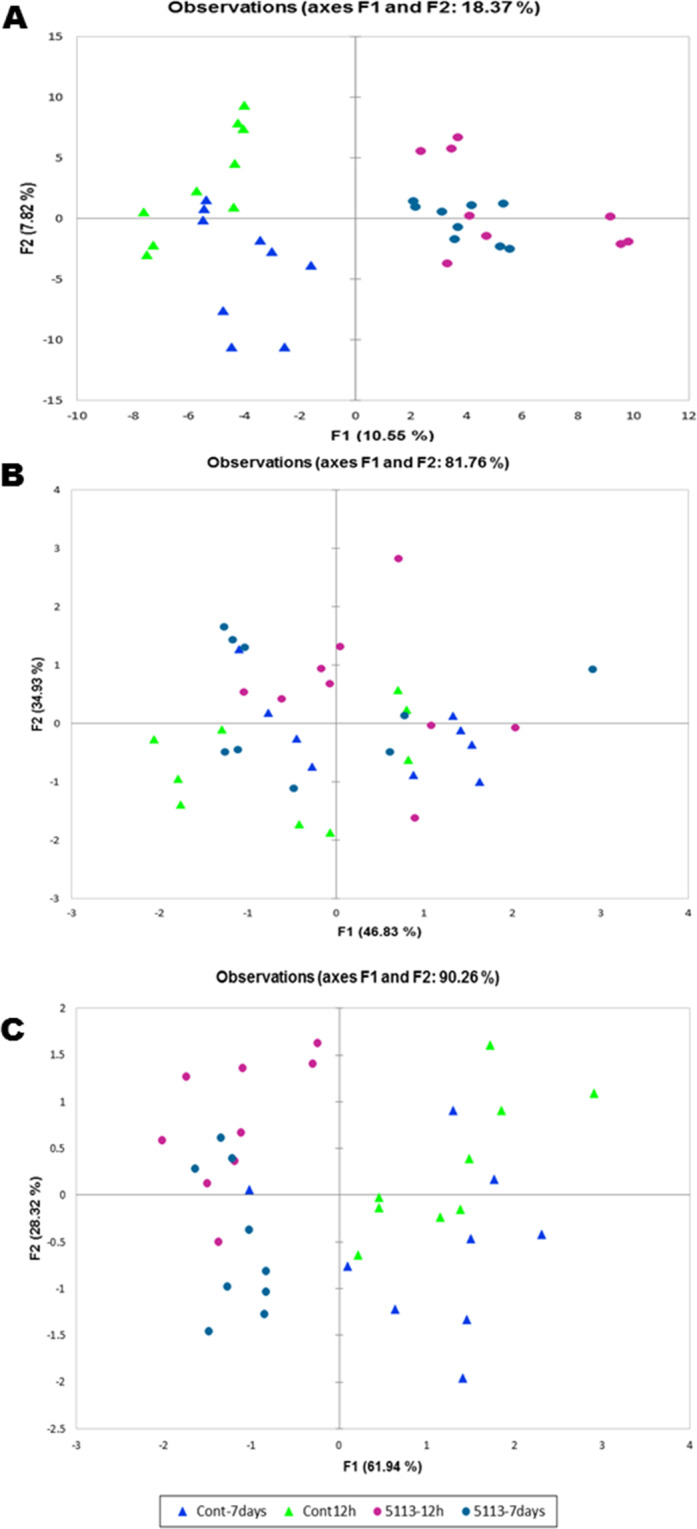
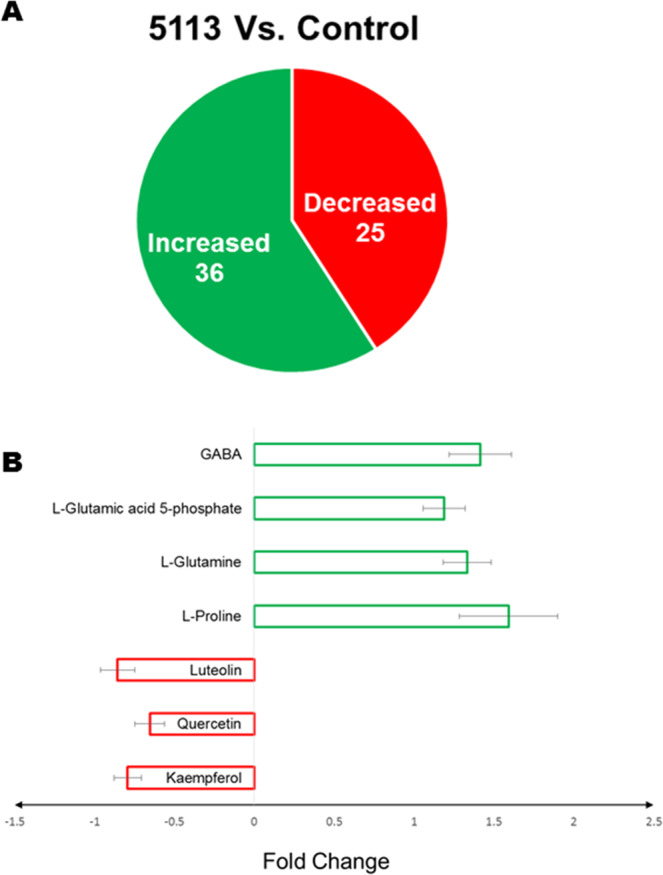
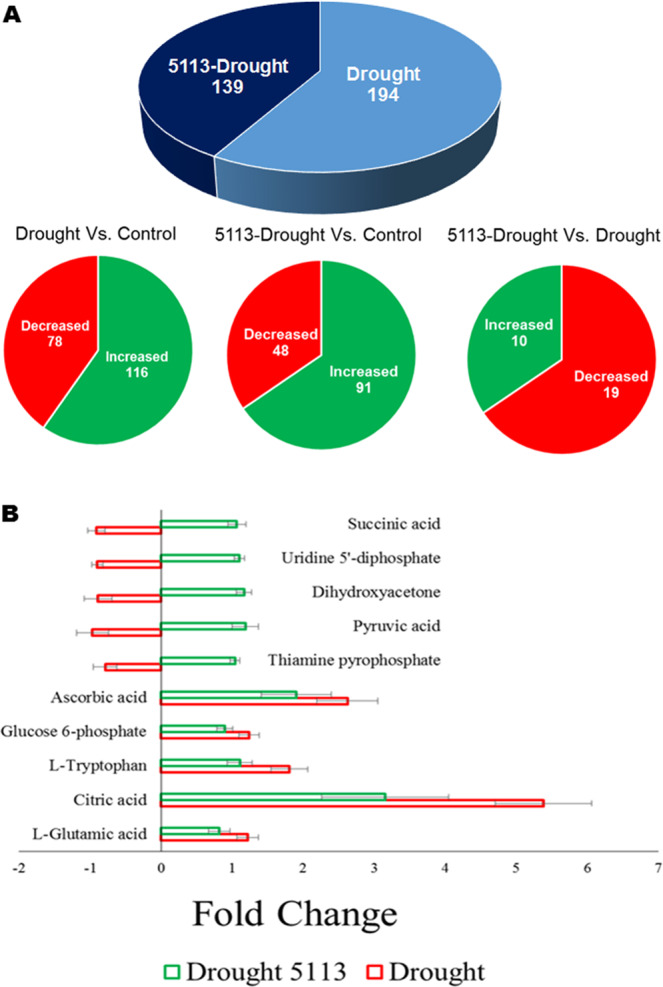
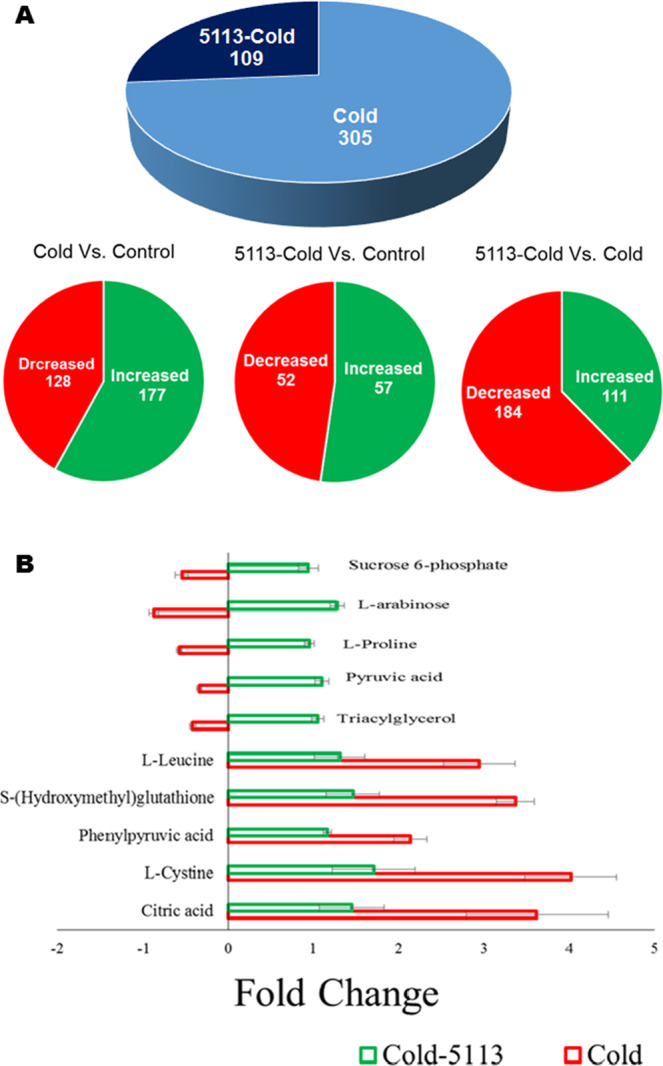
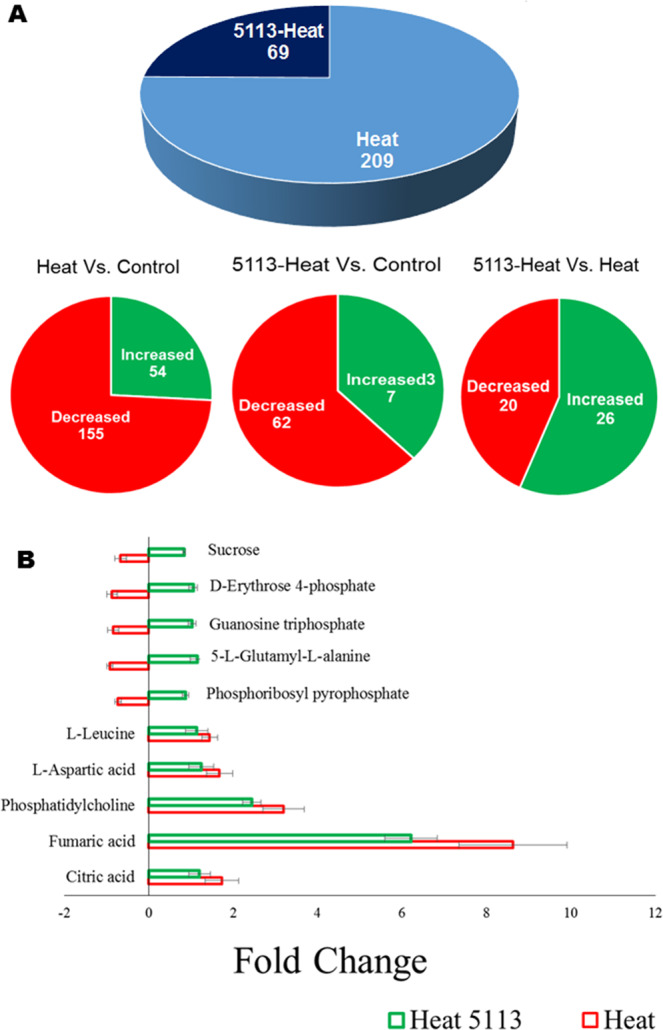
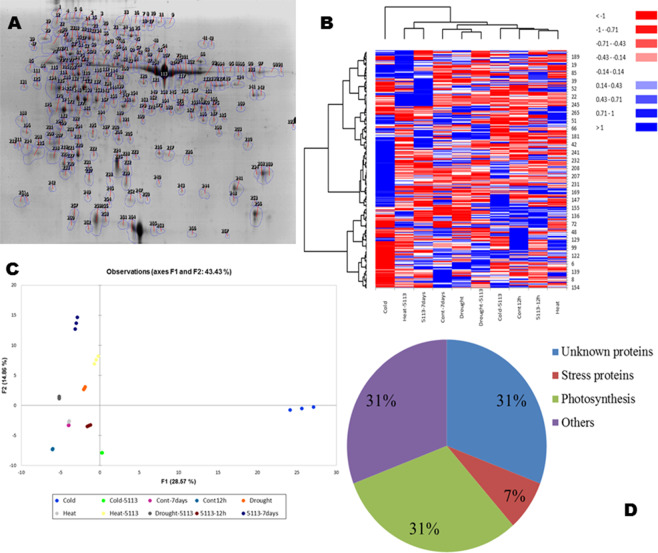
Abiotic stresses are main limiting factors for agricultural production around the world. Plant growth promoting rhizobacteria (PGPR) have been shown to improve abiotic stress tolerance in several plants. However, the molecular and physiological changes connected with PGPR priming of stress management are poorly understood. The present investigation aimed to explore major metabolic and molecular changes connected with the ability of Bacillus velezensis 5113 to mediate abiotic stress tolerance in wheat. Seedlings treated with Bacillus were exposed to heat, cold/freezing or drought stress. Bacillus improved wheat survival in all stress conditions. SPAD readings showed higher chlorophyll content in 5113-treated stressed seedlings. Metabolite profiling using NMR and ESI-MS provided evidences for metabolic reprograming in 5113-treated seedlings and showed that several common stress metabolites were significantly accumulated in stressed wheat. Two-dimensional gel electrophoresis of wheat leaves resolved more than 300 proteins of which several were differentially expressed between different treatments and that cold stress had a stronger impact on the protein pattern compared to heat and drought. Peptides maps or sequences were used for database searches which identified several homologs. The present study suggests that 5113 treatment provides systemic effects that involve metabolic and regulatory functions supporting both growth and stress management.


Conflict of interest statement

The authors declare no competing interests.

Figures

Figure 1
Figure 1
Responses of 5113-treated wheat seedlings to heat stress (12 h 45°C), cold stress (12 h −5°C) and drought stress (7 days without water). (A) Survival % (calculated for 2 plant groups (20 plant each), (B) SPAD index and Kaplan Meier survival function for 5113-treated drought-stressed (C), cold-stressed (D) and heat-stressed wheat seedlings (E). Bars indicate standard deviation between 3 replicates (5 for SPAD index). Treatments labelled with identical letters are not significant at p < 0.05.
Figure 2
Figure 2
Heat maps for the leaves metabolite profiles of 5113-treated wheat seedlings after exposure to heat stress (12 h 45°C), cold stress (12 h −5°C) and drought stress (7 days without water). Different metabolite profiling approaches were used. Positive mode ESI-MS (A), negative mode ESI-MS (B) and NMR (C). The heat maps represent the average of 9 data points (three biological samples and three technical repeats) and were generated based on Pearson and Ward for distance measure and clustering using XLSTAT package. Numbers right to each heatmap represents potential metabolites.
Figure 3
Figure 3
Principle component analysis (PCA) of the metabolite profiles determined in the leaves of unstressed 5113 (12 h and 7 days post 5113 treatment) treated wheat seedlings. Positive mode ESI-MS (A), negative mode ESI-MS (B) and NMR (C). All treatments in these analyses were represented by 9 data points (three biological samples and three technical repeats).
Figure 4
Figure 4
Differential metabolite accumulation in the leaves of 5113-treated unstressed wheat seedlings. (A) Metabolites showing significant (p < 0.05) increase or decrease accumulation. (B) Fold change (relative to control unstressed treatment) in the accumulation of top metabolites showing significant (p < 0.05) differential accumulation. Bars indicate standard deviation between 9 data points (three biological samples and three technical repeats).
Figure 5
Figure 5
Differential metabolite accumulation in the leaves of 5113-treated drought-stressed wheat seedlings. (A) Metabolites showing significant (p < 0.05) increase or decrease accumulation. (B) Fold change (relative to control unstressed treatment) in the accumulation of top metabolites showing significant (p < 0.05) differential accumulation. Bars indicate standard deviation between 9 data points (three biological samples and three technical repeats).
Figure 6
Figure 6
Differential metabolite accumulation in the leaves of 5113-treated and cold-stressed wheat seedlings. (A) Metabolites showing significant (p < 0.05) increase or decrease accumulation. (B) Fold change (relative to control unstressed treatment) in the accumulation of top metabolites showing significant (p < 0.05) differential accumulation. Bars indicate standard deviation between 9 data points (three biological samples and three technical repeats).
Figure 7
Figure 7
Differential metabolite accumulation in the leaves of 5113-treated and heat-stressed wheat seedlings. (A) Metabolites showing significant (p < 0.05) increase or decrease accumulation. (B) Fold change (relative to control unstressed treatment) in the accumulation of top metabolites showing significant (p < 0.05) differential accumulation. Bars indicate standard deviation between 9 data points (three biological samples and three technical repeats).
Figure 8
Figure 8
Proteomics analysis and differential regulation of protiens in the leaves of 5113-treated and abiotic stressed (heat, cold and drought stresses) wheat seedlings. (A) Two-dimensional gel analyses (reference image representing proteins profiles) generated using image-analysis software Progenesis PG240 (Nonlinear Dynamics, USA). (B) Heat maps for the protein profiles of different treatments (numbers right to heatmap represents proteins IDs found on the reference image). (C) Principle Component Analysis (PCA) for the protein profiles of different treatments. (D) Protein classification based on proteomic analysis Functional distribution of some differentially represented proteins identified after wheat leaf proteomic analysis based on BLAST queries.

References

    1. Nakashima K, Ito Y, Yamaguchi-Shinozaki K. Transcriptional regulatory networks in response to abiotic stresses in Arabidopsis and grasses. Plant Physiology. 2009;149:88–95. doi: 10.1104/pp.108.129791. - DOI - PMC - PubMed
    1. Zhu J-K. Abiotic stress signaling and responses in plants. Cell. 2016;167:313–324. doi: 10.1016/j.cell.2016.08.029. - DOI - PMC - PubMed
    1. Zhang, R. et al. Evolution of disease defense genes and their regulators in plants. International Journal of Molecular Science20(2) (2019). 10.3390/ijms20020335 - PMC - PubMed
    1. Huber AE, Bauerle TL. Long-distance plant signaling pathways in response to multiple stressors: the gap in knowledge. Journal of Experimental Botany. 2016;67:2063–2079. doi: 10.1093/jxb/erw099. - DOI - PubMed
    1. Vishwakarma K, et al. Abscisic acid signaling and abiotic stress tolerance in plants: A review on current knowledge and future prospects. Frontiers in Plant Science. 2017;8:161. doi: 10.3389/fpls.2017.00161. - DOI - PMC - PubMed

Publication types

Supplementary concepts