Review
. 2019 Nov;24(12):1-12.
doi: 10.1117/1.JBO.24.12.121910.

Multidomain computational modeling of photoacoustic imaging: verification, validation, and image quality prediction

Affiliations
Review

Multidomain computational modeling of photoacoustic imaging: verification, validation, and image quality prediction

Nima Akhlaghi et al. J Biomed Opt. 2019 Nov.

Abstract

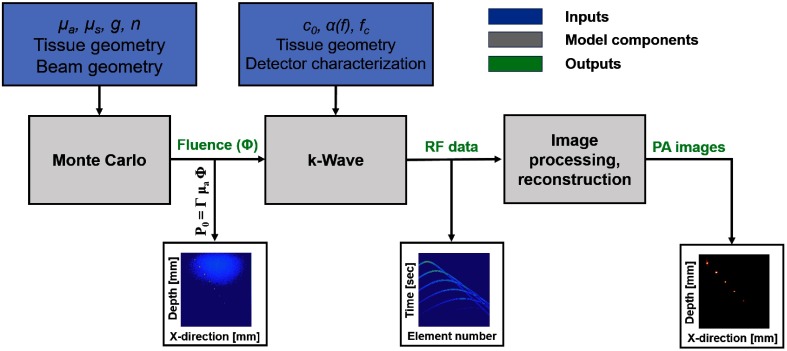
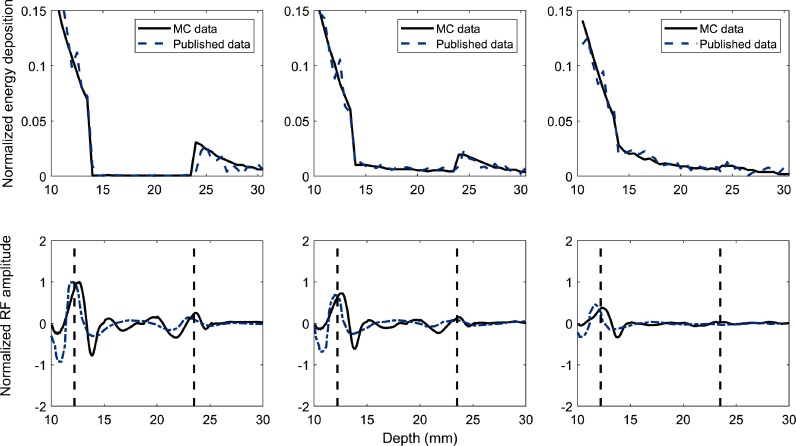
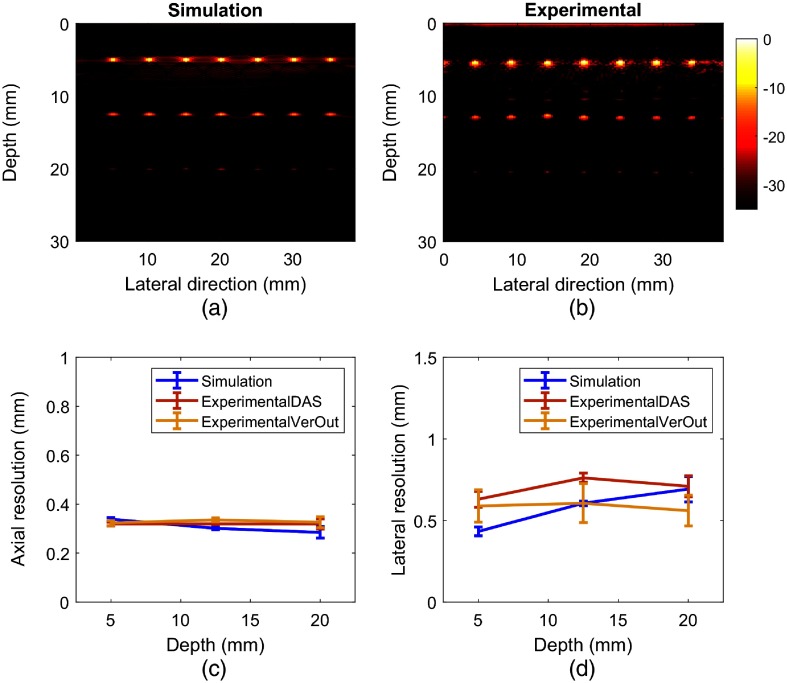
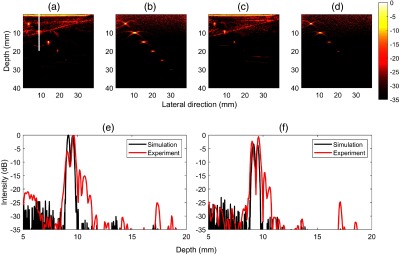
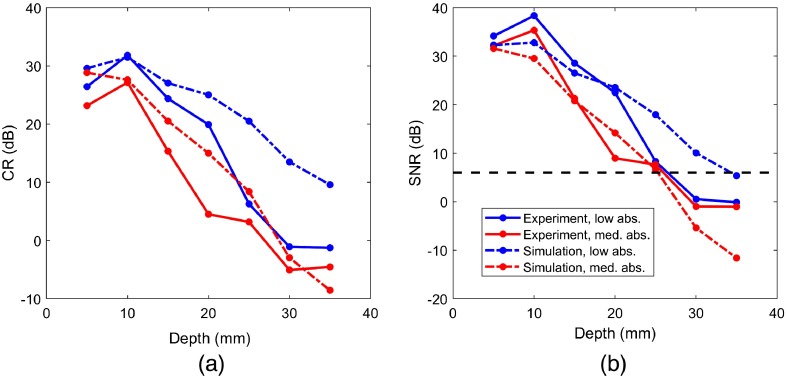
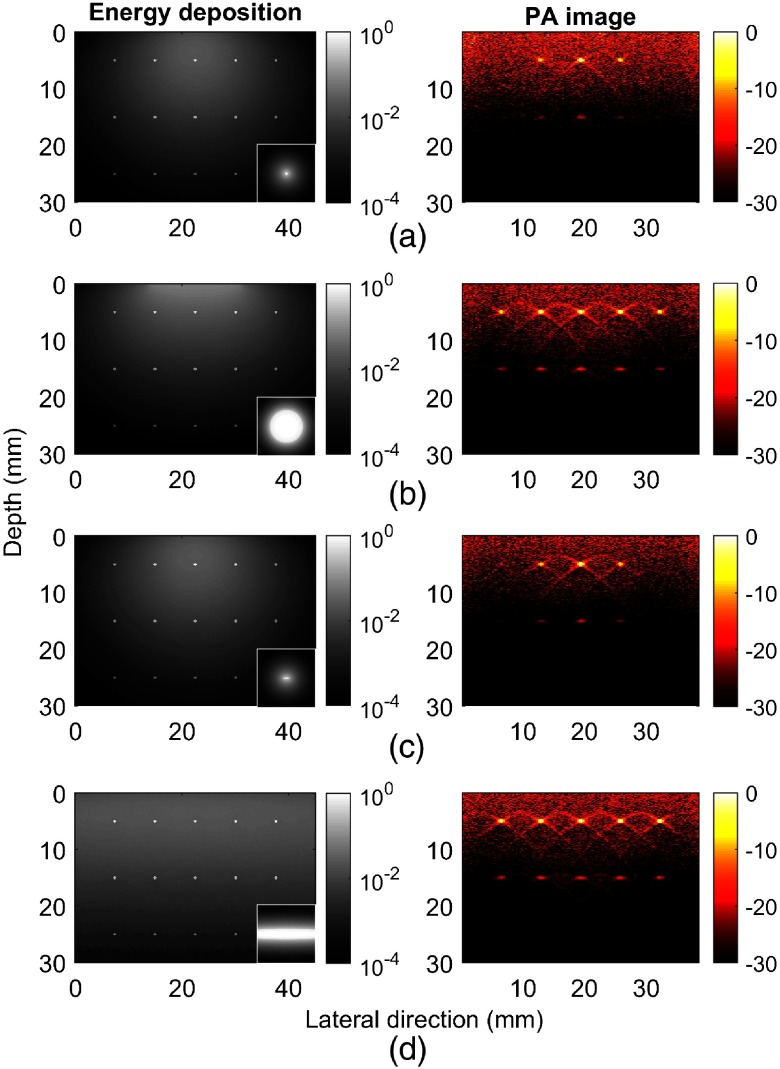
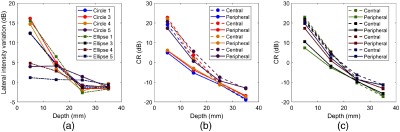
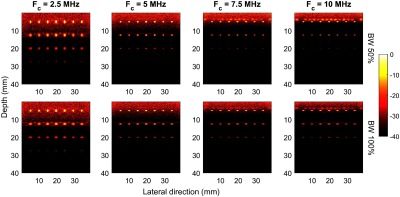
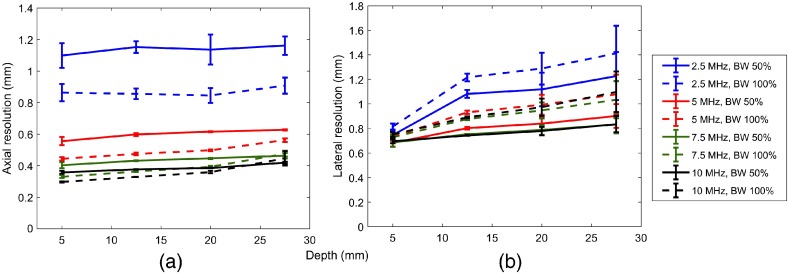
As photoacoustic imaging (PAI) technology matures, computational modeling will increasingly represent a critical tool for facilitating clinical translation through predictive simulation of real-world performance under a wide range of device and biological conditions. While modeling currently offers a rapid, inexpensive tool for device development and prediction of fundamental image quality metrics (e.g., spatial resolution and contrast ratio), rigorous verification and validation will be required of models used to provide regulatory-grade data that effectively complements and/or replaces in vivo testing. To address methods for establishing model credibility, we developed an integrated computational model of PAI by coupling a previously developed three-dimensional Monte Carlo model of tissue light transport with a two-dimensional (2D) acoustic wave propagation model implemented in the well-known k-Wave toolbox. We then evaluated ability of the model to predict basic image quality metrics by applying standardized verification and validation principles for computational models. The model was verified against published simulation data and validated against phantom experiments using a custom PAI system. Furthermore, we used the model to conduct a parametric study of optical and acoustic design parameters. Results suggest that computationally economical 2D acoustic models can adequately predict spatial resolution, but metrics such as signal-to-noise ratio and penetration depth were difficult to replicate due to challenges in modeling strong clutter observed in experimental images. Parametric studies provided quantitative insight into complex relationships between transducer characteristics and image quality as well as optimal selection of optical beam geometry to ensure adequate image uniformity. Multidomain PAI simulation tools provide high-quality tools to aid device development and prediction of real-world performance, but further work is needed to improve model fidelity, especially in reproducing image noise and clutter.

Keywords: Monte Carlo; image quality; k-Wave; photoacoustic imaging; simulation.


Figures

Fig. 1
Fig. 1
PAI model flowchart. The small 2D images represent the output of each step.
Fig. 2
Fig. 2
Phantom geometries used for simulations. (a) Tissue-mimicking phantom with embedded cyst structure of diameter 10 mm (phantom 1). (b) Filament array of diameter 0.05 mm (phantom 2). (c) Penetration depth phantom (phantom 3) with embedded targets of 0.5 mm. (d) 2D array phantom with embedded targets of 0.5 mm (phantom 4).
Fig. 3
Fig. 3
Comparison of energy deposition (top row) and acoustic RF profiles (bottom row) with depth from our model outputs (black solid lines) and those of Heijblom et al. (blue dashed lines) for negative, zero, and positive cyst contrast. The black dashed lines denote upper and lower cyst boundaries.
Fig. 4
Fig. 4
Reconstructed photoacoustic images of filament phantom (phantom 2) for (a) simulated and (b) experimental RF data and (c) computed axial and (d) lateral resolution from simulated and experimental data. The color bar is in dB.
Fig. 5
Fig. 5
Upper row: Reconstructed photoacoustic images from penetration depth phantom (phantom 3) for (a) and (b) low-absorbing and (c) and (d) medium-absorbing background, using (a) and (c) experimental and (b)–(d) simulated data. Data are normalized to the intensity of the shallowest target intensity. The color bar is in dB. Lower row: line plot across second target (white line in a) for depth of 5 to 20 mm.
Fig. 6
Fig. 6
Comparison of (a) target CR and (b) SNR in simulated and experimental images. Here, low abs. and med. abs refer to low absorption and medium absorption phantoms, respectively.
Fig. 7
Fig. 7
Energy deposition maps and corresponding simulated photoacoustic images for (a) and (b) 0.8- and 12.6-mm circular beams and (c) and (d) elliptical beams of size 0.25  mm×2.5  mm and 4  mm×40  mm. The small lower-right figure in each energy deposition map is an en face view of beam fluence at the phantom surface, which were self-normalized for visualization purposes. All beam cases used a fixed uniform radiant exposure of 10  mJ/cm2. Energy deposition colorbars in mJ/cm3, photoacoustic image colorbars in dB.
Fig. 8
Fig. 8
(a) Lateral intensity variation in dB. These values were computed as a ratio of the center target intensity to the one on most lateral position. (b) CR of center (dashed line) and periphery targets using circular and (c) elliptical beams. Due to overlap between the first and second beam size cases, the second beam size for both circular and elliptical was eliminated for clarity. Circles 1, 3, 4, and 5 correspond to circular beams with 0.8, 3.2, 6.4, and 12.6 mm diameter. Ellipses 1, 3, 4, and 5 refer to elliptical beams of size 0.25  mm×2.5  mm, 1  mm×10  mm, 2  mm×20  mm, and 4  mm×40  mm.
Fig. 9
Fig. 9
Reconstructed photoacoustic images of filament phantom (phantom 2) using ultrasound transducer arrays with varying center frequency (columns) as well as fractional bandwidth of 50% (top row) and 100% (bottom row). Each image was normalized to its maximum target intensity.
Fig. 10
Fig. 10
(a) Computed axial and (b) lateral resolution using ultrasound detector of four different center frequencies with 50% and 100% bandwidth (solid versus dashed lines).

References

    1. Berg W. A., et al. , “Ultrasound as the primary screening test for breast cancer: analysis from ACRIN 6666,” J. Natl. Cancer Inst. 108(4) (2015).JNCIEQ10.1093/jnci/djv367 - DOI - PMC - PubMed
    1. Berry D. A., et al. , “Effect of screening and adjuvant therapy on mortality from breast cancer,” N. Engl. J. Med. 353(17), 1784–1792 (2005).NEJMAG10.1056/NEJMoa050518 - DOI - PubMed
    1. Shah R., Rosso K., Nathanson S. D., “Pathogenesis, prevention, diagnosis and treatment of breast cancer,” World J. Clin. Oncol. 5(3), 283–298 (2014).10.5306/wjco.v5.i3.283 - DOI - PMC - PubMed
    1. Xia W., Steenbergen W., Manohar S., “Photoacoustic mammography: prospects and promises,” Breast Cancer Manag. 3(5), 387–390 (2014).10.2217/bmt.14.32 - DOI
    1. Wang L. V., Hu S., “Photoacoustic tomography: in vivo imaging from organelles to organs,” Science 335(6075), 1458–1462 (2012).SCIEAS10.1126/science.1216210 - DOI - PMC - PubMed

Publication types