. 2019 Nov 19;117(10):1795-1804.
doi: 10.1016/j.bpj.2019.10.015. Epub 2019 Oct 23.

The Interplay Between Cell-Cell and Cell-Matrix Forces Regulates Cell Migration Dynamics

Affiliations

The Interplay Between Cell-Cell and Cell-Matrix Forces Regulates Cell Migration Dynamics

Apratim Bajpai et al. Biophys J. .

Abstract

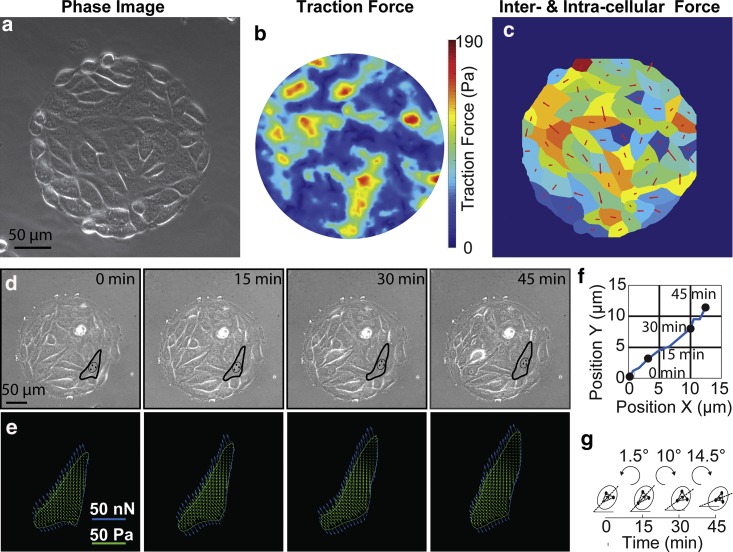
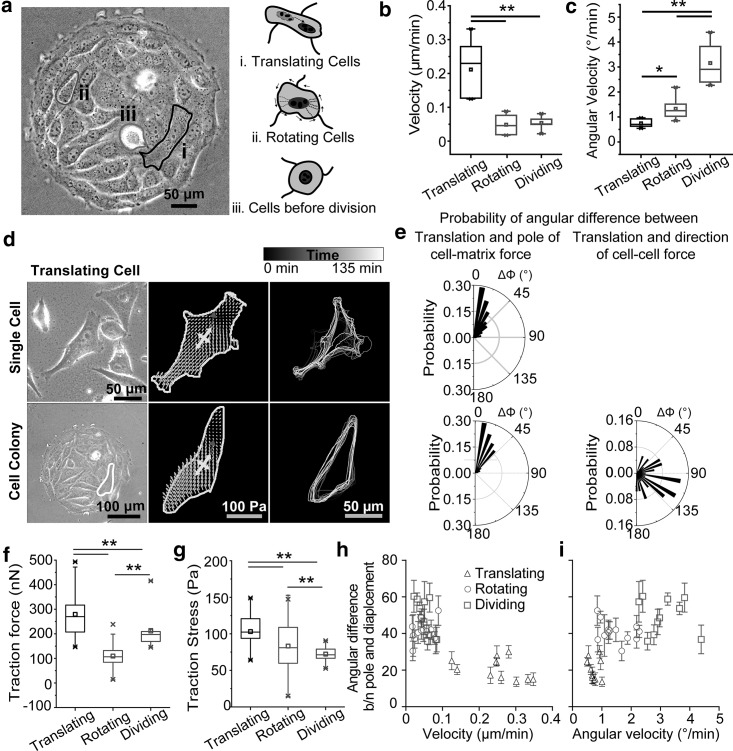
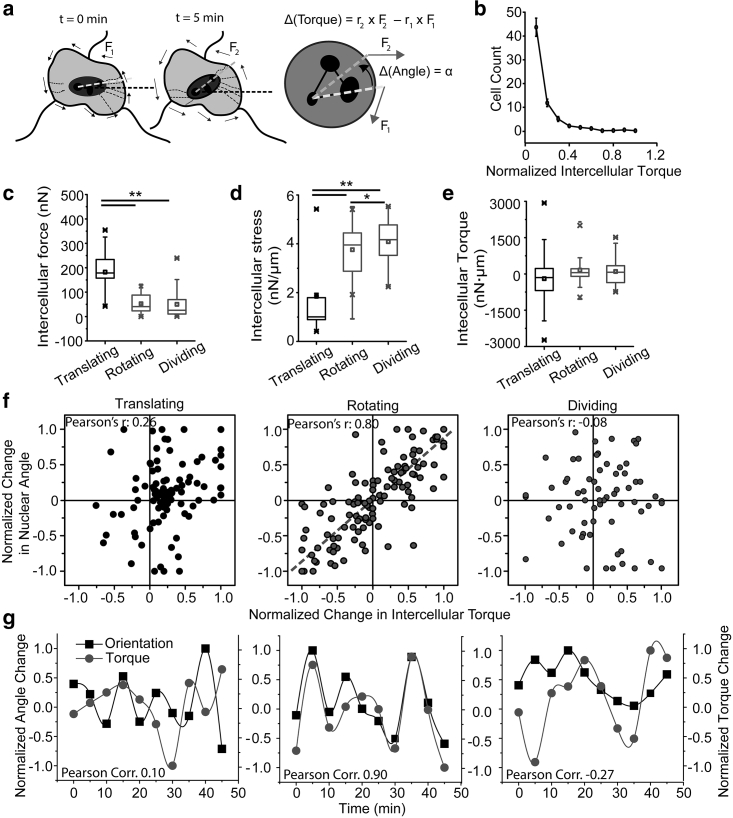
Cells in vivo encounter and exert forces as they interact with the extracellular matrix (ECM) and neighboring cells during migration. These mechanical forces play crucial roles in regulating cell migratory behaviors. Although a variety of studies have focused on describing single-cell or the collective cell migration behaviors, a fully mechanistic understanding of how the cell-cell (intercellular) and cell-ECM (extracellular) traction forces individually and cooperatively regulate single-cell migration and coordinate multicellular movement in a cellular monolayer is still lacking. Here, we developed an integrated experimental and analytical system to examine both the intercellular and extracellular traction forces acting on individual cells within an endothelial cell colony as well as their roles in guiding cell migratory behaviors (i.e., cell translation and rotation). Combined with force, multipole, and moment analysis, our results revealed that traction force dominates in regulating cell active translation, whereas intercellular force actively modulates cell rotation. Our findings advance the understanding of the intricacies of cell-cell and cell-ECM forces in regulating cellular migratory behaviors that occur during the monolayer development and may yield deeper insights into the single-cell dynamic behaviors during tissue development, embryogenesis, and wound healing.


Figures

Figure 1
Figure 1
Spatiotemporal mapping of single cell traction and intercellular forces in a monolayer. (a) Phase-field image of the cells on a TFM substrate. (b) Traction force exerted by the cellular colony. (c) Traction and intercellular forces of individual cells: the color of the cells corresponds to the magnitude of the average traction force, and the size of the arrow represents the magnitude of the intercellular force. (d) Phase-field images show an outline of the cell as it migrates over a period of 45 min. (e) Images show the traction force field (yellow arrows) exerted by the cell and the corresponding intercellular forces (blue arrows). (f) The trajectory of the cell as it moves over the course of 45 min. (g) Cellular rotation quantified by the nuclear orientation, in which the black arrows determine the orientation at a given time.
Figure 2
Figure 2
Effect of forces in guiding translation in cells in a monolayer. (a) Different types of cells inside a colony, translating, rotating, and dividing cells. (b) Graph shows the distribution of angular difference between the pole of traction force and the displacement of the cells with (b) cellular velocity and (c) angular velocity, for translating, rotating, and dividing cells. (d) Cellular translation in Single cell and translating cells in a cellular colony. The image on the extreme left shows the phase-field images of the cells; the middle image corresponds to the traction force (light gray arrows), matrix eigenvectors of traction field depicting the poles (white arrows), and the displacement of the nucleus between two time frames, 5 min apart (dark gray arrow); and the image on the extreme right corresponds to the trajectory of the cells over a period of 135 min. (e) Graph depicts the probability of the angle between the pole of the force and the cellular translation (left) and the probability of the angle between cell translation and the direction of intercellular force (right). (f) Box and whisker plot of the total cell-ECM force exerted by translating, rotating, and dividing cells. (g) Average traction stress (total traction force divided by total cell area) exerted by translating, rotating, and dividing cells shown by a box and whisker plot. (h) Error plot shows the angular difference between the pole of traction field and the cellular translation, plotted against the cellular velocity (left) and, (i) angular velocity (right). Data represent the mean ± error. The p-values were calculated using the Student’s paired sample t-test. p < 0.05, ∗∗p < 0.001. Number of cells ≥10, and the number of experiments = 4 for each condition.
Figure 3
Figure 3
Intercellular torque change regulates cell angular velocity and has a more significant effect on rotating cells. (a) The concept of torque and the calculation of nuclear rotation. Here, forces are intercellular forces, and the distance is calculated between the nuclear centroid and the point of action of the force. (b) Plot shows the distribution of intercellular torque in a cellular colony. (c) Box and whisker plot shows the intercellular force acting on translating, rotating, and dividing cells. (d) Intercellular stress acting on translating, rotating, and dividing cells, signifying the force per unit interface length, as depicted by a box and whisker plot. (e) Box and whisker plot shows the distribution of intercellular torque acting on translating, rotating, and dividing cells. (f) Scatter plot shows the normalized change in nuclear angle versus the normalized change in intercellular torque in translating, rotating, and dividing cells. (g) Representative curves of normalized change in nuclear orientation and the normalized change in nuclear torque over a period of 45 min in translating, rotating, and dividing cells, and measurements were taken every 5 min. Data represent the mean ± error. The p-values were calculated using the Student’s paired sample t-test. p < 0.05, ∗∗p < 0.001. Number of cells ≥10, and the number of experiments = 4 for each condition.

References

    1. Li L., He Y., Jiang J. Collective cell migration: implications for wound healing and cancer invasion. Burns Trauma. 2013;1:21–26. - PMC - PubMed
    1. Poujade M., Grasland-Mongrain E., Silberzan P. Collective migration of an epithelial monolayer in response to a model wound. Proc. Natl. Acad. Sci. USA. 2007;104:15988–15993. - PMC - PubMed
    1. Wood W., Jacinto A., Martin P. Wound healing recapitulates morphogenesis in Drosophila embryos. Nat. Cell Biol. 2002;4:907–912. - PubMed
    1. Köppen M., Fernández B.G., Heisenberg C.P. Coordinated cell-shape changes control epithelial movement in zebrafish and Drosophila. Development. 2006;133:2671–2681. - PubMed
    1. Bretscher M.S. On the shape of migrating cells--a ‘front-to-back’ model. J. Cell Sci. 2008;121:2625–2628. - PubMed

Publication types

LinkOut - more resources