. 2020 Jan:151:104539.
doi: 10.1016/j.phrs.2019.104539. Epub 2019 Nov 7.

SKA-31, an activator of Ca2+-activated K+ channels, improves cardiovascular function in aging

Affiliations

SKA-31, an activator of Ca2+-activated K+ channels, improves cardiovascular function in aging

Cini Mathew John et al. Pharmacol Res. 2020 Jan.

Abstract

Aging represents an independent risk factor for the development of cardiovascular disease, and is associated with complex structural and functional alterations in the vasculature, such as endothelial dysfunction. Small- and intermediate-conductance, Ca2+-activated K+ channels (KCa2.3 and KCa3.1, respectively) are prominently expressed in the vascular endothelium, and pharmacological activators of these channels induce robust vasodilation upon acute exposure in isolated arteries and intact animals. However, the effects of prolonged in vivo administration of such compounds are unknown. In our study, we hypothesized that such treatment would ameliorate aging-related cardiovascular deficits. Aged (∼18 months) male Sprague Dawley rats were treated daily with either vehicle or the KCa channel activator SKA-31 (10 mg/kg, intraperitoneal injection; n = 6/group) for 8 weeks, followed by echocardiography, arterial pressure myography, immune cell and plasma cytokine characterization, and tissue histology. Our results show that SKA-31 administration improved endothelium-dependent vasodilation, reduced agonist-induced vascular contractility, and prevented the aging-associated declines in cardiac ejection fraction, stroke volume and fractional shortening, and further improved the expression of endothelial KCa channels and associated cell signalling components to levels similar to those observed in young male rats (∼5 months at end of study). SKA-31 administration did not promote pro-inflammatory changes in either T cell populations or plasma cytokines/chemokines, and we observed no overt tissue histopathology in heart, kidney, aorta, brain, liver and spleen. SKA-31 treatment in young rats had little to no effect on vascular reactivity, select protein expression, tissue histology, plasma cytokines/chemokines or immune cell properties. Collectively, these data demonstrate that administration of the KCa channel activator SKA-31 improved aging-related cardiovascular function, without adversely affecting the immune system or promoting tissue toxicity.

Keywords: Aging; Arteries; Ca(2+)-activated K(+) channels; Heart; Immune system.


Conflict of interest statement

Disclosures

The authors declare that they have no disclosures or competing financial interests related to this study.

Figures
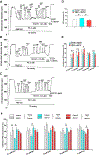
Figure 1 -
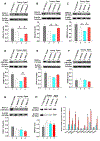
Figure 1 -. SKA-31 administration improves vascular reactivity in isolated arteries.
Panels A-C display representative tracings showing vasodilatory responses evoked by acetylcholine (ACh, 0.3 μM), bradykinin (BK, 0.3 μM), sodium nitroprusside (SNP, 10 μM), adenosine (ADO, 10 μM) and pinacidil (Pina, 5 μM) in phenylephrine (PE) pre-constricted mesenteric arteries isolated from vehicle treated young (A), vehicle treated aged (B) and SKA-31 treated (10 mg/kg) aged male rats (C). The horizontal bars above and below the intraluminal diameter tracing indicate exposure to individual agents. In the second half of the protocol, arteries were acutely incubated with 0.3 μM SKA-31 to evaluate the potential augmentation of evoked vasodilation. (D) Histogram quantifying the average PE-induced contractile tone (% of maximal intraluminal diameter) in mesenteric arteries isolated from vehicle and SKA treated aged rats, and vehicle treated young rats. Each bar represents the calculated mean ± S.D. (n = 4–5 animals). (E) Histogram quantifying the inhibition of PE induced tone in isolated mesenteric arteries (n = 4–5 arteries/condition, mean ± S.D). The asterisk (*) denotes a statistically significant difference between the indicated groups, as determined by ANOVA, P < 0.05. (F) Histogram quantifying the mean inhibitory response generated by vasodilatory agents in isolated mesenteric arteries from vehicle treated young rats, and either vehicle or SKA-31 treated aged rats, and in the absence (solid bar) and presence of 0.3 μM SKA-31 (striped bar) (means ± S.D., with n = 4–5 animals for each experimental condition). The asterisk (*) denotes a statistically significant difference vs. responses in the absence of SKA-31 exposure, as determined by a paired Student’s t-test, P < 0.05.
Figure 2 -
Figure 2 -. SKA-31 administration modulates the expression of key proteins in mesenteric arteries.
Representative western blots and quantitative analysis of KCa3.1 channel (A), KCa2.3 channel (B), SERCA2 (C), type 1 IP3 receptor (IP3R1) (D), endothelial NO synthase (E), type 1α protein kinase G (PKG1α) (F), KCa1.1 channel (G) and TRPV4 channel (H) in mesenteric artery homogenates derived from vehicle treated young (white), vehicle treated aged (blue) and SKA-31 treated aged rats (red). For each primary antibody tested, a lysate derived from a tissue or recombinant cell (RC) line expressing the target protein was included as a positive control, and is displayed in lane 1 of each blot. Staining intensities of the selected immuno-reactive bands are expressed as a ratio with detected β-actin expression in the same homogenate. The asterisk signifies a statistical difference between the indicated groups (n = 4–5 animals), as determined by ANOVA and a Tukey post-hoc test, P < 0.05. Full length, uncropped images of the blots displayed in this figure are presented in Supplementary Figure 5. Panel I shows the mRNA levels of key signaling proteins in mesenteric arteries from SKA-31 treated aged rats (red bars), in comparison with vehicle treated aged rats (blue bars), as determined by qPCR analysis. Data in aged animals are normalized to the expression level of the same target mRNA detected in mesenteric arteries from vehicle treated young rats; data normalization was calculated using REST software. GAPDH was utilized as an internal reference mRNA in all determinations. The asterisk indicates a statistically significant difference (P < 0.05) compared with vehicle treated aged rats, as determined by an unpaired Student’s t-test (n = 4–5 animals/group).
Figure 3 -
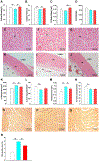
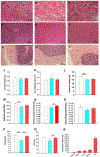
Figure 3 -. SKA-31 treatment improves cardiovascular structure and function
Panels A-D depict primary parameters (i.e. fractional shortening, ejection fraction, stroke volume and heart rate) of cardiac function, as determined by echocardiographic imaging (B-mode and M-mode) and analyses, in vehicle treated young animals (white), vehicle (blue) and SKA-31 treated (red) aged rats. Data are expressed as means ± S.D. The asterisk indicates a statistically difference between the indicated groups, as determined by ANOVA and a Tukey’s post-hoc test (n = 6 animals/group, P˂ 0.05). Panels E-G present H&E staining (400x magnification) of the left ventricular free wall from young rats (E), vehicle (F) and SKA-31 treated aged rats (G). Scale bar in the bottom right corner of each image represents 50 microns; MC: myocyte. The H&E stained sections in panels H-J (400x magnification) depict cross sections of thoracic aorta isolated from young animals (H), vehicle (I) and SKA-31 treated aged rats (J). Scale bar in the bottom right corner of each image represents 50 microns; TA: tunica adventitia, TM: tunica media, CT: connective tissue. Panels K and L quantify the size of individual LV myocytes (n ≥50 cells analyzed per tissue) and the density/number of LV myocytes per 5mm2 of tissue area in the three treatment groups, respectively. Medial layer thickness of the thoracic aorta and the density/number of aortic myocytes per 5 mm2 of tissue area are depicted in panels M and N, respectively. Colour coding as in panels A-D. Panels O-Q display representative picrosirius red-stained sections of the left ventricular (LV) free wall from young rats (O), vehicle (P) and SKA-31 treated aged rats (Q). Scale bar in the bottom right corner of each image represents 50 microns. The histogram in panel R quantifies the picrosirius red (PSR)-positive area in LV tissue from each group. Measurements of cell and tissue dimensions were performed using a manual tracing function in ImageJ. Statistical analysis was performed using one-way ANOVA, followed by a Tukey’s post-hoc test (n = 6 animals); * denotes a statistically significant difference between the indicated groups, P < 0.05.
Figure 4 –
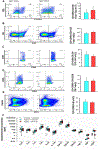
Figure 4 –. Long-term SKA-31 treatment does not promote a pro-inflammatory state
Panels A-E display representative flow cytometry profiles of immune cell subsets isolated from the spleens of vehicle (left column) and SKA-31 treated (middle column) aged rats, together with associated quantification (right column). In the lymphocyte population, T cells were gated as CD3+CD45RA- and further gated to regulatory T cells (CD4+CD25+HiFoxp3+, P = 0.063) (A), helper T cells (CD4+CD8−, P = 0.063) (B), NKT cells (CD4-CD8+CD161Hi, P = 0.463) (C), T effectors (CD4+CD25HiCD8−, P = 0.465) (D) and B cells (CD3-CD45RA+, P = 0.210) (E). Results displayed in histograms represent the percentage of the parental population (i.e. the percentage of CD4+CD8− T cells is reported as a percentage of CD3+ T cells, not total T cells). Blue = vehicle treated aged rats, red = SKA-31 treated animals. The two groups were compared statistically using a Mann-Whitney test, and the data are expressed as means ± S.D. (n=6 animals). (F) Quantification of select cytokines/chemokines in plasma from vehicle and SKA-31 treated aged animals, and vehicle treated young rats. Vertically arranged data points represent individual concentration values in pg/ml for a given factor within a given treatment group, as identified in the legend, and are plotted on a logarithmic scale. Solid triangles and error bars indicate the mean ± S.D. for each factor/group. The presence of an asterisk above a symbol column denotes a statistically significant difference vs. the vehicle-treated young group, P < 0.05. The complete list of cytokines/chemokines measured in all three treatment groups is presented in Supplementary Table 5.
Figure 5 -
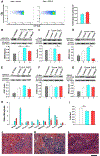
Figure 5 -. SKA-31 administration regulates the expression of calcineurin/NFAT signaling components in T cells
Panel A displays representative FACS analysis of splenic lymphocytes (1×10⁶ cells) isolated from vehicle and SKA-31 treated aged rats, which were first labeled with CFSE, stimulated with phytohemagglutinin A and cultured for ~5 days at 37°C. Cells were then labeled with anti-CD4 BV510 to enable discrimination between other splenic cells. Events (~200,000) were identified based on the fluorescence intensity above the background auto-fluorescence level, ensuring that only CFSE-positive events were analyzed. The selected fluorescence intensities reflect gating of the proliferative T cell population in each treatment group. Blue represents the lowest fluorescence intensity; red represents the highest. The accompanying histogram depicts cell division in the T cell compartment, as revealed by anti-CD4+ staining. Blue = vehicle treated aged rats, red = SKA-31 treated animals. Panels B-G present western blot analysis and quantification of NFATC1 (B), calcineurin catalytic subunit (C), SERCA2 ATPase (D), KCa3.1 channel (E), STIM1 (F) and ORAI1 channel (G) in splenic CD4+ T cells from vehicle treated young (white), vehicle treated aged (blue) and SKA-31-treated aged rats (red). For each primary antibody tested, a lysate derived from a tissue or recombinant cell (RC) expressing the target protein was included as a positive control, and is displayed in lane 1 of each blot. Staining intensities of the various immuno-reactive bands detected in T cell homogenates are expressed as a function of β-actin (n = 4 animals/group). An asterisk signifies a statistically significant difference between the two indicated groups, as determined by one-way ANOVA and a Tukey’s post-hoc test (P < 0.05). Note that full length, uncropped images of the blots displayed in this figure are presented in Supplementary Figure 11. Panel H displays the mRNA expression of key signaling proteins in splenic CD4+ T cells from vehicle (blue) and SKA-31 treated (red) aged rats. The qPCR results for each target have been normalized to the mRNA expression of the same gene observed in vehicle treated young animals; GAPDH was utilized as the internal reference gene for all qPCR analyses. Relative mRNA expression was calculated using REST software. An asterisk indicates a statistical difference compared with the vehicle treated aged rats, as determined by an unpaired Student’s t-test (P<0.05) (n=3–5 animals/group). Panel I displays the quantification of cells per 5mm2 of H&E stained sections of intact spleen from vehicle treated young animals (white bars), vehicle (blue bars) and SKA-31 treated aged rats (red bars), as determined by ImageJ software (n=6 animals/group). Panels J-L show H&E staining of spleen sections (400x magnification) from vehicle treated young animals (J), vehicle (K) and SKA-31 treated (L) aged rats. The scale bar beneath the bottom right corner of panel L represents 50 microns and applies to all three images; RP: Red Pulp, WP: White Pulp, MZ: Marginal Zone, A: Artery.
Figure 6 –
Figure 6 –. Long-term SKA-31 administration does not induce gross tissue damage.
Panels A-C display H&E histological staining of kidney sections (400x magnification) derived from vehicle treated young animals (A) and aged rats treated with either vehicle (B) or 10 mg/kg SKA-31 (C). BC: Bowman’s capsule, BS: Bowman’s Space, G: Glomerulus. H&E staining of liver sections (400x magnification) from vehicle treated young animals, and vehicle and SKA-31 treated aged rats is presented in panels D, E and F, respectively. H: Hepatocyte, N: Nucleus, S: Sinusoid, PV: Portal Vein. Panels G-I illustrate H&E staining of brain cerebellar sections (400x magnification) from vehicle treated young animals (G), and vehicle (H) and SKA-31 treated aged rats (I). GL: Granule cell Layer, PC: Purkinje Cells, ML: Molecular cell Layer. The scale bar displayed in the bottom right corner of each image represents 50 microns. Quantification of select histological parameters in kidney, liver and cerebellum is presented in panels J-Q, as follows: glomerular size relative to area of Bowman’s capsule (J), area of Bowman’s space relative to Bowman’s capsule (K), hepatocyte diameter (L), hepatocyte density per 5mm2 (M), molecular cell layer thickness in the cerebellum (N), granule cell layer thickness in the cerebellum (O), cerebellar Purkinje cell density per 5mm2 (P) and number of Purkinje cells per millimetre length of the molecular layer (Q). Structural measurements in stained sections were carried out using ImageJ software. White bars = vehicle-treated young rats, blue = vehicle treated aged rats, and red = SKA-31 treated aged rats. Statistical analyses were performed using one-way ANOVA and a Tukey’s post-hoc test; the asterisk indicates a statistically significant difference between the indicated groups, P < 0.05 (n = 6 animals/group). The histogram in panel R shows the total plasma and tissue concentrations of SKA-31 in aged rats, as determined by LC/MS analysis. Tissues and plasma were collected at the time of euthanasia, approximately 18 hours following the final i.p. injection of SKA-31 (n = 6). Adipose (fat) tissue was obtained from the abdominal region. No SKA-31 was detected in material from vehicle treated animals.

Similar articles

Cited by

References

    1. Lakatta EG, Levy D. Arterial and cardiac aging: major shareholders in cardiovascular disease enterprises: Part I: aging arteries: a “set up” for vascular disease. Circulation. 2003;107(1):139–146. - PubMed
    1. Dai Z, Aoki T, Fukumoto Y, Shimokawa H. Coronary perivascular fibrosis is associated with impairment of coronary blood flow in patients with non-ischemic heart failure. J. Cardiol 2012;60(5):416–421. - PubMed
    1. Donato AJ, Morgan RG, Walker AE, Lesniewski LA. Cellular and molecular biology of aging endothelial cells. Journal of Molecular and Cellular Cardiology. 2015;89(Pt B):122–135. - PMC - PubMed
    1. Seals DR, Jablonski KL, Donato AJ. Aging and vascular endothelial function in humans. Clinical Science. 2011;120(9):357–375. - PMC - PubMed
    1. Gates PE, Strain WD, Shore AC. Human endothelial function and microvascular ageing. Experimental Physiology 2009;94(3):311–316. - PubMed

Publication types

Substances