

Gene expression analysis of the cerebellar cortex in essential tremor
- PMID: 31707044
- PMCID: PMC7593093
- DOI: 10.1016/j.neulet.2019.134540
Gene expression analysis of the cerebellar cortex in essential tremor
Abstract
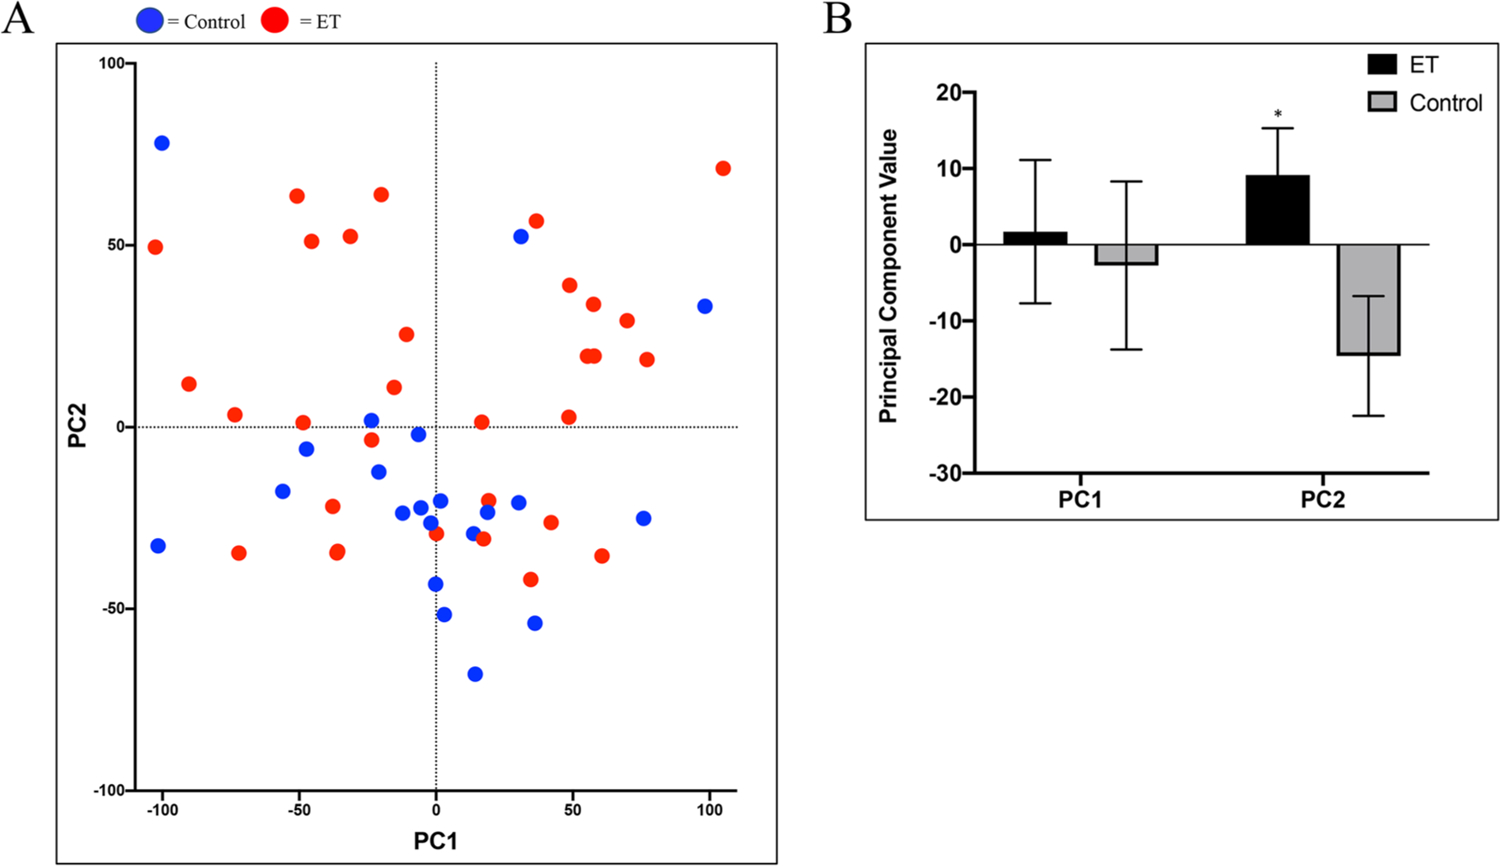
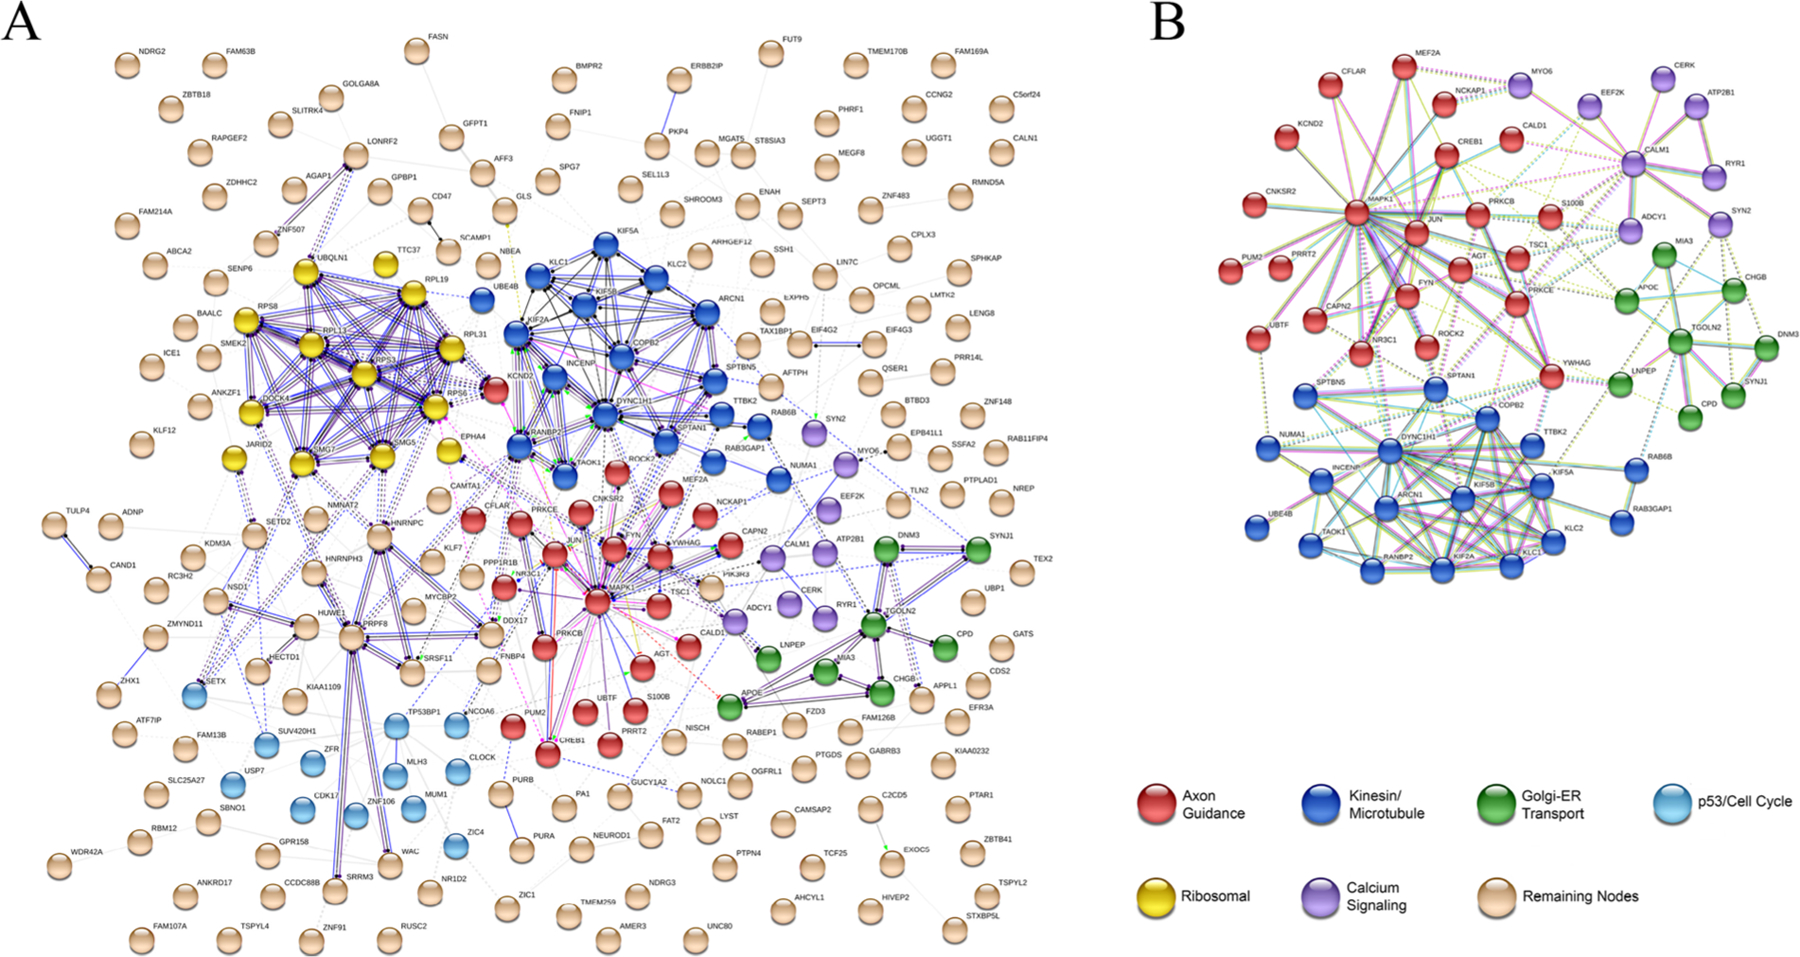
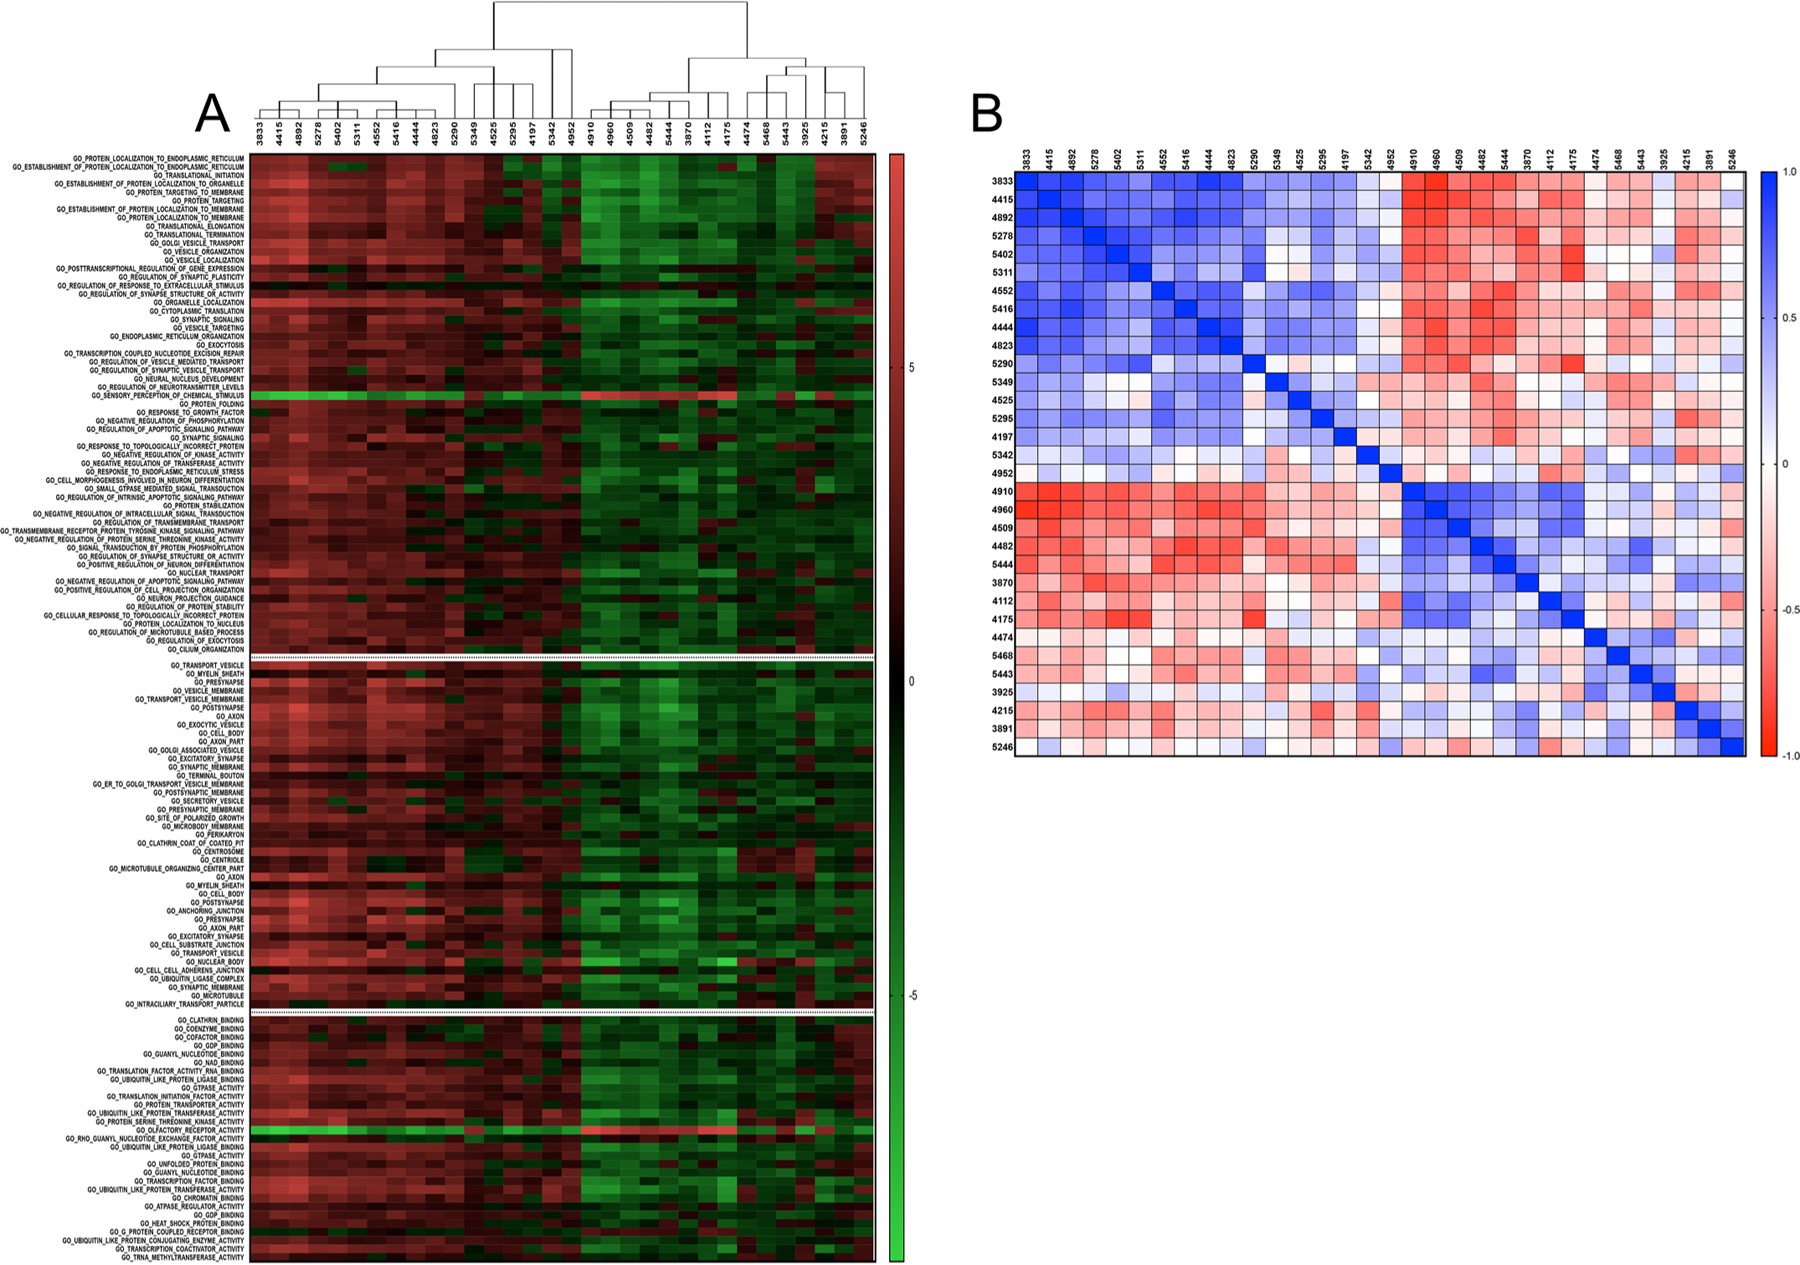
Essential tremor (ET) is one of the most common neurological diseases, with a central feature of an 8-12 Hz kinetic tremor. While previous postmortem studies have identified a cluster of morphological changes in the ET cerebellum centered in/around the Purkinje cell (PC) population, including a loss of PCs in some studies, the underlying molecular mechanisms for these changes are not clear. As genomic studies of ET patients have yet to identify major genetic contributors and animal models that fully recapitulate the human disease do not yet exist, the study of human tissue is currently the most applicable method to gain a mechanistic insight into ET disease pathogenesis. To begin exploration of an underlying molecular source of ET disease pathogenesis, we have performed the first transcriptomic analysis by direct sequencing of RNA from frozen cerebellar cortex tissue in 33 ET patients compared to 21 normal controls. Principal component analysis showed a heterogenous distribution of the expression data in ET patients that only partially overlapped with control patients. Differential expression analysis identified 231 differentially expressed gene transcripts ('top gene hits'), a subset of which has defined expression profiles in the cerebellum across neuronal and glial cell types but a largely unknown relationship to cerebellar function and/or ET pathogenesis. Gene set enrichment analysis (GSEA) identified dysregulated pathways of interest and stratified dysregulation among ET cases. By GSEA and mining curated databases, we compiled major categories of dysregulated processes and clustered string networks of known interacting proteins. Here we demonstrate that these 'top gene hits' contribute to regulation of four main biological processes, which are 1) axon guidance, 2) microtubule motor activity, 3) endoplasmic reticulum (ER) to Golgi transport and 4) calcium signaling/synaptic transmission. The results of our transcriptomic analysis suggest there is a range of different processes involved among ET cases, and draws attention to a particular set of genes and regulatory pathways that provide an initial platform to further explore the underlying biology of ET.
Keywords: Cerebellum; Essential tremor; Gene set enrichment analysis; Purkinje cell; RNA-seq; String networks.
Copyright © 2019 Elsevier B.V. All rights reserved.
Figures
References
Publication types
MeSH terms
Grants and funding
LinkOut - more resources
Full Text Sources
Molecular Biology Databases
Research Materials
