. 2020 May:87:94-111.
doi: 10.1016/j.matbio.2019.10.007. Epub 2019 Nov 9.

TonEBP-deficiency accelerates intervertebral disc degeneration underscored by matrix remodeling, cytoskeletal rearrangements, and changes in proinflammatory gene expression

Affiliations

TonEBP-deficiency accelerates intervertebral disc degeneration underscored by matrix remodeling, cytoskeletal rearrangements, and changes in proinflammatory gene expression

Steven Tessier et al. Matrix Biol. 2020 May.

Abstract

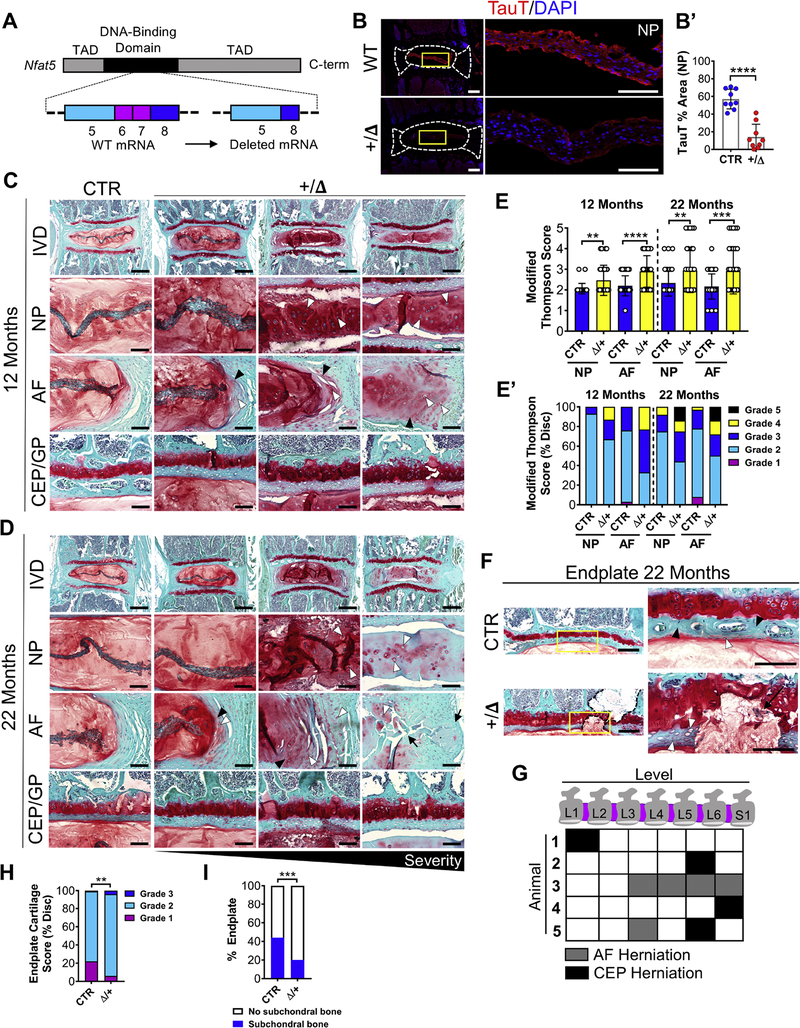
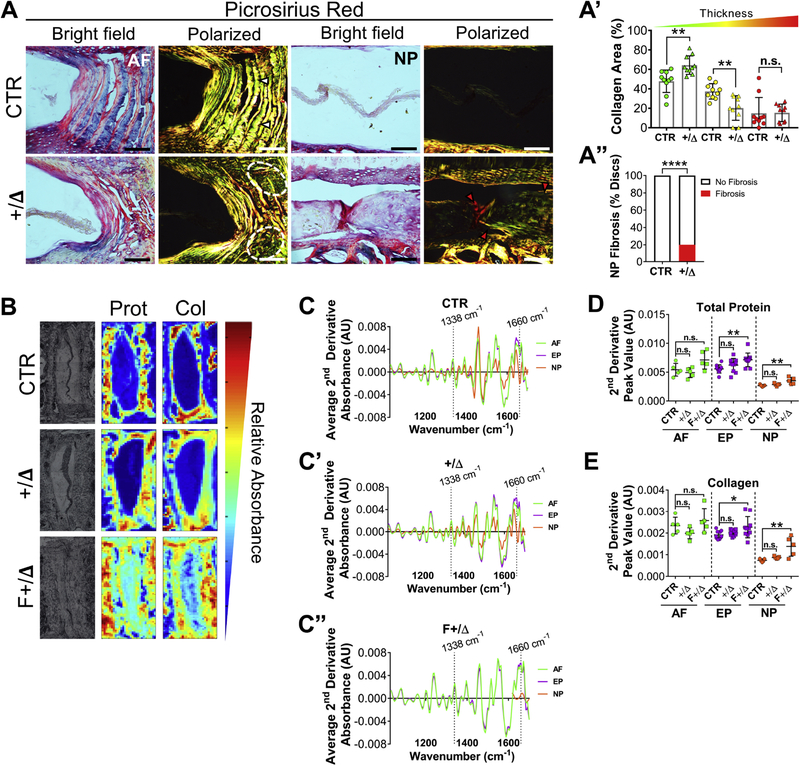
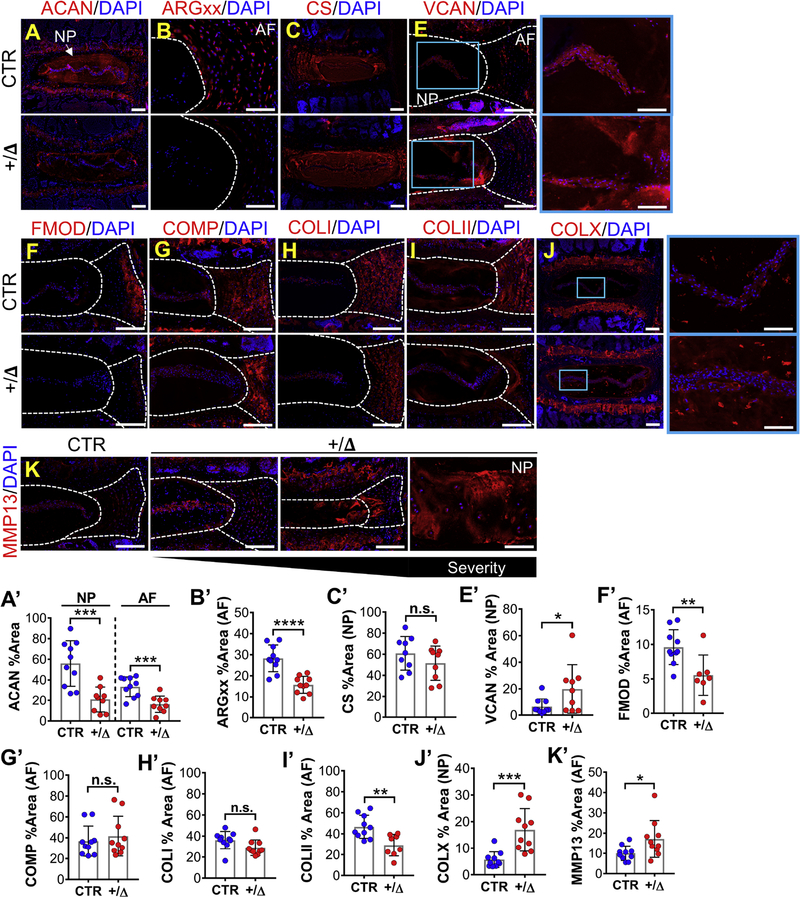
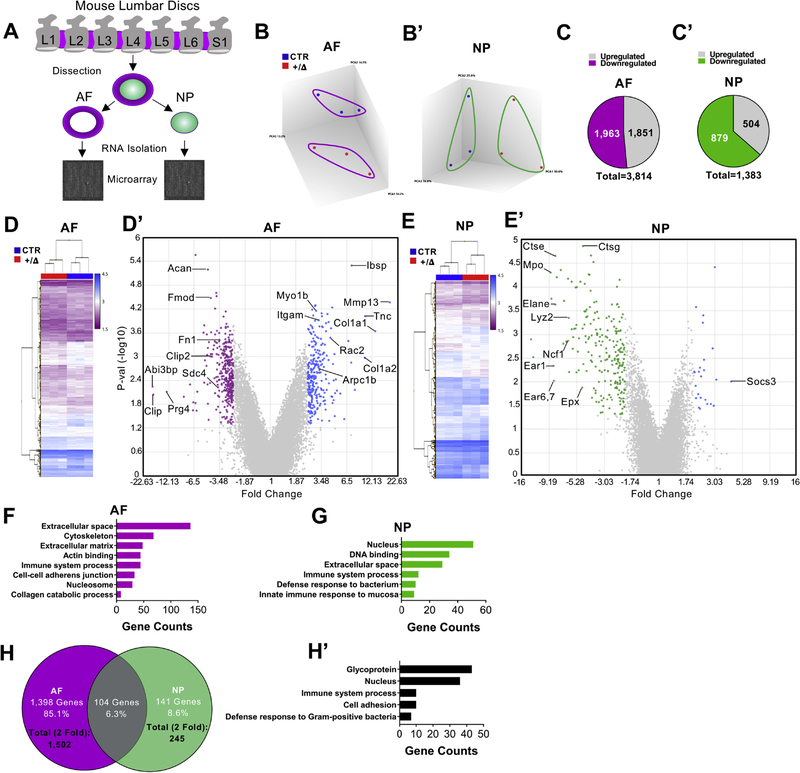
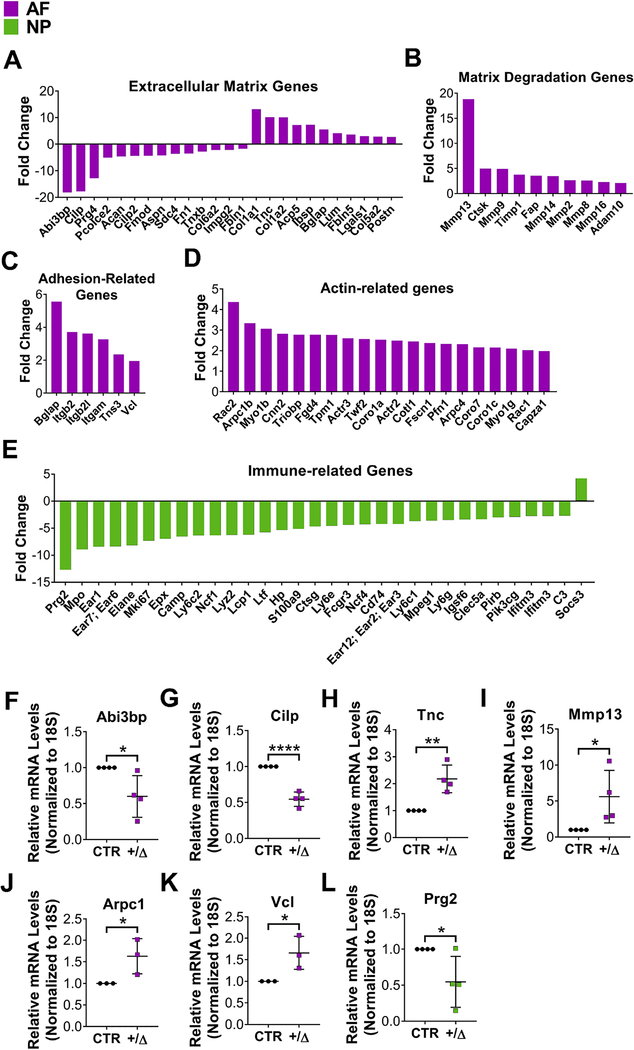
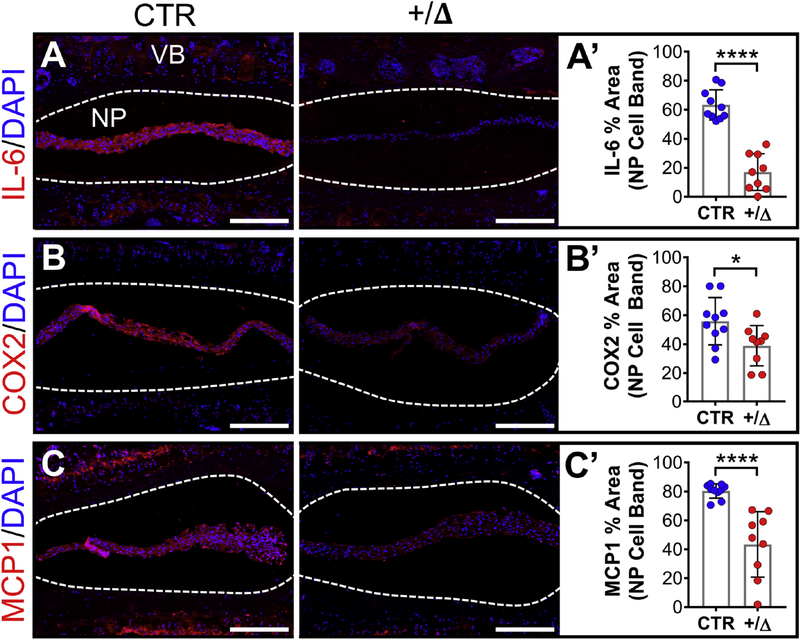
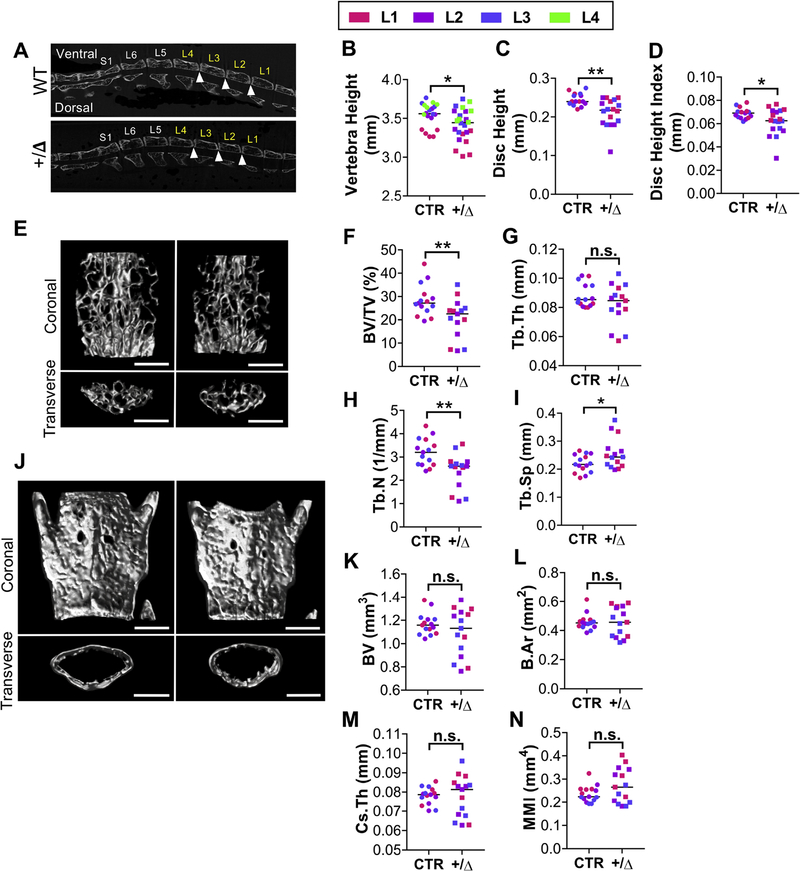
The tonicity-responsive enhancer binding protein (TonEBP) plays an important role in intervertebral disc and axial skeleton embryogenesis. However, the contribution of this osmoregulatory transcription factor in postnatal intervertebral disc homeostasis is not known in vivo. Here, we show for the first time that TonEBP-deficient mice have pronounced age-related degeneration of the intervertebral disc with annular and endplate herniations. Using FTIR-imaging spectroscopy, quantitative immunohistochemistry, and tissue-specific transcriptomic analysis, we provide morphological and molecular evidence that the overall phenotype is driven by a replacement of water-binding proteoglycans with fibrocartilaginous matrix. Whereas TonEBP deficiency in the AF compartment caused tissue fibrosis associated with alterations in actin cytoskeleton and adhesion molecules, predominant changes in pro-inflammatory pathways were seen in the NP compartment of mutants, underscoring disc compartment-specific effects. Additionally, TonEBP-deficient mice presented with compromised trabecular bone properties of vertebrae. These results provide the first in vivo support to the long-held hypothesis that TonEBP is crucial for postnatal homeostasis of the spine and controls a multitude of functions in addition to cellular osmoadaptation.

Keywords: Actin cytoskeleton; Inflammation; Intervertebral disc; Matrix remodeling; TonEBP.


Conflict of interest statement

Disclosure Statement: Declarations of interest: None

Figures

Figure 1:
Figure 1:
TonEBP deficiency accelerates age-related disc degeneration. (A) Schematic showing targeting of exons 6 and 7 of the Nfat5 gene and resultant mRNA product. (B, B’) Evaluation of taurine transporter (TauT) levels in NP cells by quantitative immunohistochemistry. 5× scale = 200 μm; 20× scale = 100 μm. Coronal sections of discs from (C) 12-month-old and (D) 22-month old animals stained by Safranin-O/Fast Green/Hematoxylin. White arrowheads show chondrocyte-like disc cells; black arrowheads show loss of NP/AF demarcation. 5× scale = 200 μm; 20× scale = 50 μm. (E) Average modified Thompson score for 12-month (n=5 mice/genotype; L1–S1, 6 discs/animal; total 30 discs/genotype) and (E) 22-month-old animals (n=6 mice/genotype; L1–S1, 6 discs/animal; total 36 discs/genotype), where higher scores indicate worsening changes. (E’) Distribution of histological grades for 12-month and 22-month-old animals. (F) High magnification image of CEPs stained by Safranin-O/Fast Green/Hematoxylin. Black arrowheads show subchondral bone; White arrowheads show CEP; black arrow shows CEP herniation. 5× scale = 100 μm; 20× scale = 50 μm. (G) Level-by-level mapping of AF and CEP herniation events. (H) Endplate cartilage score for combined timepoints and (I) percentage of discs with present subchondral bone within the endplate or lack thereof representing combined timepoints (n = 11 mice/genotype; L1–S1, 6 discs/animal; total 66 discs/genotype). NP: Nucleus Pulposus; AF: Annulus fibrosus; CEP: cartilaginous end plate; GP: Growth plate; VB: Vertebral body. Quantitative measurements represent mean ± SD. Significance was determined using either unpaired t-test or χ2 test where graphs represent contingency plots. n.s. = not significant; **, p ≤ 0.01; ***, p ≤ 0.001; ****, p ≤ 0.0001.
Figure 2:
Figure 2:
Disc degeneration in TonEBP-deficient mice is characterized by fibrocartilaginous changes. (A) Picrosirius Red staining of 22-month-old lumbar discs showing collagen content in AF (Left) and NP (right) tissue visualized by bright field and polarized microscopy (n=5 mice; 2 discs/mouse; 10 discs/genotype). 20× scale = 50 μm. (A’) Quantification of collagen fiber thickness distribution. (A”) Percentage of fibrotic NP compartments with Picrosirius Red-positive staining among analyzed discs. (B) Cluster analysis images of infrared spectra of total protein (Prot) and collagen (Col) content (left panels) with respect to corresponding grey-scale scans (right column). +/Δ represents non-fibrotic TonEBP hypomorphic discs whereas F+/Δ indicates the fibrotic population. (C-C”) Representative graphs of average second derivative spectra from AF, CEP, and NP clusters, inverted for positive visualization of the spectra. (D) Total protein content represented by mean absorbance peak values measured at 1660 cm−1. (E) Total collagen content represented by mean absorbance peak values measured at 1156 cm−1. AU: arbitrary units. Quantitative measurements represent mean ± SD. Significance was determined using unpaired t-test when only two groups were compared, χ2 test for the contingency plot, and one-way ANOVA for multiple comparisons. n.s. = not significant; *, p ≤ 0.05; **, p ≤ 0.01; ****, p ≤ 0.0001.
Figure 3:
Figure 3:
TonEBP-deficient discs show matrix composition characteristic of degeneration. Quantitative immunohistochemistry performed on 22-month-old lumbar discs stained by the following: (A, A’) aggrecan (ACAN); (B, B’) the aggrecanase-generated neoepitope, ARGxx; (C, C’) chondroitin sulfate (CS); (E, E’) versican β domain (VCAN); (F, F’) fibromodulin (FMOD); (G, G’) cartilage oligomeric matrix protein (COMP); (H, H’) collagen 1 (COLI); (I, I’) collagen 2 (COLII); (J, J’) collagen 10 (COLX); (K, K’) matrix metalloproteinase 13 (MMP13). (n = 5 mice; 10 discs/genotype). 5× scale = 200 μm; 20× scale = 100 μm; 40× scale = 50 μm. Quantitative measurements represent mean ± SD. Significance was determined using unpaired t-test. n.s. = not significant; *, p ≤ 0.05; **, p ≤ 0.01; ***, p ≤ 0.001; ****, p ≤ 0.0001.
Figure 4:
Figure 4:
Microarray analyses of AF and NP tissue from TonEBP-deficient discs. (A) Experimental design for microarray analysis wherein NP and AF tissues were separated and pooled upon dissection of lumbar spinal levels (L1–S1) of individual mice. (B, B’) Clustering of biological triplicates within genotypes assessed by three-dimensional principle component analysis (PCA). (C, C’) Total differential expression of genes at p ≤ 0.05 in (C) AF and (C’) NP tissues. Heatmaps of differentially expressed genes from (D) AF and (E) NP samples comparing triplicates of each genotype. Volcano plots showing the relationship between fold change (>2-fold) and p-value (–log10) for AF (D’) and (E’) NP samples. Representative annotation plots of gene sets among highest enrichment scores in (F) AF and (G) NP samples. (H) Venn diagram comparing genes differentially expressed at p ≤ 0.05 and >2-fold of AF and NP tissue from TonEBP-deficient mice. (H’) Representative annotation plots of gene sets among highest enrichment scores from the common genes identified in H. (n = 3 mice/genotype; L1–S1, 6 discs/animal).
Figure 5:
Figure 5:
Differential regulation of genes associated with extracellular matrix remodeling, cell adhesion, the actin cytoskeleton, and proinflammatory signaling in TonEBP-deficient discs. Representative expression changes from AF samples greater than 2-fold at p ≤ 0.05 of genes involved in (A) extracellular matrix composition, (B) matrix degradation, (C) cell adhesion, and (D) the actin cytoskeleton (n = 3 mice/genotype; L1–S1, 6 discs/animal). (E) Representative immune-related genes expressed in NP cells with a differential greater than 2-fold at p ≤ 0.05. (n = 3 mice/genotype). Changes in the mRNA expression levels of (F) Abi3bp, (G) Cilp, (H) Tnc, (I) Mmp13, (J) Arpc1, (K) Vcl, and (L) Prg2 (n = 3–4 mice/genotype; L1–S1, 6 discs/animal). Differential expression levels on microarray graphs are normalized to wild-type expression levels. Quantitative measurements represent mean ± SD. Significance was determined using unpaired t-test. *, p ≤ 0.05; **, p ≤ 0.01; ****, p ≤ 0.0001.
Figure 6:
Figure 6:
TonEBP-deficient NP cells show reduced levels of pro-inflammatory molecules. Quantitative immunohistochemistry performed on 22-month-old lumbar discs stained with (A, A’) interleukin-6 (IL-6), (B’ B’) cyclooxygenase-2 (COX2), and (C, C’) monocyte chemoattractant protein-1 (MCP1). (n = 5 mice; 10 discs/genotype). 10× scale = 200 μm. Quantitative measurements represent mean ± SD. Significance was determined using unpaired t-test. *, p ≤ 0.05; ****, p ≤ 0.0001.
Figure 7:
Figure 7:
Vertebral bodies of TonEBP-deficient mice show compromised trabecular bone. (A) Representative MicroCT scans of 22-month-old wild-type and mutant lumbar spines. The vertebral levels labeled in yellow indicate levels analyzed. White arrowheads indicate the disc space analyzed. (B) Vertebral height, (C) disc height, and (D) disc height index measurements are shown. (E) Coronal (Top) and transverse (Bottom) views of trabecular bone 3D reconstructions. (F) Bone volume fraction (BV/TV), (G) trabecular thickness (Tb.Th), (H) trabecular number (Tb.N) and trabecular spacing (Tb.Sp) measurements are shown. (J) Coronal (Top) and transverse (Bottom) views of cortical bone 3D reconstructions. (K) Cortical bone volume (BV), mean total cross-sectional bone area (B.Ar), cortical cross-sectional thickness (Cs.Th), and mean polar moment of inertia (MMI) measurements are shown. (n ≥ 5 mice; 15 vertebrae/genotype; 18 discs/genotype). Scale = 1 mm. Quantitative measurements represent mean ± SD. Significance was determined using unpaired t-test. n.s. = not significant; *, p ≤ 0.05; **, p ≤ 0.01.

Similar articles

Cited by

References

    1. Ghosh P, Taylor TK, Horsburgh BA. (1975) The composition and protein metabolism in the immature rabbit intervertebral disc. Cell Tissue Res 163:223–38. - PubMed
    1. Silagi ES, Shapiro IM, Risbud MV. (2018) Glycosaminoglycan synthesis in the nucleus pulposus: Dysregulation and the pathogenesis of disc degeneration. Matrix Biol 368–79. - PMC - PubMed
    1. Fields AJ, Ballatori A, Liebenberg EC, Lotz JC. (2018) Contribution of the endplates to disc degeneration. Curr Mol Biol Rep 4:151–60. - PMC - PubMed
    1. Shapiro IM, Vresilovic EJ, Risbud MV (2012). Is the spinal motion segment a diarthrodial polyaxial joint: what a nice nucleus like you doing in a joint like this? Bone 50:771–6. - PMC - PubMed
    1. Novais EJ, Diekman BO, Shapiro IM, Risbud MV. (2019) p16Ink4a deletion in cells of the intervertebral disc affects their matrix homeostasis and senescence associated secretory phenotype without altering onset of senescence. Matrix Biol. 82:54–70. - PMC - PubMed

Publication types

LinkOut - more resources