. 2019 Nov 14;179(5):1144-1159.e15.
doi: 10.1016/j.cell.2019.10.015. Epub 2019 Nov 7.

Long-Term Culture Captures Injury-Repair Cycles of Colonic Stem Cells

Affiliations

Long-Term Culture Captures Injury-Repair Cycles of Colonic Stem Cells

Yi Wang et al. Cell. .

Abstract

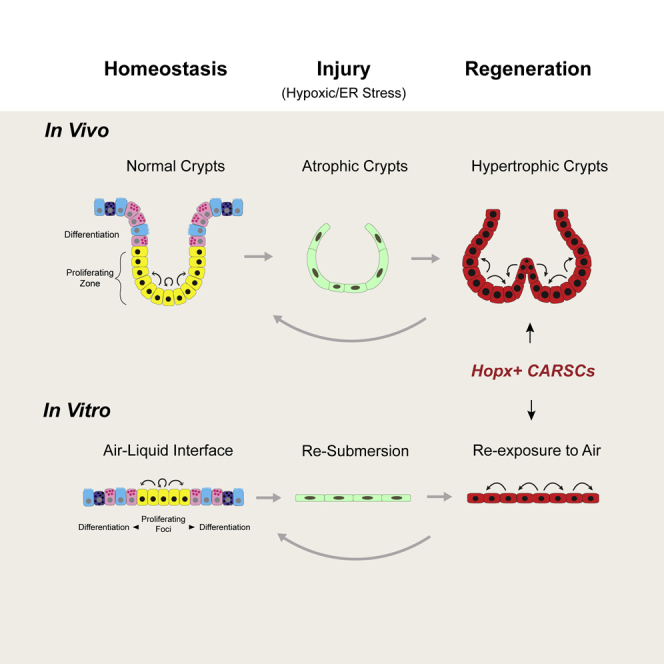
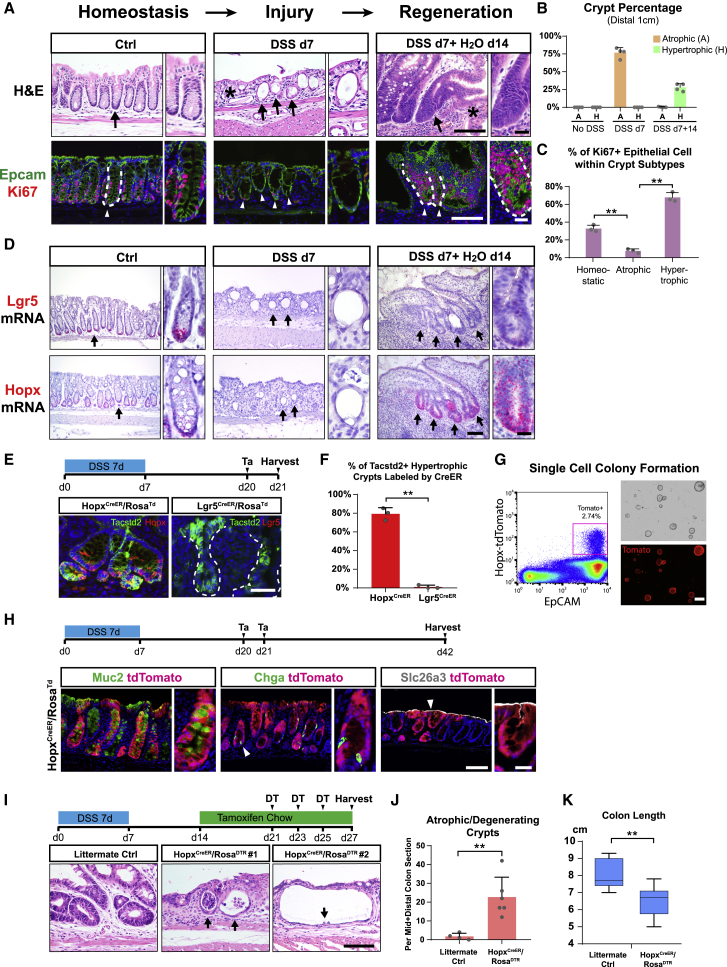
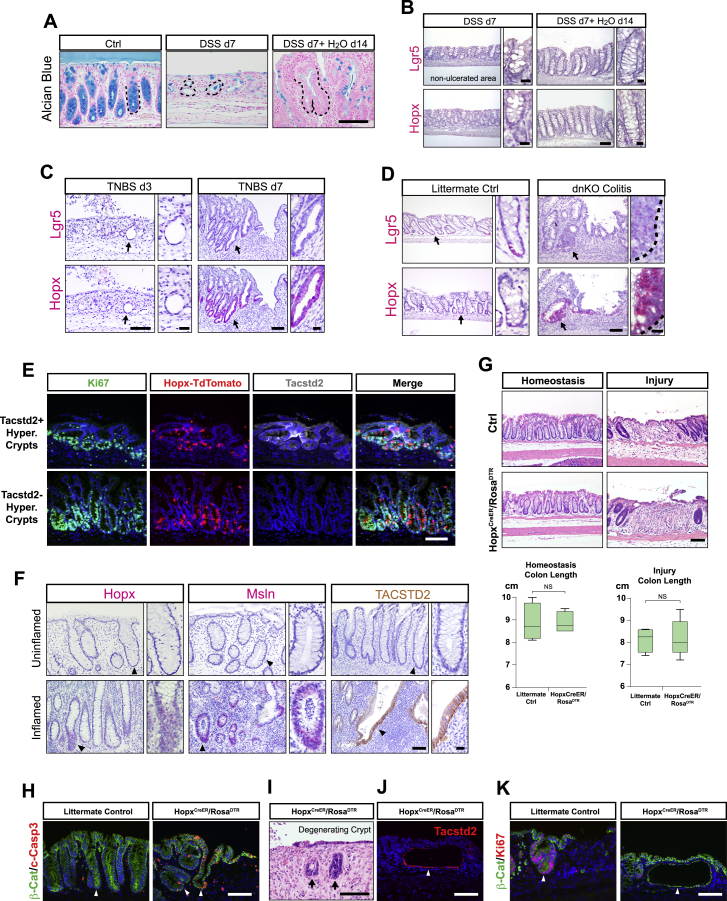
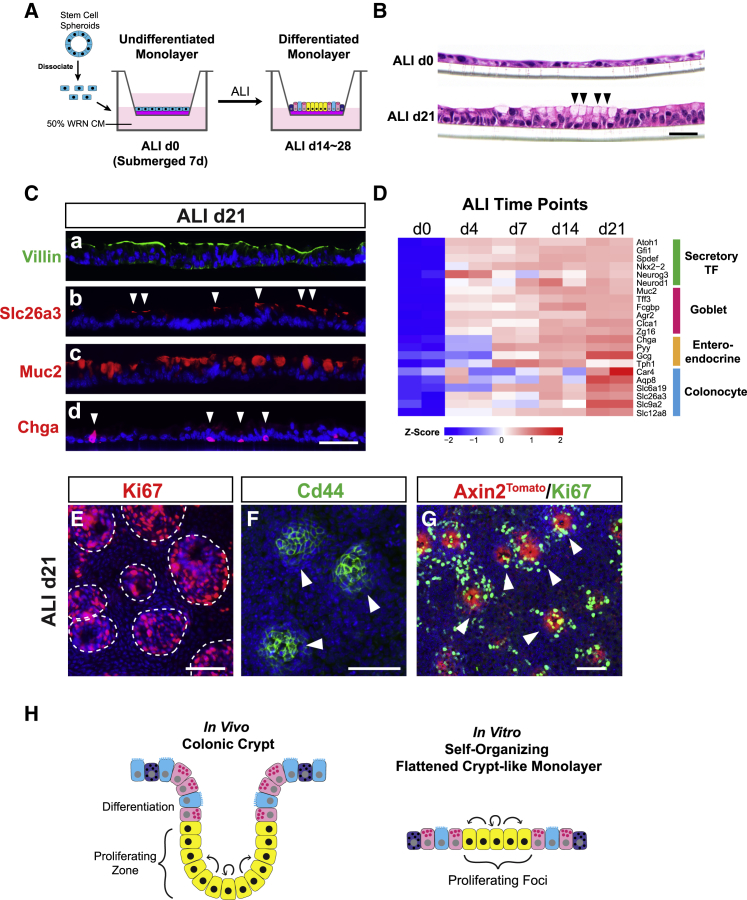
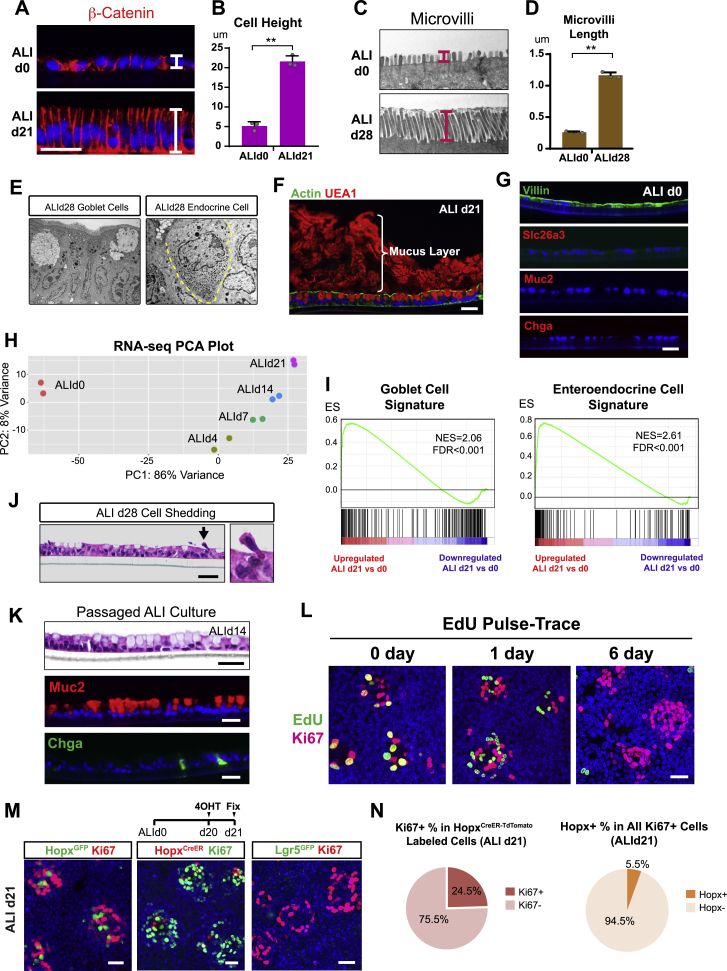
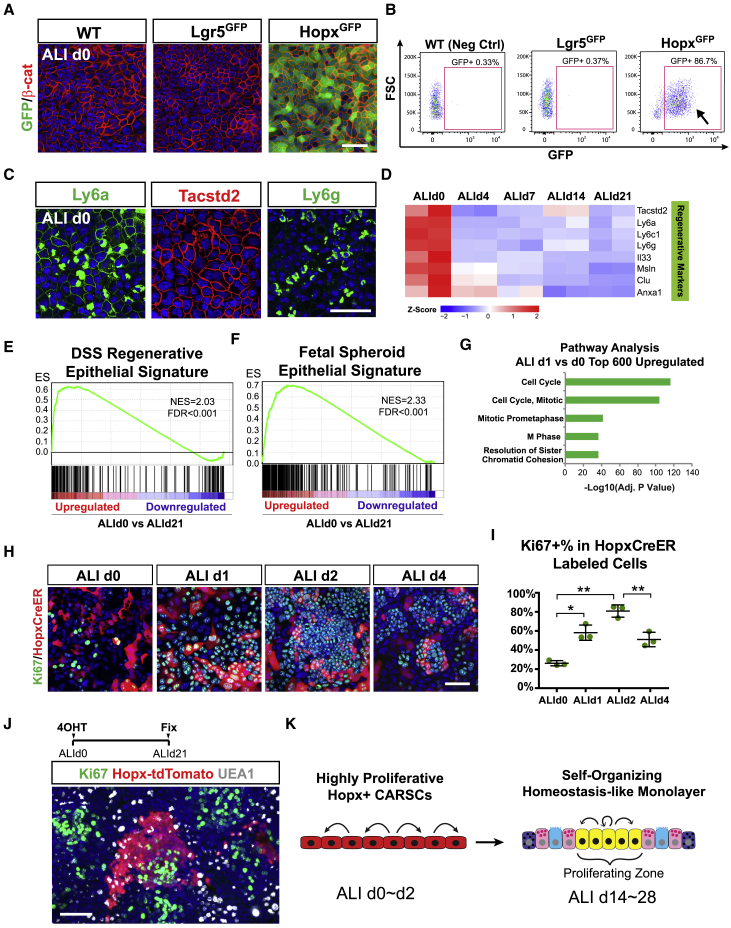
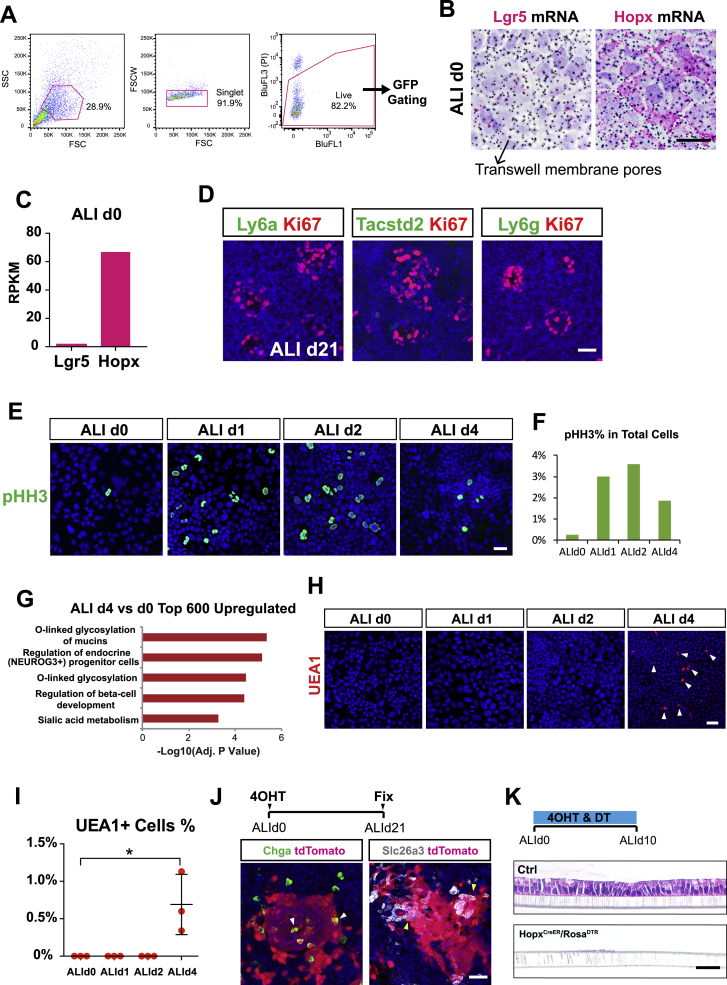
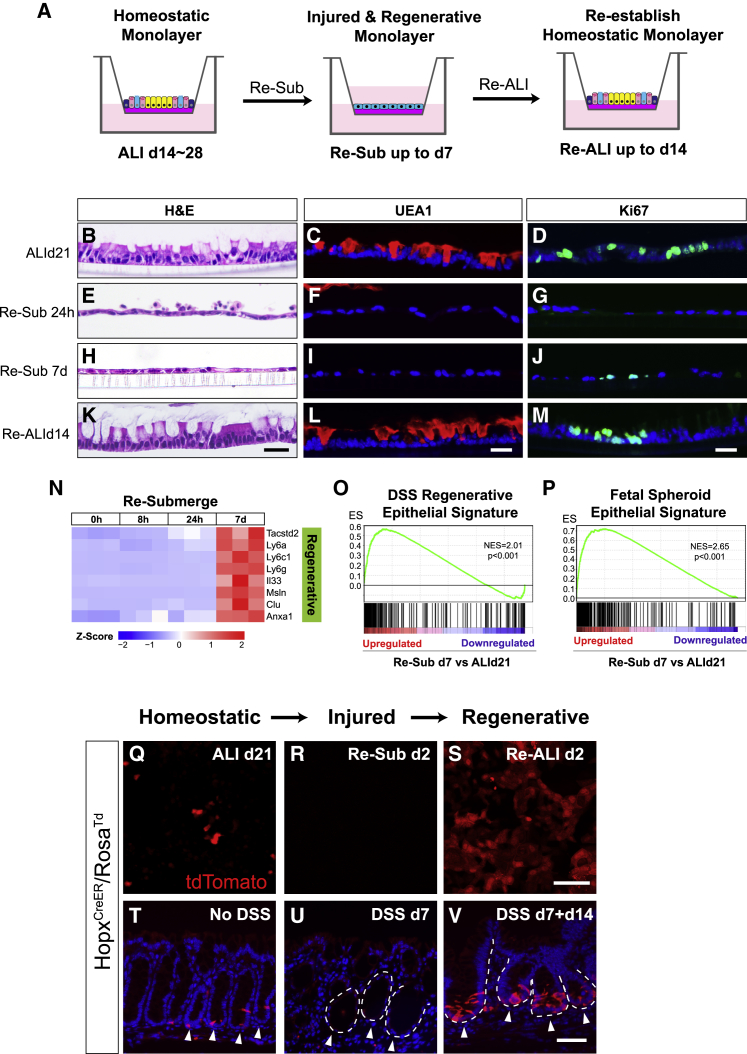
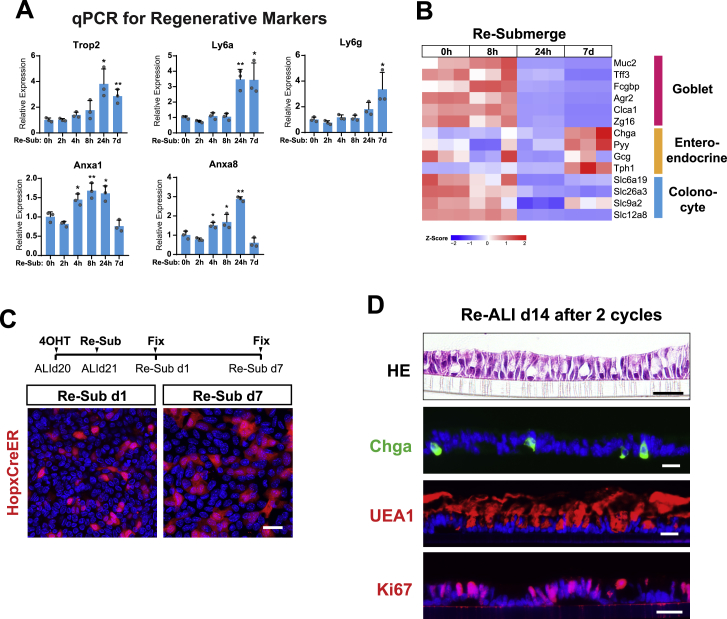
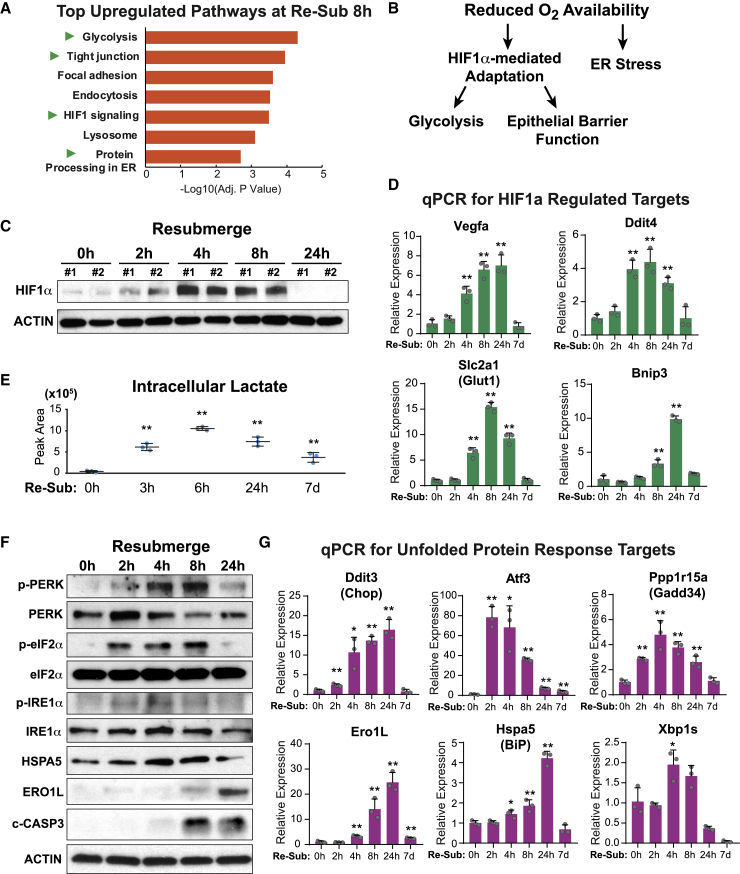
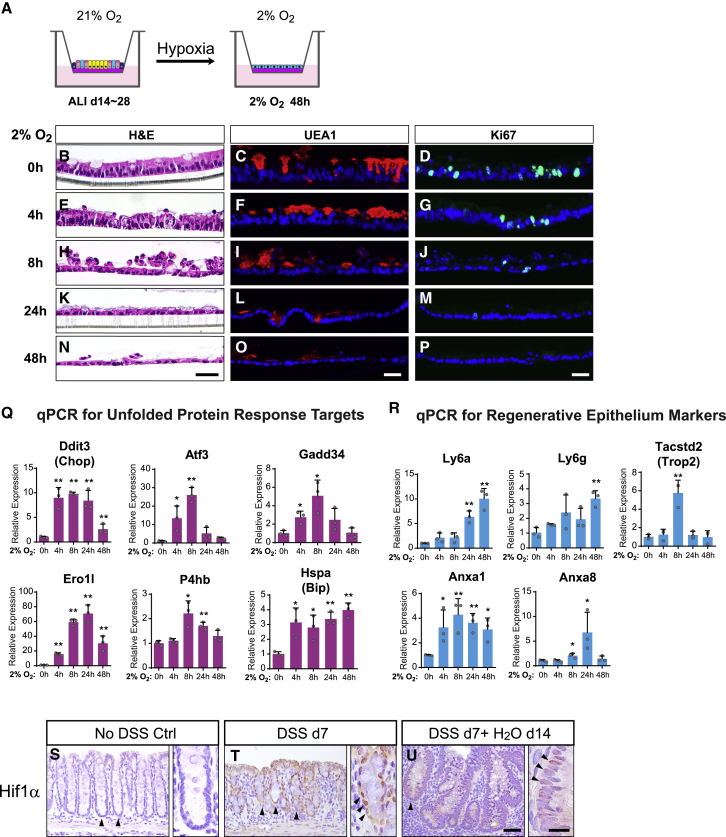
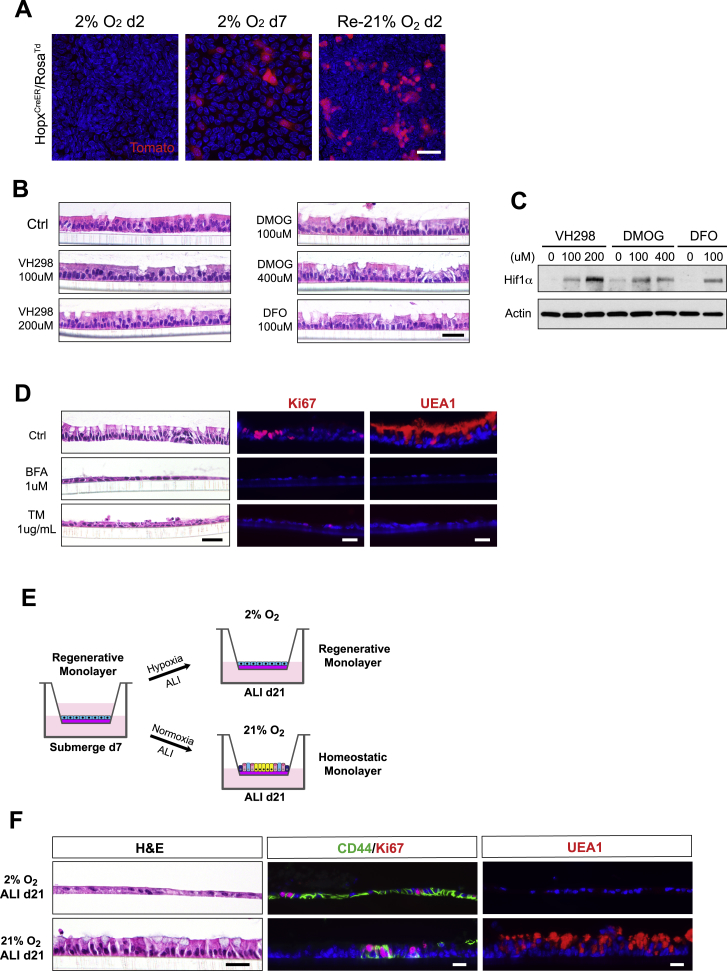
The colonic epithelium can undergo multiple rounds of damage and repair, often in response to excessive inflammation. The responsive stem cell that mediates this process is unclear, in part because of a lack of in vitro models that recapitulate key epithelial changes that occur in vivo during damage and repair. Here, we identify a Hopx+ colitis-associated regenerative stem cell (CARSC) population that functionally contributes to mucosal repair in mouse models of colitis. Hopx+ CARSCs, enriched for fetal-like markers, transiently arose from hypertrophic crypts known to facilitate regeneration. Importantly, we established a long-term, self-organizing two-dimensional (2D) epithelial monolayer system to model the regenerative properties and responses of Hopx+ CARSCs. This system can reenact the "homeostasis-injury-regeneration" cycles of epithelial alterations that occur in vivo. Using this system, we found that hypoxia and endoplasmic reticulum stress, insults commonly present in inflammatory bowel diseases, mediated the cyclic switch of cellular status in this process.

Keywords: HopX; Lgr5; Transwell; air-liquid interface; colitis; colon; hypoxia; intestine; stem cell; unfolded protein response.


Conflict of interest statement

T.S.S. has served on an advisory board for Boehringer Ingelheim.

Figures

None
Graphical abstract
Figure 1
Figure 1
Hopx+ CARSCs Promote Colitis-Associated Regeneration In Vivo (A–D) Sections of colonic mucosa from wild-type (WT) mice treated with vehicle, 7 days of DSS, or 7 days of DSS with a 14-day “washout” period were stained with H&E (A, top panels), Epcam (green), Ki67 (red) (A, bottom panels), or in situ probes against Lgr5 (D, top panels) and Hopx mRNAs (D, bottom panels). Arrows and arrowheads denote crypt bases. White dashed lines indicate crypt/lamina propria boundaries. The asterisk denotes an ulcer. Percentage of atrophic (yellow) and hypertrophic (green) crypts within the distal-most colon (1 cm) under various conditions of DSS-induced colitis were plotted as mean ± SD (B) (A, atrophic crypts; H, hypertrophic crypts). The percentage of Ki67+ crypt epithelial cells was plotted as mean ± SD for homeostatic, atrophic, and hypertrophic crypts (C). n = 3–4 mice/group. (E and F) Transiently lineage-labeled cells (red) from HopxCreERT2/RosaTd or Lgr5CreERT2/RosaTd mice were co-stained with Tacstd2 (green) (E). The percentage of Tacstd2+ crypts in the mid and distal colon that were co-labeled with tdTomato from the two CreERT2 lines was plotted as mean ± SD (F). n = 3 mice/group. (G) Single Hopx+ cells at the regenerative stage of DSS-induced colitis were sorted and cultured in Matrigel with 50% L-WRN media (left panel). Light and tdTomato fluorescent images of spheroids on day 6 after plating (right panels). (H) Experimental scheme for lineage tracing assays of Hopx+ CARSCs from HopxCreERT2/RosaTd mice at the regenerative stage of DSS-induced colitis (top panel). TdTomato+ traced clones in the distal colon were co-stained with Muc2 (goblet cells), Chga (enteroendocrine cells), and Slc26a3 (colonocytes). (I–K) Experimental scheme for Hopx+ CARSCs ablation (I, top panel). Crypt morphology was defined by H&E stained colonic sections from HopxCreER/RosaDTR mice (arrows in I) and their WT littermate controls subjected to the same procedure. The number of atrophic/degenerating crypts per mid + distal colon section was plotted as mean ± SD (J). n = 4–6 mice/group. Colon length was plotted as a box-whisker plot (K). n = 7–9 mice/group. Two-tailed Student’s t test in (C), (F), and (J): ∗∗p < 0.01. Two-tailed Mann-Whitney U test in (K): ∗∗p < 0.01. Bars: (G) 500 μm; (A, D, E, H, and I) 100 μm; (insets of A, D, and H) 25 μm. Histological, in situ hybridization and immuno-fluorescent images are representative of at least 3 mice examined. See also Figure S1.
Figure S1
Figure S1
Hopx+ CARSCs Promote Colitis-Associated Regeneration In Vivo, Related to Figure 1 (A) Alcian blue staining of goblet cells present in colonic mucosa sections obtained from mice treated with no DSS, 7 days of DSS, and 7 days of DSS plus a 14-day recovery phase. Black dashed lines outlined the boundary between crypts and lamina propria. (B) In situ hybridization assay of Lgr5 and Hopx mRNA expression in crypts from areas with no ulcerations during the injury (DSS d7) and regenerative (DSS d7+ H2O d14) stages of DSS-induced colitis. Black dashed lines outlined the boundary between crypts and lamina propria. (C) In situ hybridization assay of Lgr5 and Hopx mRNA expression on colonic sections derived from BALB/c mice 3 and 7 days following acute injury by TNBS enema. Note the presence of abundant atrophic crypts on TNBS day 3 (arrows in left panels) and hypertrophic crypts on TNBS day 7 (arrows in right panels). The insets magnify areas indicated by the arrows. (D) Lgr5 and Hopx mRNA levels assayed by in situ hybridization in the dnKO spontaneous colitis model. Arrow denotes homeostatic crypts from WT littermate controls (left panels) or hypertrophic crypts from dnKO mice (right panels). The insets magnify areas indicated by the arrows. (E) Hopx+ CARSCs, transiently labeled by tamoxifen administration at the regenerative stage of DSS-induced colitis, were co-stained with Ki67 (green) and Tacstd2 (gray). Hopx-labeled hypertrophic crypts were assessed for co-localization with Tacstd2. (F) Hopx and Msln mRNA levels and TACSTD2 protein level were assayed on surgical resection or biopsy samples derived from patients with ulcerative colitis. Paired uninflamed and inflamed areas of the same sample were assayed for comparison. Images were representative of staining in the 7 patient samples. (G) H&E staining of colon sections derived from HopxCreER/RosaDTR and littermate control mice that were subject to Hopx+ cell ablation during homeostasis or at the injury phase of DSS-induced colitis. Colon lengths from each group were measured and plotted as a box-whisker plot. n = 3 mice/group. (H) Epithelial apoptosis identified by co-staining of cleaved-Caspase 3 (red) and β-catenin (green) in HopxCreER/RosaTd (arrow in right panel) and wild-type littermate control mice (arrow in left panel) after a single dose of diphtheria toxin. (I) Degenerating crypts (arrows) shown by H&E staining after ablation of Hopx+ CARSCs. (J) Atrophic-appearing crypts resulted from Hopx+ CARSCs ablation stained for Tacstd2 to examine co-localization (arrowhead). (K) Atrophic-appearing crypts resulted from Hopx+ CARSCs ablation were stained for Ki67 to examine cell proliferation (arrow in right panel). This was compared to the proliferation level of hypertrophic crypts in littermate controls subjected to the same procedure (arrow in left panel). Two-tailed Mann-Whitney U test in G: NS = Not Significant. Bars: (A-K) 100 μm; (insets of B, C, D and F) 25 μm. Histological, in situ hybridization and immuno-fluorescent images are representative of at least 3 animals examined.
Figure 2
Figure 2
In Vitro Culture of a Self-Organizing Colonic Epithelial Monolayer (A) Experimental scheme for ALI culture. (B) H&E stained sections of Transwell monolayers showed morphological changes from ALId0 to ALId21 including signs of goblet cell differentiation on ALId21 (arrowheads). (C) Sections of ALId21 monolayers stained for Villin (brush border, a), Slc26a3 (colonocytes, b, arrowheads), Muc2 (goblet cells, c), and Chga (enteroendocrine cells, d, arrowheads). (D) Heatmap of secretory cell transcription factors as well as goblet, enteroendocrine, and colonocyte markers at various stages of ALI culture. n = 2 replicates/time point. (E and F) Whole mount staining for Ki67 (E) and CD44 (F) on ALId21 marked numerous self-organizing proliferative foci. (G) ALI monolayers derived from Axin2tdTomato reporter line on ALId21 were co-stained for RFP (red) and Ki67 (green, arrowheads). (H) Diagram demonstrating that mature in vitro ALI cultures resemble flattened crypts in vivo. Bars: (B) 25 μm; (C and E–G) 50 μm. Histological and immuno-fluorescent images are representative of at least 3 Transwell samples examined. See also Figure S2 and Tables S1 and S2.
Figure S2
Figure S2
In Vitro Culture of a Self-Organizing Colonic Epithelial Monolayer, Related to Figure 2 (A-B) β-catenin staining demonstrated the distinct cell shapes on ALId0 and ALId21 (A). Cell height was quantified and plotted to compare ALId21 and ALId0 (B). n = 3 samples/group. (C-D) Microvilli length measured in the transmission electron microscopy images and compared between ALId28 and ALId0. n = 3 samples/group (10 cells per sample) (E) Transmission electron microscopy images showed the morphology of goblet cells (left panel) and enteroendocrine cells with secretory granules (right panel). Yellow dashed line outlined an enteroendocrine cell. (F) Actin (green) and UEA1 (red) double staining described polarization and the presence of a mucus layer in ALId21 monolayers. (G) Immunostaining of major colonic epithelium lineage markers on ALId0 monolayers. (H) Principal component analysis of transcriptomic profiles of monolayers harvested on ALId0, ALId4, ALId7, ALId14 and ALId21. (I) GSEA-based analysis comparing the mRNA profiles of ALId21 cells to published goblet (left panel) and enteroendocrine cells (right panel) (Jadhav et al., 2017). See also Tables S1 and S2. (J) H&E staining showed a cell extrusion event (arrow and higher power view on the right) on ALId21. (K) ALId21 monolayer culture was dissociated by trypsin digestion and re-plated onto a new Transwell followed by 7 days of submersion and 14 days of ALI. Cell morphology after the passaging procedure is defined by H&E staining. Goblet cell and enteroendocrine cell differentiation was demonstrated by Muc2 and Chga staining. (L) EdU and Ki67 co-staining on monolayers that were labeled by EdU incorporation for 3 h and washed out for various times (0, 1 and 6 days). (M-N) HopxGFP+ (left panel in M), Lgr5GFP+ (right panel in M) or HopxCreERT2 (middle panel in M) transiently labeled cells co-stained for Ki67 on ALId21. The proliferation rate of Hopx-labeled cells on ALId21 was plotted in the form of a pie chart (left panel in N). The percentage of Hopx+ cells within the Ki67% loci was plotted as a pie chart (right panel in N). n = 3 samples/group. Mean values ± SD are shown. Two-tailed Student’s t test: p < 0.05; ∗∗p < 0.01. Bars: (A, F, G, J, K, L and M) 25 μm. Histological, in situ hybridization, EM and immuno-fluorescent images are representative of at least three samples examined.
Figure 3
Figure 3
In Vitro Modeling of Hopx+ CARSCs (A and B) Whole mount images of ALId0 monolayers from WT, Lgr5GFP, and HopxGFP mice assessed for GFP (green) expression and co-stained for β-catenin (red) (A). Percentage of GFP+ cells in these monolayers as examined by flow cytometry (B). (C) Whole mount images of ALId0 monolayers stained for fetal markers Ly6a, Tacstd2, and Ly6g. (D) Heatmap of selected fetal markers in cells analyzed on ALId0, ALId4, ALId7, ALId14, and ALId21. Data are row normalized. n = 2 replicates/time point. (E and F) GSEA-based analysis comparing the mRNA profiles of ALId0 cells to the regenerative epithelium of DSS-treated mice (E) and fetal spheroid epithelium (F) (Mustata et al., 2013, Yui et al., 2018). Normalized enrichment score (NES) = 2.03 (E) and 2.33 (F). False discovery rate (FDR) < 0.001. See also Tables S3 and S4. (G) Pathway analysis (Enrichr) comparing the transcriptional signature of ALId1 cells to ALId0 cells. (H and I) Whole mount images for Ki67 staining (green) of HopxCreER/RosaTd-labeled cells (red) at early ALI time points (H). The proliferative rate of HopxCreER-labeled cells at designated ALI time points was plotted as mean ± SD (I). n = 3 samples/group. (J) Co-staining of Ki67 (green) and UEA1 (gray, goblet cells) with respect to Hopx+ clones (red) lineage-traced from ALId0 to ALId21. (K) A diagram showing that the in vitro Hopx+ CARSCs are highly proliferative on ALId0 to ALId2 and are capable of regenerating and giving rise to a homeostasis-like mature ALI monolayer. Two-tailed Student’s t test: p < 0.05; ∗∗p < 0.01. Bars: (A, C, H, and J) 50 μm. Histological, immuno-fluorescent, and flow cytometry images are representative of at least 3 Transwell samples examined. See also Figure S3.
Figure S3
Figure S3
In Vitro Recreation of Hopx+ CARSCs and Its Regenerative Potential, Related to Figure 3 (A) Detailed flow cytometry gating strategies used to select live single cells for subsequent GFP analysis in WT, Lgr5GFP and HopxGFP ALId0 cells as shown in Figure 3B. SSC = Side scatter. FSC = Forward scatter. BluFL1 was used to check for autofluorescence of the BluFL3 (propidium iodide, PI) channel which is a live/dead indicator. (B) Whole mount in situ hybridization on Transwells to assay Lgr5 and Hopx mRNA levels in ALId0 monolayers (red). Black dots represent the pores of the Transwell membrane. (C) Expression of Lgr5 and Hopx mRNAs on ALId0 as defined by RNA-Seq. (D) Whole mount Ki67 (red) co-staining with Ly6a (green, left), Tacstd2 (green, middle) and Ly6g (green, right) on ALId21 monolayers. (E-F) Whole mount phospho-histone H3 staining on Transwells examined on ALId0, ALId1, ALId2 and ALId4. The mitotic rate for these time points was plotted in panel F. (G) Top KEGG pathways upregulated in ALId4 monolayers in comparison to ALId0. (H-I) Whole mount UEA1 staining of Transwells sampled on ALId0, ALId1, ALId2 and ALId4 to characterize the time course of goblet cell differentiation. The percent of UEA1+ cells is indicated in (I). n = 3 samples/group. (J) Whole mount co-staining of Chga and Slc26a3 with tdTomato following 21 days of lineage tracing experiment on ALI cultures derived from HopxCreER/RosaTd mice. (K) H&E staining of ALI culture sections after 10 days of Hopx+ cell ablation. Mean values ± SD are shown. Two-tailed Student’s t test: p < 0.05. Quantification data are represented as mean ± SD. Bars: (B, D, E, H, J and K) 25 μm. In situ hybridization and immuno-fluorescent images are representative of at least three samples examined.
Figure 4
Figure 4
Recapitulating Cycles of Colonic Epithelial Injury-Regeneration In Vitro (A) Scheme of mature ALI culture re-submersion and re-exposure to air. (B–M) ALI monolayers prior to re-submersion (ALId21; B–D), 24 h (Re-Sub 24h; E–G), and 7 days (Re-Sub 7d; H–J) after re-submersion, as well as 14 days after re-exposure to ALI (Re-ALId14; K–M) were examined by H&E staining (B, E, H, and K), immunostaining for UEA1 (C, F, I, and L) and Ki67 (D, G, J, and M). (N) Heatmap of regenerative epithelial markers at 0 h, 8 h, 24 h, and 7 days after re-submersion. Data are row normalized. n = 3 replicates/time point. (O and P) GSEA-based analysis comparing the mRNA profiles of re-submerge d7 cells to the regenerating epithelium of DSS-treated mice and fetal spheroid epithelium (Mustata et al., 2013, Yui et al., 2018). NES = 2.01 (O) and 2.65 (P). FDR < 0.001. See also Tables S5 and S6. (Q–S) Whole mount images of ALI cultures derived from HopxCreER/RosaTd mice. The presence of Hopx-expressing cells (red) at indicated time points (Q, ALId21; R, Re-sub d2; S, Re-ALI d2) was examined by transiently labeling monolayers with 4-OH tamoxifen 24 h before imaging. (T–V) Sections of mouse colons from HopxCreER/RosaTd mice treated with no DSS, DSS for 7 days (DSS d7), and DSS for 7 days with a 14-day recovery phase (DSS d7 + d14). Hopx+ cells (red) were transiently labeled with tamoxifen within homeostatic (T), atrophic (U), and hypertrophic crypts (V) (arrowheads in T–V, respectively). White dashed lines mark the crypt/stroma boundary. Bars: (K–M) 25 μm; (S and V) 50 μm. Histological and immuno-stained images are representative of at least 3 Transwell samples or animals examined. See also Figure S4.
Figure S4
Figure S4
Recapitulating Cycles of Colonic Epithelial Injury Regeneration In Vitro, Related to Figure 4 (A) Expression of regenerative epithelial markers was analyzed by qPCR on monolayers re-submerged for 0hr, 4hrs, 8hrs, 24hrs and 7 days. Results were demonstrated by the relative expression fold changes in comparison to the 0hr time point. Student’s t test was performed to compare each individual time points after re-submersion to the 0hr time point. n = 3 samples/group. (B) Heatmap panel showing goblet cell, enteroendocrine cell, and colonocyte marker expression in monolayers re-submerged for the indicated time periods. Expression data are row normalized. (n = 3 replicates/time point). (C) ALI monolayers derived from HopxCreER/RosaTd mice were transiently labeled with 4OH-Tamoxifen 1 day before re-submersion on ALId21. Labeled Hopx+ cells were traced after re-submersion for 1 day and 7 days. (D) ALI monolayers subjected to 2 cycles of re-submersion and re-ALI stained with H&E staining, and for the indicated biomarkers of major cell lineages (Chga for enteroendocrine and UEA1 for goblet cell), and proliferating cells (Ki67). Mean values ± SD are shown. Two-tailed Student's t test: p < 0.05; ∗∗p < 0.01. Bars: (C and D) 25 μm. Histological and immuno-fluorescent images are representative of at least three samples examined.
Figure 5
Figure 5
Re-submersion Induces Cellular Stresses Mediated by Low Oxygen Tension (A) Top upregulated pathways in monolayers 8 h after re-submersion as compared to ALId21. (B) A schematic summary of the cellular pathways activated by low oxygen tension. (C) Hif1α protein accumulation evaluated by immunoblot of cell lysates derived from monolayers re-submerged for 0, 2, 4, 8, and 24 h. (D) Hif1α targets expression defined by qPCR assays in monolayers re-submerged for 0, 2, 4, 8, 24 h and 7 days. Results were expressed relative to the 0 h time point. Mean ± SD are shown. n = 3 samples/time point. (E) Intracellular lactate levels in monolayers as a function of time after re-submersion. n = 3 samples/group. (F) Changes in levels of proteins known to be involved in the UPR pathway defined by immunoblotting of cell lysates as a function of time after re-submersion. (G) Expression of UPR target genes, defined by qPCR, in monolayers at different times after re-submersion. Results were expressed relative to the 0 h time point. Mean ± SD were plotted. n = 3 samples/group. Two-tailed Student’s t test relative to 0 h: p < 0.05; ∗∗p < 0.01. Immunoblots are representative of two independent experiments.
Figure 6
Figure 6
Oxygen Tension Functions as an Important Switch between Injury and Regeneration (A) Scheme of mature ALI cultures exposed to 2% O2 for up to 48 h while still maintaining ALI. (B–P) Staining for H&E (B, E, H, K, N), UEA1 (goblet cells; C, F, I, L, O), and Ki67 (D, G, J, M, P) on monolayers after exposed to 2% O2 for 0 (B–D), 4 (E–G), 8 (H–J), 24 (K–M), and 48 h (N–P). (Q and R) qPCR assays showing relative expression of UPR target genes (Q) and genes involved in epithelial regenerative responses (R) in monolayers exposed to 2% O2 for the indicated time periods. Results were expressed relative to the 0 h time point. Mean ± SD are shown. n = 3 samples/group. (S–U) Immunohistochemical staining of Hif1α protein on colonic mucosa sections from mice treated with no DSS, 7 days of DSS, and 7 days of DSS plus a 14-day recovery phase. Arrowheads denote the nuclear expression of Hif1α in epithelial cells of homeostatic (S), atrophic (T), and hypertrophic crypts (U). Two-tailed Student’s t test: p < 0.05; ∗∗p < 0.01. Bars: (N–P) 25 μm; (U) 50 μm; (inset of U) 10 μm. Histological and immune-staining images are representative of 3 Transwell samples or animals examined. See also Figure S5.
Figure S5
Figure S5
Oxygen Tension Functions as an Important Switch between Injury and Regeneration, Related to Figure 6 (A) Hopx expression was assayed following indicated time points after exposure to 2% O2 or re-exposure to 21% O2 by transient 4-OH tamoxifen labeling (24hrs prior) in ALI monolayers derived from HopxCreER/RosaTd mice. (B-C) H&E stained sections of ALId21 monolayers treated with indicated concentrations of HIF activators including VH298, DMOG and DFO for 48hrs (B). Immunoblots for the Hif1α protein in cell lysates following 8hrs of the indicated HIF activator treatment (C). (D) H&E, Ki67 and UEA1 stained sections from ALId21 monolayers treated with ER stress inducers including BFA and TM for 48hrs. (E) Scheme for assessing the effect of low oxygen tension on the regenerative capacity of ALId0 cells. After 7 days of initial submersion, monolayer cells were subject to ALI in either 2% O2 or 21% O2 condition for 21 days. (F) ALId21 monolayers treated with either 2% O2 or 21% O2 were examined for cell morphology (left panels), Cd44/Ki67 double staining (mid panels) and UEA1 staining (right panels). Bars: (A, B, D and F) 25 μm. Histological and immuno-fluorescent images are representative of at least three samples examined.

Comment in

References

    1. Bader M., Muse W., Ballou D.P., Gassner C., Bardwell J.C. Oxidative protein folding is driven by the electron transport system. Cell. 1999;98:217–227. - PubMed
    1. Baert F., Moortgat L., Van Assche G., Caenepeel P., Vergauwe P., De Vos M., Stokkers P., Hommes D., Rutgeerts P., Vermeire S., D’Haens G., Belgian Inflammatory Bowel Disease Research Group. North-Holland Gut Club Mucosal healing predicts sustained clinical remission in patients with early-stage Crohn’s disease. Gastroenterology. 2010;138:463–468. - PubMed
    1. Bankaitis E.D., Ha A., Kuo C.J., Magness S.T. Reserve Stem Cells in Intestinal Homeostasis and Injury. Gastroenterology. 2018;155:1348–1361. - PMC - PubMed
    1. Barker N., van Es J.H., Kuipers J., Kujala P., van den Born M., Cozijnsen M., Haegebarth A., Korving J., Begthel H., Peters P.J., Clevers H. Identification of stem cells in small intestine and colon by marker gene Lgr5. Nature. 2007;449:1003–1007. - PubMed
    1. Barrett J.C., Hansoul S., Nicolae D.L., Cho J.H., Duerr R.H., Rioux J.D., Brant S.R., Silverberg M.S., Taylor K.D., Barmada M.M., NIDDK IBD Genetics Consortium. Belgian-French IBD Consortium. Wellcome Trust Case Control Consortium Genome-wide association defines more than 30 distinct susceptibility loci for Crohn’s disease. Nat. Genet. 2008;40:955–962. - PMC - PubMed

Publication types