. 2019 Dec;7(12):e1695-e1705.
doi: 10.1016/S2214-109X(19)30405-X.

Estimating malaria burden among pregnant women using data from antenatal care centres in Tanzania: a population-based study

Affiliations

Estimating malaria burden among pregnant women using data from antenatal care centres in Tanzania: a population-based study

Chonge Kitojo et al. Lancet Glob Health. 2019 Dec.

Abstract

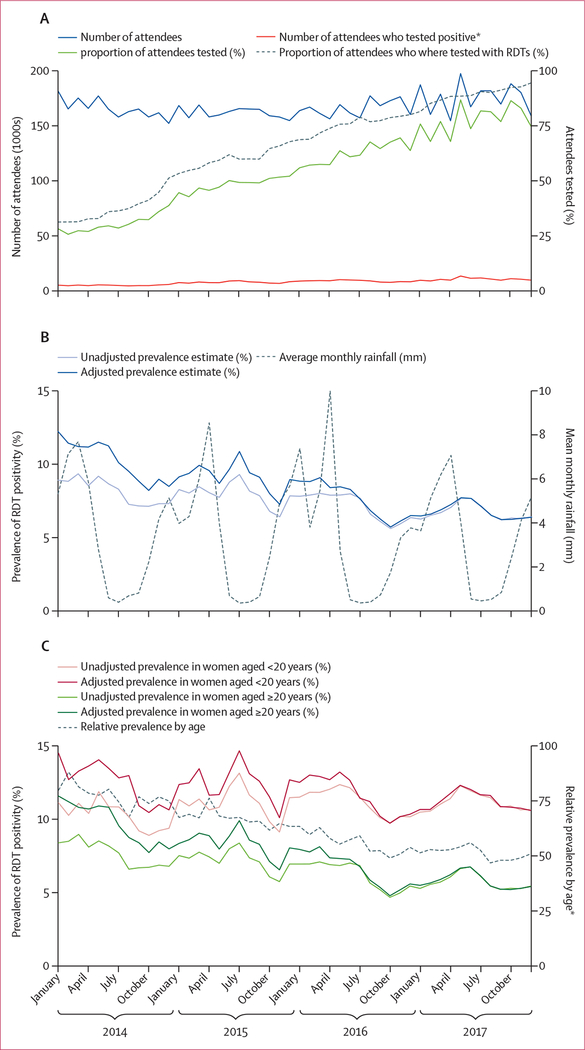
Background: More timely estimates of malaria prevalence are needed to inform optimal control strategies and measure progress. Since 2014, Tanzania has implemented nationwide malaria screening for all pregnant women within the antenatal care system. We aimed to compare malaria test results during antenatal care to two population-based prevalence surveys in Tanzanian children aged 6-59 months to examine their potential in measuring malaria trends and progress towards elimination.

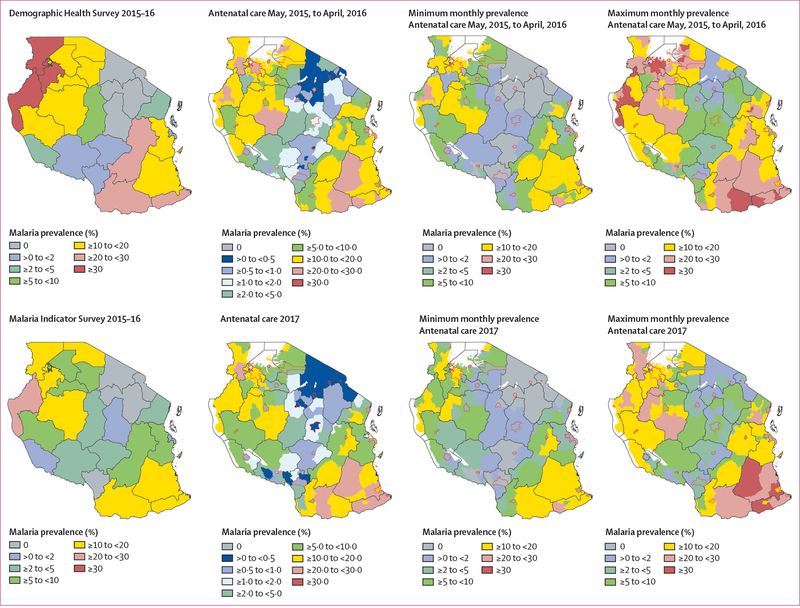
Methods: Malaria test results from pregnant women screened at their first antenatal care visits at health-care facilities (private and public) in all 184 districts of Tanzania between Jan 1, 2014, and Dec 31, 2017, were collected from the Health Management Information Systems and District Health Information System 2. We excluded facilities with no recorded antenatal care attendees during the time period. We standardised results to account for testing uptake and weighted them by the timing of two population-based surveys of childhood malaria prevalence done in 2015-16 (Demographic and Health Survey) and 2017 (Malaria Indicator Survey). We assessed regional-level correlation using Spearman's coefficient and assessed the consistency of monthly district-level prevalence ranking using Kendall's correlation coefficient.

Findings: Correlation between malaria prevalence at antenatal care and among children younger than 5 years was high (r≥0·83 for both surveys), although declines in prevalence at antenatal care were generally smaller than among children. Consistent heterogeneity (p<0·05) in antenatal care prevalence at the district level was evident in all but one region (Kilimanjaro). Data from antenatal care showed declining prevalence in three regions (Arusha, Kilimanjaro, and Manyara) where surveys estimated zero prevalence.

Interpretation: Routine antenatal care-based screening can be used to assess heterogeneity in transmission at finer resolution than population-based surveys, and provides sample sizes powered to detect changes, notably in areas of low transmission where surveys lack power. Declines in prevalence at antenatal care might lag behind those among children, highlighting the value of monitoring burden and continuing prevention efforts among pregnant women as transmission declines. The pregnancy-specific benefits and cost-effectiveness of antenatal care-based screening remain to be assessed.

Funding: None.


Conflict of interest statement

Declaration of interests

CK, DSI, EK, JRG and PW, RM, FC, SM, AM, and EJR declare no competing interests

Figures

Figure 1:
Figure 1:. Nationwide expansion of testing and prevalence of malaria at first antenatal care in Tanzania
(A) Number of women attending antenatal care, number tested, and number testing positive each month, reported within the Health Management Information Systems. (B) Prevalence of malaria test positivity within women attending antenatal care. Prevalence was adjusted for patterns in uptake of testing at the district level. Prevalence measured by the 2015–16 Demographic Health Survey (14·4%) and 2017 Malaria Indicator Survey (7·3%) are indicated for comparison. Mean monthly rainfall was weighted by the number of women attending antenatal care at the regional level. (C) Prevalence of malaria test positivity in women attending antenatal care, stratified by age. RDT=rapid diagnostic test. *Relative prevalence in women aged ≥20 years as a percentage of that in women aged <20 years.
Figure 2:
Figure 2:. Temporal trends in malaria prevalence at antenatal care by district in selected regions in Tanzania, 2015–17
Coloured lines show mean district-level prevalence and are coloured according to mean prevalence (from dark red representing highest prevalence to dark blue representing lowest). Grey dots and bars show prevalence and 95% CI among children aged <5 years old in the Demographic and Health Survey and Malaria Indicator Survey, with 2015–16 surveys plotted at the month during which the median sample was collected within the region and the Malaria Indicator Survey plotted at November, 2017, the midpoint of the survey. Equivalent figures for all regions grouped by zone are included in the appendix (p 6). *Adjusted for district-level uptake in testing.
Figure 3:
Figure 3:. Correlation between population-based surveys and prevalence at antenatal care in Tanzania
Lines represent the lines of best fit according to linear least-square regression. Error bars are 95% CIs. (A) Correlation between survey and prevalence at antenatal care among all women (r=0·83, p<0·001). Survey data from 2015–16 (r=0·86, p<0·001) and 2017 (r=0·88, p<0·001) are shown, with correlation by RDT in other surveys from van Eijk and colleagues. (B) Correlation between survey and prevalence at antenatal care among women aged <20 years (r=0·77, p<0·001), stratified by 2015–16 (r=0·82, p<0·001) and 2017 (r=0·87, p<0·001) surveys, with data from surveys in PG from van Eijk and colleagues. (C) Correlation between survey and prevalence at antenatal care among women aged ≥20 years (r=0·86, p<0·001), stratified by 2015–16 (r=0·88, p<0·001) and 2017 (r=0·89, p<0·001) surveys, with data from surveys in MG from van Eijk and colleagues. (D) and (E) show data from (A) stratified according to whether population-based survey prevalence data are below 10% (D; overall r=0·83, p<0·001) or above 10% (E; overall r=0·37, p=0·09). (D) Data are stratified by 2015–16 (r=0·71, p=0·02) and 2017 (r=0·89, p<0·001) surveys. (E) Data are stratified by 2015–16 (r=0·51, p=0·06) and 2017 (r=0·31, p=0·45) surveys. (F) Comparison in women aged <20 years restricted to regions with survey prevalence >10% (r=0·14, p=0·53), stratified by 2015–16 (r=0·34, p=0·23) and 2017 (r=0·24, p=0·58) surveys. RDT=rapid diagnostic test. Mx=microscopy. PG=primigravidae. MG=multigravidae.
Figure 4:
Figure 4:. Malaria prevalence by region and method of estimation in Tanzania, 2015–17
Minimum and maximum monthly prevalence refer to the minimum and maximum of the 12 prevalence points recorded on a monthly basis during the indicated year. Increased sample sizes led to increased granularity (ie, more key bands) of some datasets. Region boundaries are shown in black, provincial capitals are shown with red lines; for district-level maps, white areas indicate bodies of water.
Figure 5:
Figure 5:. Trends in prevalence at antenatal care in regions with zero prevalence
Data are from the Demographic and Health Survey (2015–16) and Malaria Indicator Survey (2017). Error bars are 95% CIs. *Best-fitting monthly linear trend according to logistic regression accounting for random effects at the district level and by month of the year.

Comment in

References

    1. WHO. Global technical strategy for malaria 2016–2030. Geneva: World Health Organization, 2015.
    1. WHO. World malaria report. Geneva: World Health Organization, 2018.
    1. WHO. Disease surveillance for malaria control: an operational manual. Geneva: World Health Organisation, 2012.
    1. Bhatt S, Weiss DJ, Cameron E, et al. The effect of malaria control on Plasmodium falciparum in Africa between 2000 and 2015. Nature 2015; 526: 207–11. - PMC - PubMed
    1. Dellicour S, Tatem AJ, Guerra CA, Snow RW, ter Kuile FO. Quantifying the number of pregnancies at risk of malaria in 2007: a demographic study. PLoS Med 2010; 7: e1000221. - PMC - PubMed

Publication types