

Affordability of the EAT-Lancet reference diet: a global analysis
- PMID: 31708415
- PMCID: PMC7024996
- DOI: 10.1016/S2214-109X(19)30447-4
Affordability of the EAT-Lancet reference diet: a global analysis
Erratum in
-
Correction to Lancet Glob Health 2020; 8: e59-66.Lancet Glob Health. 2020 Dec;8(12):e1472. doi: 10.1016/S2214-109X(20)30472-1. Lancet Glob Health. 2020. PMID: 33220213 Free PMC article. No abstract available.
Abstract
Background: The EAT-Lancet Commission drew on all available nutritional and environmental evidence to construct the first global benchmark diet capable of sustaining health and protecting the planet, but it did not assess dietary affordability. We used food price and household income data to estimate affordability of EAT-Lancet benchmark diets, as a first step to guiding interventions to improve diets around the world.
Methods: We obtained retail prices from 2011 for 744 foods in 159 countries, collected under the International Comparison Program. We used these data to identify the most affordable foods to meet EAT-Lancet targets. We compared total diet cost per day to each country's mean per capita household income, calculated the proportion of people for whom the most affordable EAT-Lancet diet exceeds total income, and also measured affordability relative to a least-cost diet that meets essential nutrient requirements.
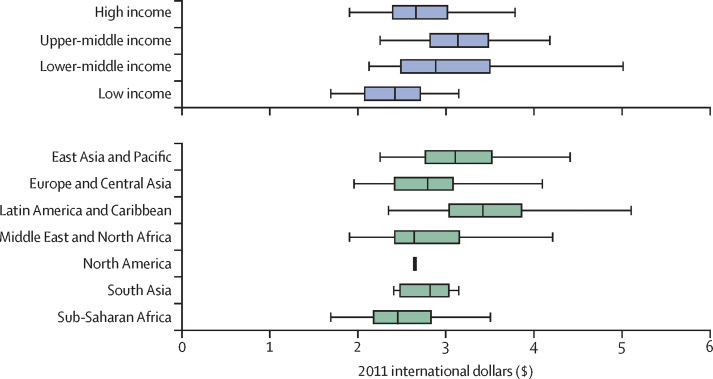
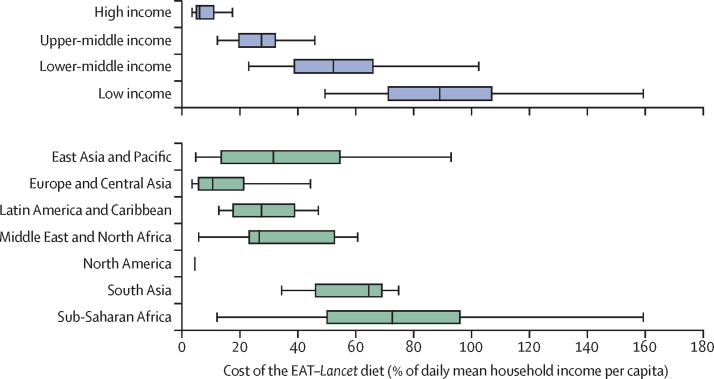
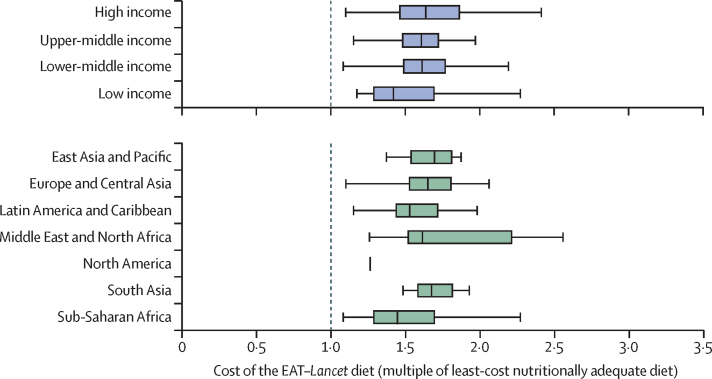
Findings: The most affordable EAT-Lancet diets cost a global median of US$2·84 per day (IQR 2·41-3·16) in 2011, of which the largest share was the cost of fruits and vegetables (31·2%), followed by legumes and nuts (18·7%), meat, eggs, and fish (15·2%), and dairy (13·2%). This diet costs a small fraction of average incomes in high-income countries but is not affordable for the world's poor. We estimated that the cost of an EAT-Lancet diet exceeded household per capita income for at least 1·58 billion people. The EAT-Lancet diet is also more expensive than the minimum cost of nutrient adequacy, on average, by a mean factor of 1·60 (IQR 1·41-1·78).
Interpretation: Current diets differ greatly from EAT-Lancet targets. Improving diets is affordable in many countries but for many people would require some combination of higher income, nutritional assistance, and lower prices. Data and analysis for the cost of healthier foods are needed to inform both local interventions and systemic changes.
Funding: Bill & Melinda Gates Foundation.
Copyright © 2020 The Author(s). Published by Elsevier Ltd. This is an Open Access article under the CC BY 4.0 license. Published by Elsevier Ltd.. All rights reserved.
Figures
Comment in
-
Analysing the affordability of the EAT-Lancet diet.Lancet Glob Health. 2020 Jan;8(1):e6-e7. doi: 10.1016/S2214-109X(19)30502-9. Lancet Glob Health. 2020. PMID: 31839142 No abstract available.
References
-
- WHO . World Health Organization; Geneva: 2017. Double-duty actions for nutrition: policy brief.
-
- Ramakrishnan U. Prevalence of micronutrient malnutrition worldwide. Nutr Rev. 2002;60(suppl 5):S46–S52. - PubMed
-
- Forouzanfar MH, Alexander L, Anderson HR. Global, regional, and national comparative risk assessment of 79 behavioural, environmental and occupational, and metabolic risks or clusters of risks in 188 countries, 1990–2013: a systematic analysis for the Global Burden of Disease Study 2013. Lancet. 2015;386:2287–2323. - PMC - PubMed
-
- Intergovernmental Panel on Climate Change . Intergovernmental Panel on Climate Change; Geneva: 2019. Climate Change and Land: an IPCC Special Report on climate change, desertification, land degradation, sustainable land management, food security, and greenhouse gas fluxes in terrestrial ecosystems.
-
- Willett W, Rockström J, Loken B. Food in the Anthropocene: the EAT–Lancet Commission on healthy diets from sustainable food systems. Lancet. 2019;393:447–492. - PubMed
Publication types
MeSH terms
LinkOut - more resources
Full Text Sources
