. 2019 Nov 19;29(8):2338-2354.e7.
doi: 10.1016/j.celrep.2019.10.013. Epub 2019 Nov 7.

Identification and Analyses of Extra-Cranial and Cranial Rhabdoid Tumor Molecular Subgroups Reveal Tumors with Cytotoxic T Cell Infiltration

Affiliations

Identification and Analyses of Extra-Cranial and Cranial Rhabdoid Tumor Molecular Subgroups Reveal Tumors with Cytotoxic T Cell Infiltration

Hye-Jung E Chun et al. Cell Rep. .

Abstract

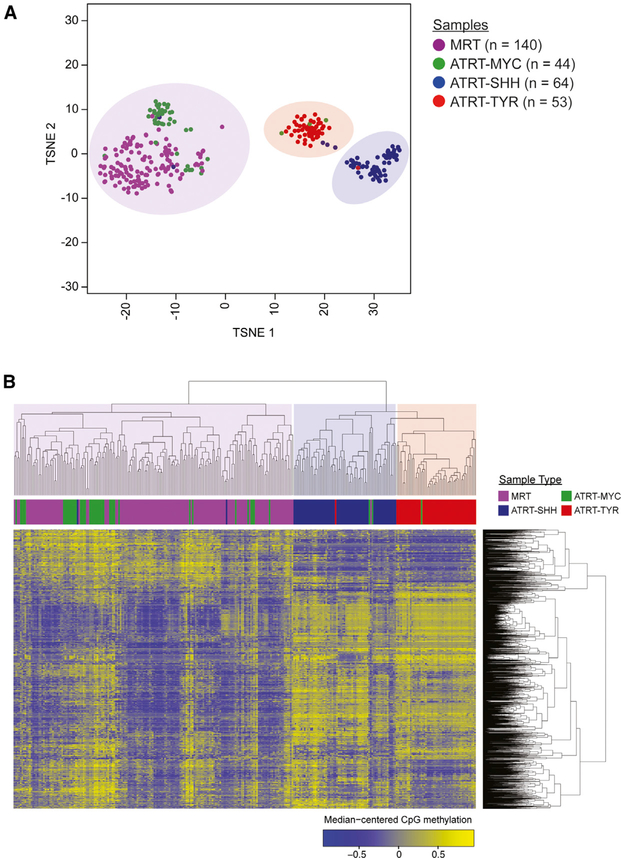
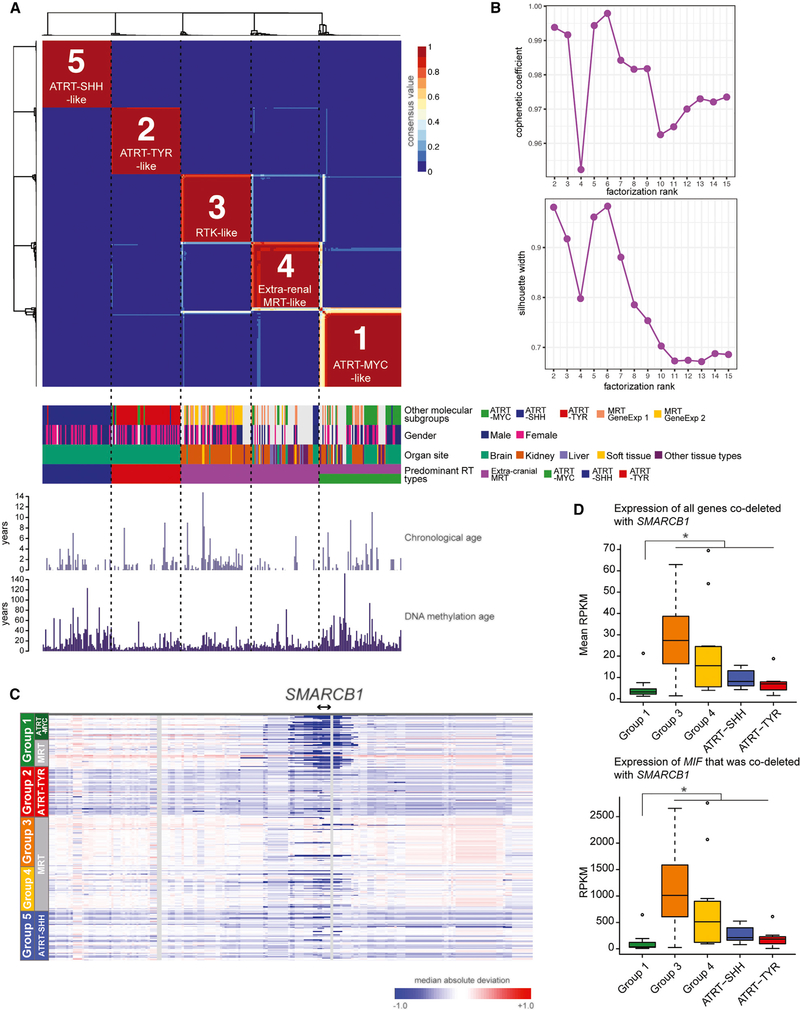
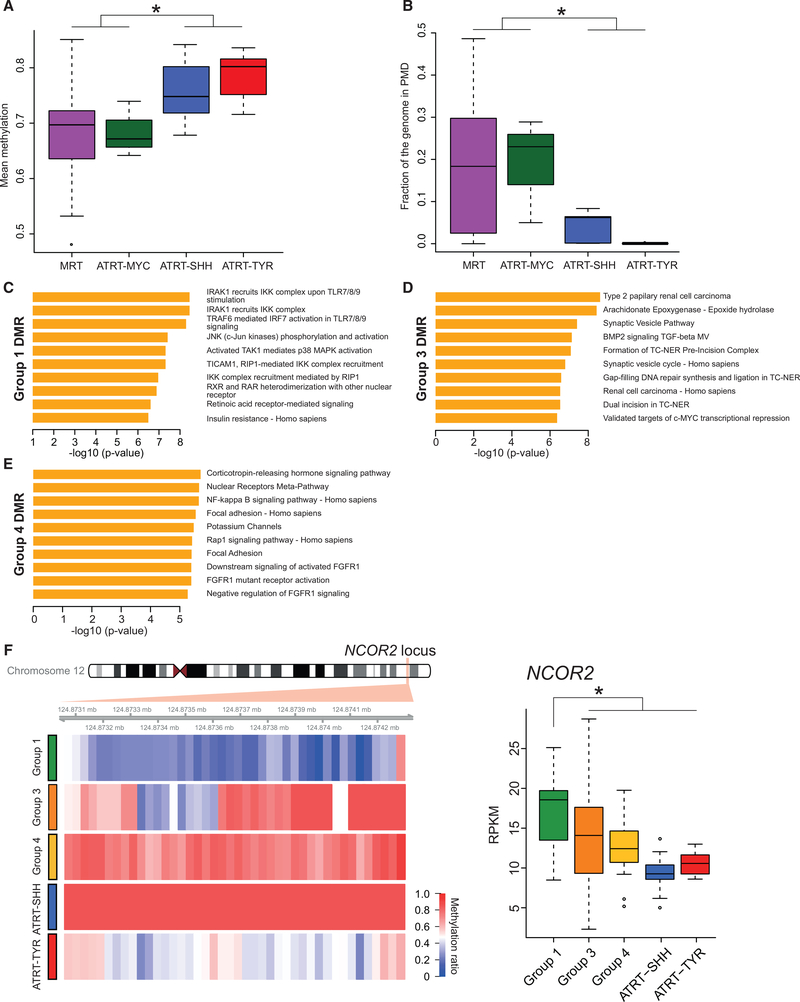
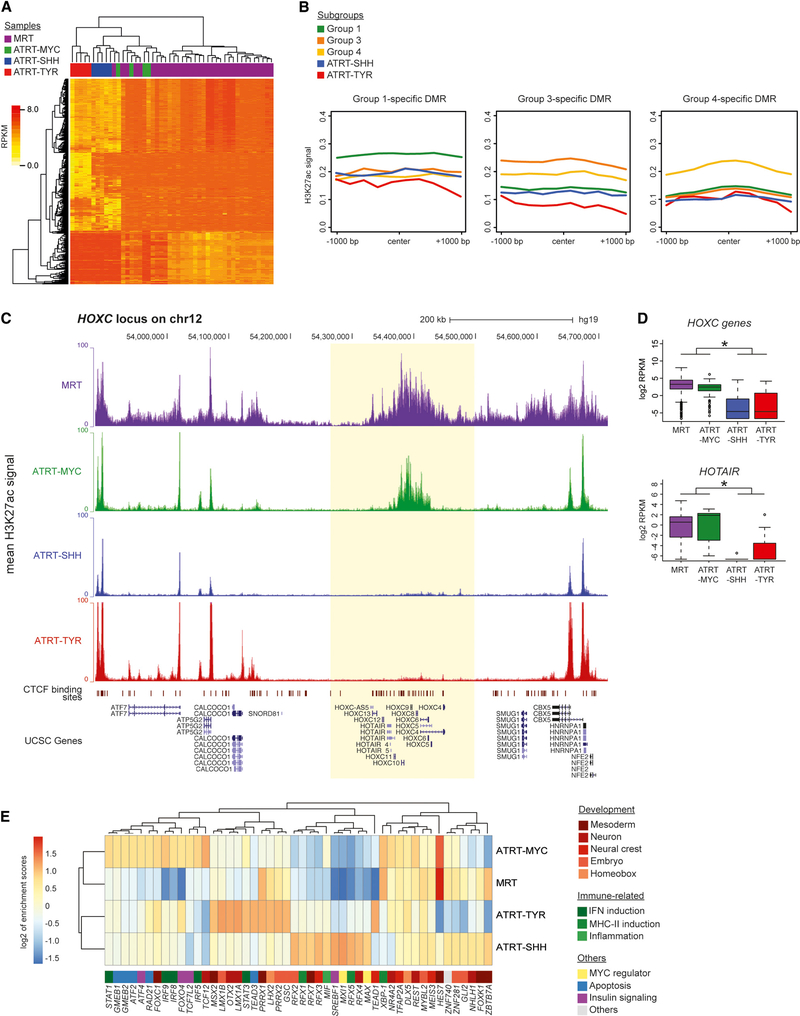
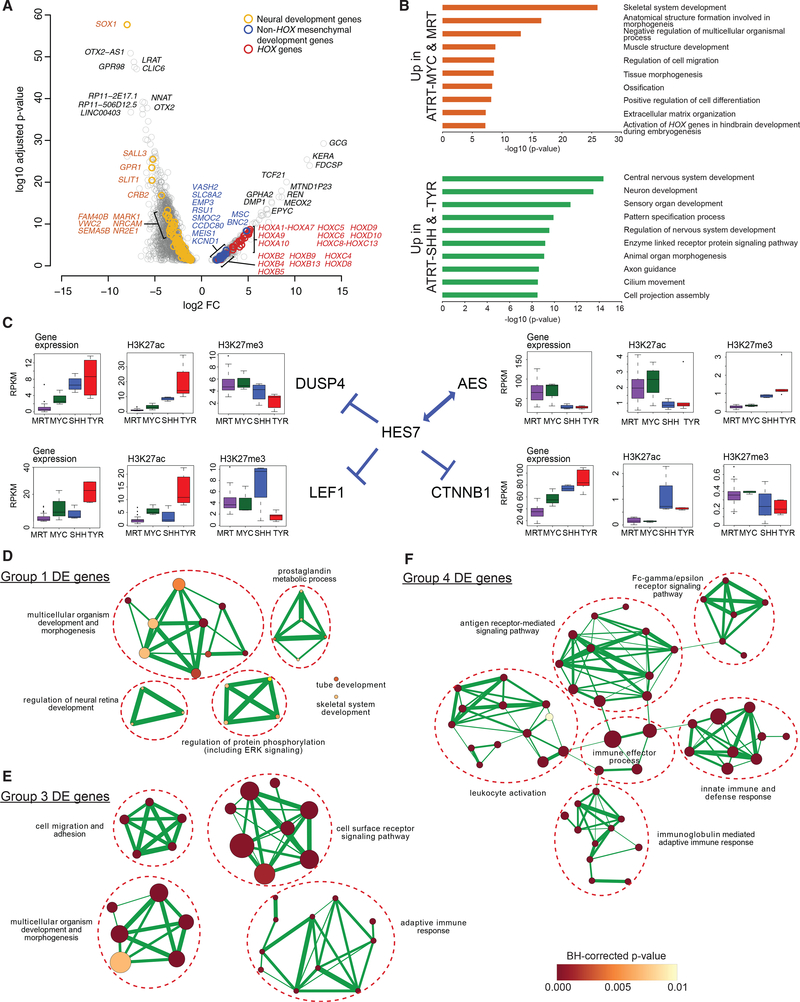
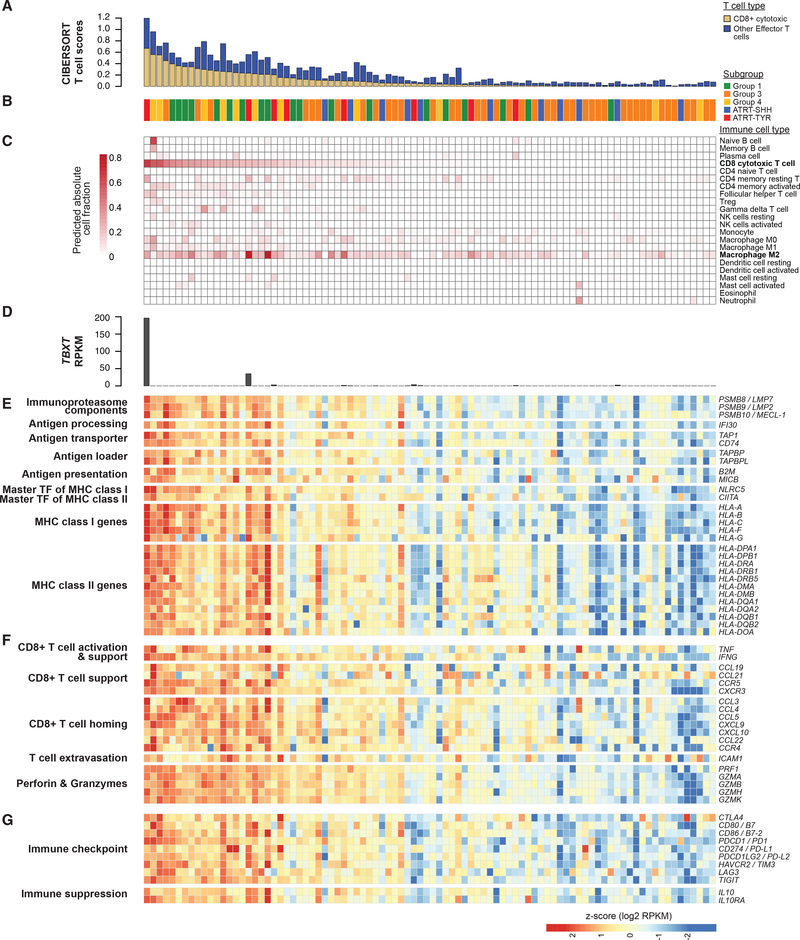
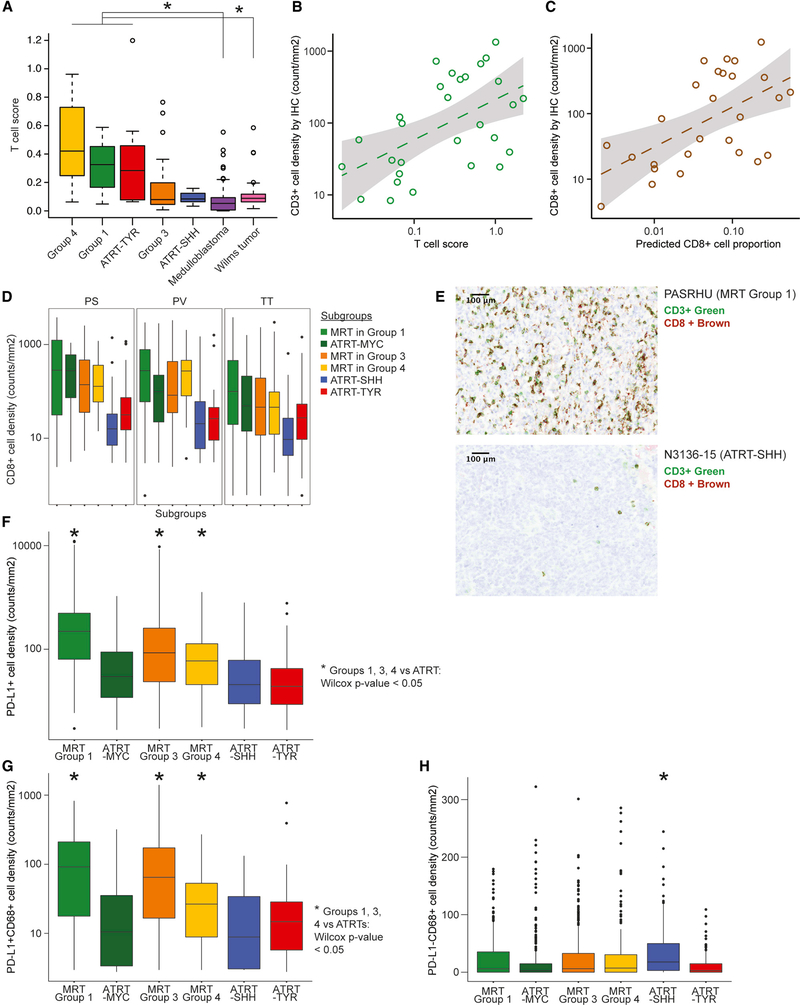
Extra-cranial malignant rhabdoid tumors (MRTs) and cranial atypical teratoid RTs (ATRTs) are heterogeneous pediatric cancers driven primarily by SMARCB1 loss. To understand the genome-wide molecular relationships between MRTs and ATRTs, we analyze multi-omics data from 140 MRTs and 161 ATRTs. We detect similarities between the MYC subgroup of ATRTs (ATRT-MYC) and extra-cranial MRTs, including global DNA hypomethylation and overexpression of HOX genes and genes involved in mesenchymal development, distinguishing them from other ATRT subgroups that express neural-like features. We identify five DNA methylation subgroups associated with anatomical sites and SMARCB1 mutation patterns. Groups 1, 3, and 4 exhibit cytotoxic T cell infiltration and expression of immune checkpoint regulators, consistent with a potential role for immunotherapy in rhabdoid tumor patients.

Keywords: HOX dysregulation; Malignant rhabdoid tumor; SMARCB1; atypical teratoid rhabdoid tumor; cytotoxic T cell infiltration; genomic and epigenomic dysregulation; molecular subgroups; pediatric cancer; tumor-infiltrating immune cells.


Conflict of interest statement

DECLARATION OF INTERESTS

The authors declare no competing interests.

Figures

Figure 1.
Figure 1.. Unsupervised Clustering of DNA Methylation Profiles from 140 MRTs (92 Renal, 48 Extra-Renal) and 161 ATRTs Indicate Similarity between ATRT-MYC and MRT
(A) t-SNE analysis was performed using the top 2,000 most variably methylated CpG sites and to reveal three clusters that consisted primarily of ATRT-MYC (n = 44 cases) and MRT (n = 140 cases), ATRT-SHH (n = 64 cases), or ATRT-TYR (n = 53 cases). (B) Unsupervised hierarchical clustering was performed using the top 1% most variably methylated CpG sites (n = 3,958) and yielded a clustering result consistent with (A). See also Figure S1 and Table S1.
Figure 2.
Figure 2.. Five DNA Methylation Subgroups of RTs from Cranial and Extra-Cranial Sites Correlate with Previously Known ATRT and MRT Subgroups, Anatomical Sites, and SMARCB1 Deletion Patterns
(A) Unsupervised NMF analysis was performed using the top 10,000 most variably methylated CpG sites and revealed five subgroups (top). Clinical features, gene expression subgroups of MRTs, and previously characterized ATRT subgroups are shown in colored tracks (middle). Chronological age and predicted DNA methylation age (Horvath, 2013) are shown in bar plots (bottom). ATRT-SHH and Group 1 exhibited increased DNA methylation age compared to the other subgroups (Wilcoxon p values = 1.62e-05 and 6.30e-10 for ATRT-SHH and Group 1, respectively). Neither chronological age nor gender were significantly associated with the subgroups (Kruskal-Wallis p value = 0.25 and Fisher’s exact p values = 0.16 – 0.86, respectively). (B) Cophenetic coefficients (top) and silhouette widths (bottom) for NMF cluster solutions from k = 2 to k = 15. The highest cophenetic coefficients and silhouette widths were from the NMF solutions with 5 and 6 clusters. (C) Heatmap indicates chromosomal copy gain (indicated by red) or loss (blue), estimated using DNA methylation data, centered at the SMARCB1 locus across the five DNA methylation subgroups (n = 301 cases). (D) Boxplot shows the mean expression levels of 74 genes (top) co-deleted with SMARCB1 across the five subgroups (n = 19 cases for Group 1, n = 41 for Group 3, n = 11 for Group 4, n = 11 for ATRT-SHH, n = 8 for ATRT-TYR) and expression levels of MIF (bottom). The asterisk indicates a significant difference (Wilcoxon p value < 0.05) between Group 1 and other RT subgroups. See also Figures S2 and S3 and Table S2.
Figure 3.
Figure 3.. ATRT-MYC and MRT Exhibit Similar DNA Methylation Profiles Distinct from ATRT-SHH and -TYR
(A) Boxplot shows the distribution of mean genome-wide DNA methylation levels based on WGBS data. MRT (n = 69 cases) and ATRT-MYC (n = 3 cases) showed significant hypomethylation compared to ATRT-SHH (n = 7 cases) and -TYR (n = 7 cases; *Wilcoxon p value < 0.05). (B) Boxplot displays the distribution of fractions of the genome covered by PMDs in MRT and ATRT-MYC, which exhibited significantly more abundant PMDs compared to ATRT-SHH and -TYR (*Wilcoxon p value < 0.05). (C–E) Gene set enrichment of DMRs that are specific for Groups 1 (C), 3 (D), and 4 (E). The x axes indicate the statistical significance of the enrichment test. (F) Heatmap (left) shows average CpG methylation levels at the NCOR2 locus in Group-1-specific DMRs (red = 100%; blue = 0% methylation). Boxplot (right) shows significantly increased NCOR2 expression levels in Group 1 compared to other RT subgroups (*Wilcoxon p value < 0.05). See also Figure S4 and Table S3.
Figure 4.
Figure 4.. ATRT-MYC and MRT Exhibit Distinct Enhancer Profiles
(A) Unsupervised clustering of H3K27ac ChIP-seq read densities resulted in a cluster of ATRT-MYC cases (n = 4) and MRT cases (n = 34) indicated by green and purple bars, respectively. (B) Line plots show the average H3K27ac signal densities of the five RT subgroups at Group-1- (including ATRT-MYC; n = 460 DMRs), Group-3- (n = 426 DMRs), and Group-4-specific DMRs (n = 280), respectively. Subgroup-specific DMRs showed the highest H3K27ac signal density levels in the respective subgroups. (C) Mean H3K27ac density at the HOXC locus, which was specific to MRT (n = 34 cases) and ATRT-MYC (n = 4 cases) and absent in ATRT-SHH (n = 5 cases) and -TYR (n = 5 cases). (D) Boxplots show HOXC (top) and HOTAIR (bottom) gene expression levels, which were significantly higher in MRT cases (n = 65) and ATRT-MYC (n = 6 cases) compared to ATRT-SHH (n = 11 cases) and -TYR cases (n = 8; * adjusted p values < 0.05). (E) Unsupervised hierarchical clustering using enrichment scores of TFBS at enhancers specific to MRT (n = 312 enhancers), ATRT-MYC (n = 443 enhancers), -SHH (n = 511 enhancers), and -TYR (n = 1,385 enhancers). Heatmap colors represent the log2 enrichment scores of TFs in the enhancers. Colors next to gene names indicate known biological processes associated with TFs. See also Table S4.
Figure 5.
Figure 5.. Dysregulation of Mesenchymal Development Genes Is Associated with ATRT-MYC and MRT, whereas Dysregulation of Neural Genes Is Associated with ATRT-SHH and -TYR
(A) Volcano plot shows the statistical significance of differential expression (DE; adjusted p values < 0.05) on the y axis, and the fold change (FC) of gene expression in ATRT-MYC (n = 6 cases) and MRT (n = 65 cases) compared to ATRT-SHH (n = 11 cases) and -TYR (n = 8 cases) on the x axis. The top 20 significant DE genes, HOX genes, and genes involved in neural or mesenchymal development are labeled in colors as shown. (B) Bar plots show the most significantly enriched pathways and adjusted enrichment p values based on analyses of 584 relatively overexpressed genes (top) and 2,500 relatively under-expressed genes (bottom) in MRTs and ATRT-MYC compared to ATRT-SHH and -TYR. (C) Gene expression levels and H3K27ac and H3K27me3 densities (i.e., average read coverage) at the promoters of HES7 and its interactors are shown in boxplots. (D-F) Enrichment map networks of Gene Ontology (GO) terms significantly enriched for Group-1- (D), Group-3- (E), and Group-4-specific (F) DE genes. A node size is proportional to the number of genes in the category and a node color indicates an adjusted enrichment p value. The edge thickness is proportional to a fraction of shared genes between GO terms. See also Figure S5 and Table S5.
Figure 6.
Figure 6.. Gene Expression Analysis Indicates Increased T Cell Presence in RT Subgroups
(A) Stacked bar plot shows CD8+ cytotoxic T cell proportions (yellow) and T cell scores (blue), which are based on the sum of absolute proportions of effector T cells (i.e., all T cell types except regulatory T cells [TVeg]). The samples (n = 90) are ordered based on CD8+ cytotoxic T cell proportions(and in all subsequent sub-figures in Figure 6). A subgroup of each sample is indicated in (B). (C) Heatmap shows absolute proportions of 22 immune cell types predicted using CIBERSORT. (D) Bar plot shows expression levels of the TBXT gene, which encodes T-brachyury. (E-G) Heatmaps indicate expression levels of genes involved in antigen presentation and processing (E), T cell activation and homing (F), and immunosuppressive signaling (G). All genes were significantly overexpressed in cases with CD8+ T cell proportions greater than the median (adjusted p values < 0.05, except for CTLA4 [adjusted p value = 0.10]). See also Figure S6.
Figure 7.
Figure 7.. Comparison of T Cell Presence in RTs to Other Cancer Types and Validation of Increased T Cell Infiltration using IHC
(A) Boxplot shows T cell scores across the five RT subgroups (19 cases from Group 1, 41 from Group 3, 11 from Group 4, 11 from ATRT-SHH, and 8 from ATRT-TYR), pediatric medulloblastomas (n = 105 cases), and Wilms tumors (n = 130; *Wilcoxon p values < 0.05). IHC profiling was performed on 2,979 regions selected from 185 tumor tissue slides from 35 extra-cranial MRT cases (9 from Group 1, 20 from Group 3, and 6 from Group 4) and 27 ATRT cases (10 from ATRT-MYC, 10 from ATRT-SHH, and 7 from ATRT-TYR). CD68+ myeloid cells were profiled from 915 tumor-enriched (TT), 304 peri-vascular (PV), and 297 peri-stromal (PS) regions. CD3+ lymphoid cells were profiled from 888 TT, 287 PV, and 288 PS regions. (B and C) Scatter plots show comparisons between T cell scores and median CD3+ leukocyte densities determined for each sample using IHC (B), as well as between CD8+ T cell proportions and median CD3+CD8+ cytotoxic T cell densities determined for each sample using IHC (C; x and y axes in log10 scale). Dashed lines indicate positive linear correlations (Pearson rho = 0.540 and 0.569, linear regression p values = 0.0025 and 0.0019 for CD3+ and CD3+CD8+ cells, respectively). (D) Boxplots show distributions of CD8+ cytotoxic T cell densities in tumor-enriched (TT), peri-stromal (PS), and peri-vascular (PV) regions (y axis, log10 scale). MRT cases in Groups 1, 3, and 4 and ATRT-MYC cases showed significantly higher CD8+ T cell densities compared to ATRT-SHH and -TYR in all regional types (Wilcoxon p values = 2.2e-16, 6.94e-15, and 3.84e-12, respectively). (E) Examples of cases with high (top) and low (bottom) T cell infiltration revealed by multiplex IHC staining (CD3+ green; CD8+ brown). Images are at 30x magnification. Scale bars: 100 μm. (F and G) Boxplots show distributions of overall PD-L1 + cell (F; y axis, log10 scale) and PD-L1-positive CD68+ immune cell densities (G; y axis, log10 scale). The asterisk indicates statistical significance p value < 0.05. (H) Boxplot shows distributions of PD-L1-negative CD68+ immune cell densities, which are significantly higher in ATRT-SHH compared to other subgroups (*Dunn’s adjusted p value < 0.05). See also Figure S7 and Table S6.

References

    1. Aibar S, González-Blas CB, Moerman T, Huynh-Thu VA, Imrichova H, Hulselmans G, Rambow F, Marine J-C, Geurts P, Aerts J, et al. (2017). SCENIC: single-cell regulatory network inference and clustering. Nat. Methods 14, 1083–1086. - PMC - PubMed
    1. Anders S, and Huber W (2010). Differential expression analysis for sequence count data. Genome Biol. 11, R106. - PMC - PubMed
    1. Aryee MJ, Jaffe AE, Corrada-Bravo H, Ladd-Acosta C, Feinberg AP, Hansen KD, and Irizarry RA (2014). Minfi: a flexible and comprehensive Bioconductor package for the analysis of Infinium DNA methylation microarrays. Bioinformatics 30, 1363–1369. - PMC - PubMed
    1. Barnes TA, and Amir E (2017). HYPE or HOPE: the prognostic value of infiltrating immune cells in cancer. Br. J. Cancer 117, 451–460. - PMC - PubMed
    1. Bessho Y, Miyoshi G, Sakata R, and Kageyama R (2001). Hes7: a bHLH-type repressor gene regulated by Notch and expressed in the presomitic mesoderm. Genes Cells 6, 175–185. - PubMed

Publication types

MeSH terms