. 2020 Jan 7;31(1):115-130.e6.
doi: 10.1016/j.cmet.2019.10.005. Epub 2019 Nov 7.

Microbial Metabolite Signaling Is Required for Systemic Iron Homeostasis

Affiliations

Microbial Metabolite Signaling Is Required for Systemic Iron Homeostasis

Nupur K Das et al. Cell Metab. .

Abstract

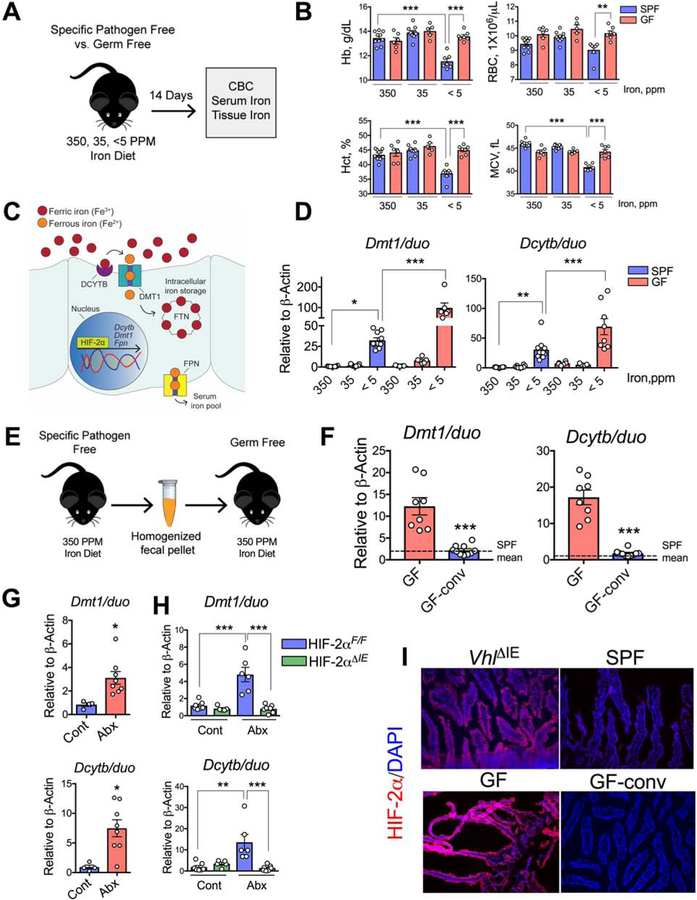
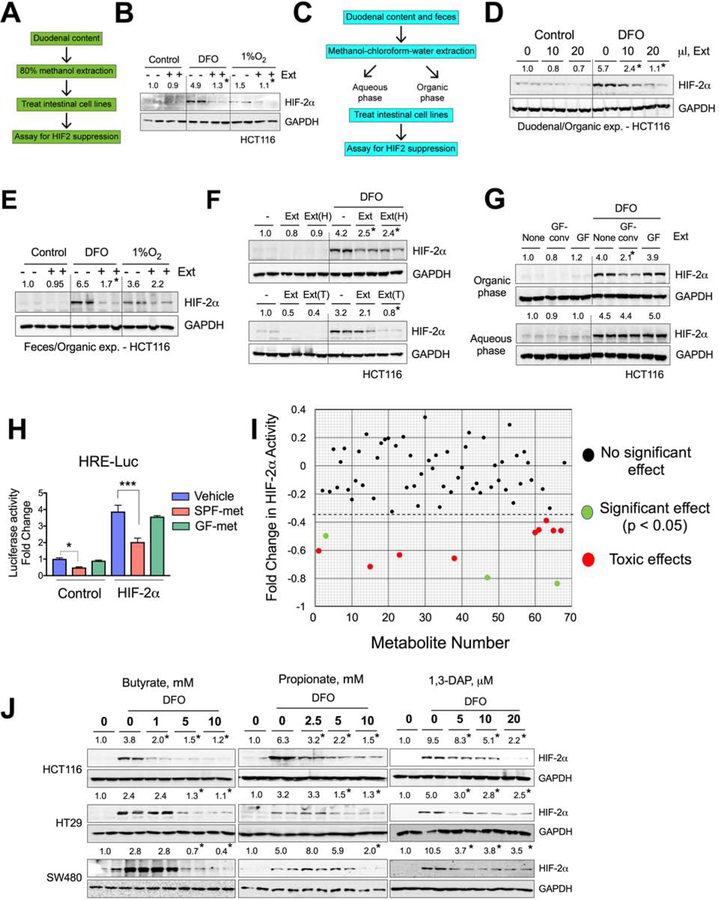
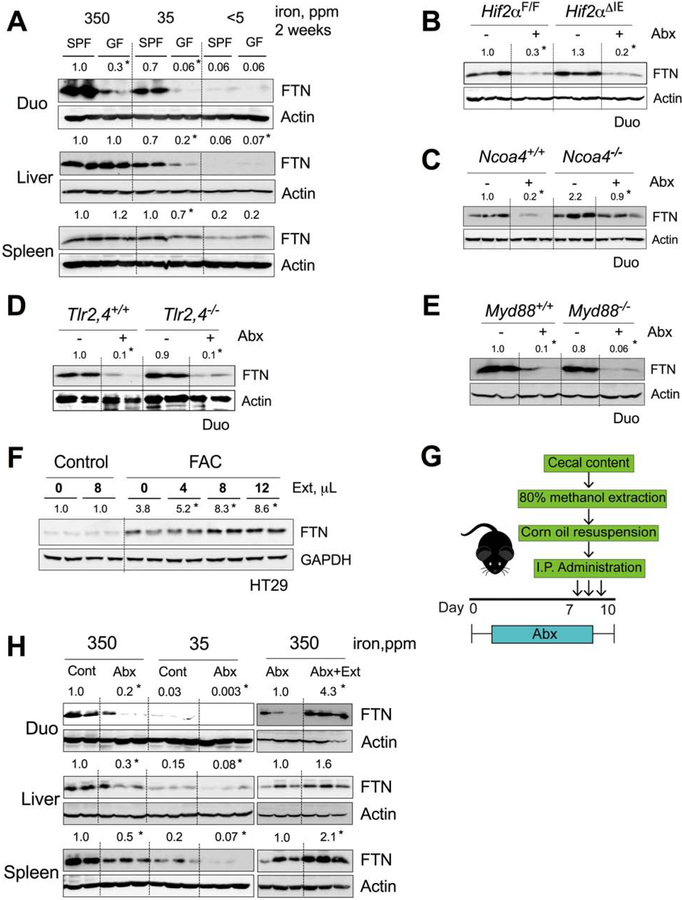
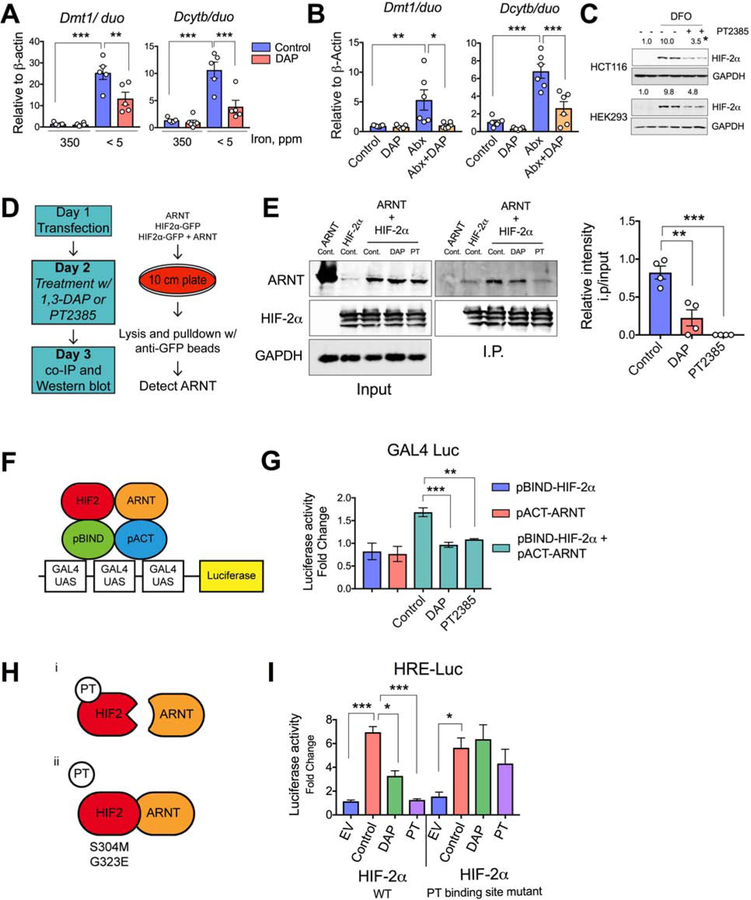
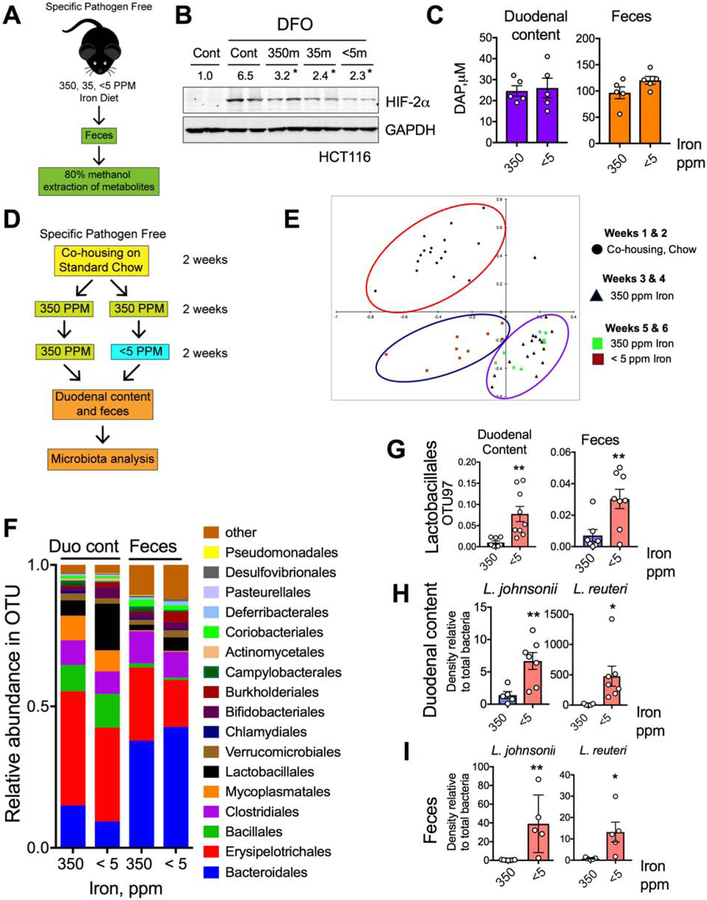
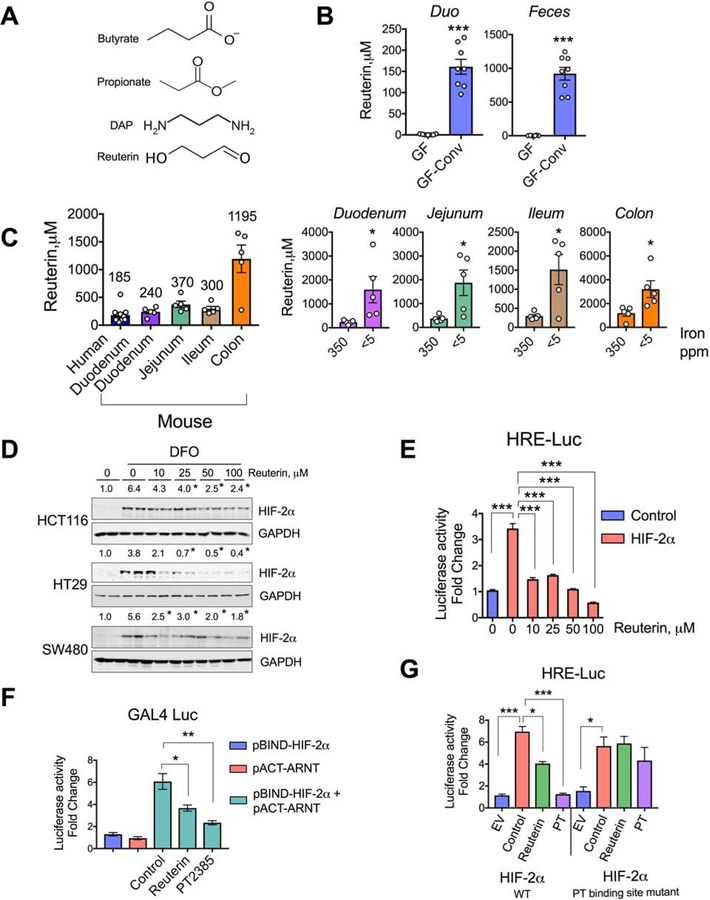
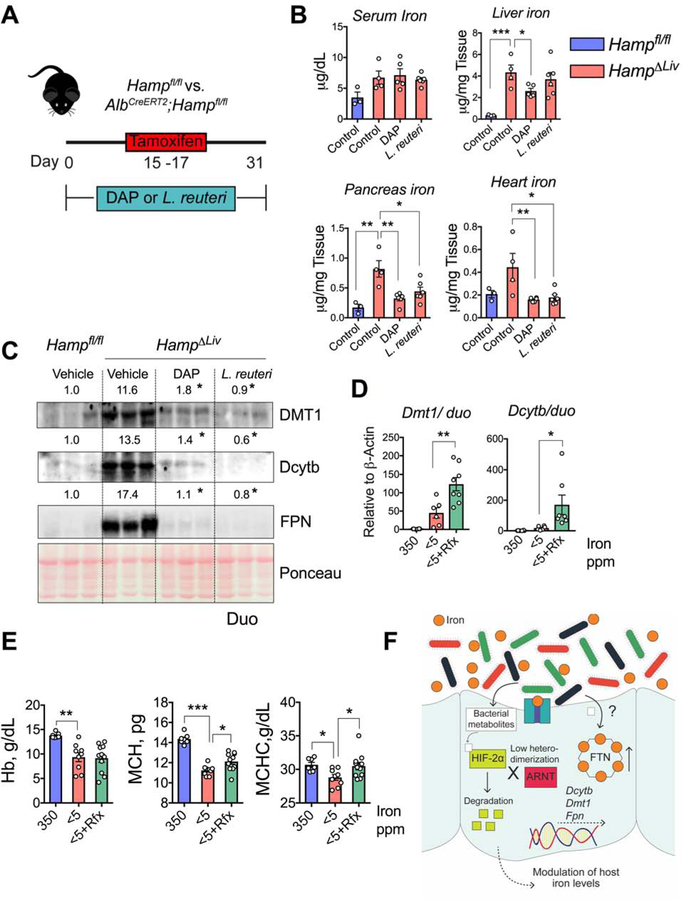
Iron is a central micronutrient needed by all living organisms. Competition for iron in the intestinal tract is essential for the maintenance of indigenous microbial populations and for host health. How symbiotic relationships between hosts and native microbes persist during times of iron limitation is unclear. Here, we demonstrate that indigenous bacteria possess an iron-dependent mechanism that inhibits host iron transport and storage. Using a high-throughput screen of microbial metabolites, we found that gut microbiota produce metabolites that suppress hypoxia-inducible factor 2α (HIF-2α) a master transcription factor of intestinal iron absorption and increase the iron-storage protein ferritin, resulting in decreased intestinal iron absorption by the host. We identified 1,3-diaminopropane (DAP) and reuterin as inhibitors of HIF-2α via inhibition of heterodimerization. DAP and reuterin effectively ameliorated systemic iron overload. This work provides evidence of intestine-microbiota metabolic crosstalk that is essential for systemic iron homeostasis.

Keywords: EPAS1; HIF; HIF-2a; anemia; ferritin; hemochromatosis; hypoxia; hypoxia-inducible factor; iron; metabolites; microbiota.


Conflict of interest statement

Declaration of Interests

The authors declare no competing interests.

Figures

Figure 1.
Figure 1.. Gut microbiota suppress iron absorptive genes and HIF-2α expression.
A) Schematic of iron-diet treatment (350-, 35- and <5-ppm iron) in specific pathogen free (SPF) and germ free (GF) C57BL/6J mice, B) complete blood count (CBC). C) A general schematic of host intestinal iron regulation. D) Duodenal Dmt1 and Dcytb gene expression in SPF and GF mice on 350-, 35- and <5 ppm iron diets. E) Schematic of conventionalization of GF gut (GF-conv) by SPF fecal suspension, and F) Duodenal Dmt1 and Dcytb gene expression analysis of GF and GF-conv mice. Dotted lines indicate the corresponding mean gene expression values from SPF mice. G) SPF mice fed with standard chow diet (270-ppm iron) were depleted of microbiota by broad-spectrum antibiotic cocktail in the drinking water (Abx) and duodenal Dmt1 and Dcytb gene expression analysis. H) Wild type (Hif2αF/F) and intestine-specific HIF-2α knockout (Hif2αΔIE) mice were treated with Abx, and duodenal Dmt1 and Dcytb gene expression analyses shown. I) Immunohistochemical analysis of HIF-2α in SPF, GF and GF-conv duodenum. Intestine-specific VHL knockout (VhlΔIE) used as positive control. All data are mean ± SEM. One-way ANOVA with Tukey’s multiple comparisons test (B, D and H) or t-test (F and G). * P < 0.05, ** P < 0.01, *** P < 0.001.
Figure 2.
Figure 2.. Microbial metabolites decrease HIF-2α expression and activity.
A) Schematic of duodenal metabolite extraction from wild type SPF mice and HIF-2α expression assay in intestinal cell lines, and B) HIF-2α Western analysis of DFO or 1% O2 pretreated (4 hours) HCT116 cells followed by treatment with duodenal extracts (Ext) for 16 hours. C) Schematic of aqueous and organic extraction of duodenal and fecal metabolites from wild type SPF mice and HIF-2α expression assay in intestinal cell lines. HIF-2α Western analysis (D and E) in DFO- or 1% O2 treated HCT116 cells or co-treated with organic extracts (Ext) for 16 hours. (F) HIF-2α Western analysis in DFO-treated HCT116 cells co-treated with Ext, heated (95°C) Ext [Ext(H)] (upper panel) or trypsin-digested Ext [Ext(T)] (lower panel) from fecal organic extracts. G) HIF-2α Western analysis in DFO-treated HCT116 cells or co-treated with organic (upper panel) and aqueous (lower panel) extracts from GF and GF-conv feces. H) HIF response element (HRE) luciferase assay (HRE-Luc) in HCT116 cells transfected with empty vector (control) or HIF-2α, followed by treatment with vehicle (DMSO) or fecal organic extracts from SPF- (SPF-met) and GF (GF-met) mice (n=3). I) Metabolite screen for HIF-2α suppression based on HRE luciferase assay in HCT116 cells. J) HIF-2α Western analysis in DFO-treated or co-treated with butyrate, propionate and 1,3 diaminopropane (DAP) in HCT116, HT29 and SW480 cells. All data are mean ± SEM. One-way ANOVA with Tukey’s multiple comparisons test (H and I). Western analyses (B, D, E, F, G and J): Images were analyzed by Image J software from three independent experiments, representative image shown. Statistical significance compared with DFO-only or 1% O2–only (B and E) treatment group. * P < 0.05, *** P < 0.001.
Figure 3.
Figure 3.. Microbial metabolites sustain intestinal and peripheral tissue ferritin (FTN) expression.
FTN Western analyses in A) duodenum, liver and spleen of SPF vs. GF mice fed with 350-, 35- or <5-ppm iron diet; and duodenum of control or Abx treated, B) wild type (Hif2αF/F) and intestine-specific HIF-2α knockout (Hif2αΔIE) mice, C) wild type (Ncoa4+/+) and NCOA4 knockout (Ncoa4−/−) mice, D) wild type (Tlr2,4+/+) and TLR2,4 double knockout (Tlr2,4−/−) mice, and E) wild type (Myd88+/+) and Myd88 knockout (Myd88−/−) mice. F) FTN Western analysis of ferric ammonium citrate (FAC, 10μM) pretreated HT29 cells followed by dose-dependent treatment of fecal metabolites from wild type SPF mice. G) Schematic showing Abx treatment of wild type C57BL/6J mice followed by intraperitoneal (i.p.) injection of fecal metabolites (Ext). H) FTN Western blot analyses of duodenum liver and spleen of control or Abx treated mice fed with 350- and 35 ppm iron diet (left panel), and Abx or Abx plus Ext treated mice fed with 350 ppm iron diet (right panel). All data are mean ± SEM. Western analyses (A-F and H): Images were analyzed by Image J software from three independent experiments, representative image shown. Statistical significance compared within the respective groups (A-E and H) and FAC-only control (F). * P < 0.05
Figure 4.
Figure 4.. DAP suppresses HIF-2α activity in vivo via blocking heterodimerization.
Duodenal Dmt1 and Dcytb gene expression in C57BL/6 wild type SPF mice A) fed with 350- or < 5 ppm iron diet and treated with 1,3 diaminopropane (DAP) in drinking water (2g/L) for 2 weeks, or B) treated with antibiotic cocktail (Abx) and/or DAP in drinking water for 2 weeks. C) HIF-2α Western analysis of DFO-treated HCT116 and HEK293 cells followed by PT2385 treatment. D) Schematic of co-immunoprecipitation protocol for determination of the roles of DAP or PT2385 in HIF-2α-ARNT interaction. E) Co-immunoprecipitation for ARNT and HIF-2α in HEK-293T cells treated with DAP (50μM) or PT2385 (10μM); Relative densitometric analysis of four independent experiment shown on the right panel. F) Schematic and G) experimental representation of DAP- or PT-mediated HIF-2α-ARNT interaction by pG5GAL4 luciferase assay followed by pBIND-HIF-2α and/or pACT-ARNT transfection of HEK293 cells (n=3). H) Schematic showing effect of PT2385 or PT2399 (PT) on HIF-2α-ARNT interaction and the effect on the same following the mutation of PT2385 or PT2399 binding sites on HIF-2α. I) HEK293 cells were transfected with wild type or PT-binding site mutant HIF-2α followed by DAP or PT treatment, and HRE luciferase assay performed (n=3). All data are mean ± SEM. One way ANOVA with Tukey’s multiple comparisons test (A, B, E right panel, G and I). Western analyses (C): Images were analyzed by Image J software from three independent experiments, representative image shown. Statistical significance compared with DFO-only treatment group. * P < 0.05, ** P < 0.01, *** P < 0.001.
Figure 5.
Figure 5.. Low-iron diet potentiates HIF-2α inhibition by microbial metabolites.
A) Schematic of fecal metabolite extraction from SPF mice fed with 350-, 35- and < 5-ppm iron diet for 2 weeks and B) HIF-2α Western analysis in HCT116 cells treated with or without DFO and metabolites (350m, 35m or <5m respectively). C) DAP concentration in duodenum and feces from wild type fed with 350- and <5-ppm iron diet for two weeks. D) Schematic of the experimental set up for bacterial community analysis. E) Principal component analysis (PCA) of fecal bacterial population from 16S rRNA sequencing data in mice fed with 350-ppm and < 5-ppm iron diet. F) 16S rRNA sequencing bacterial community analysis from duodenal content and feces. G) Comparative analysis of genus Lactobacillales by OTU97 (97% sequence similarity) values in duodenal content and feces. Comparative analysis of L. johnsonii and L. reuteri density by species specific PCR from H) duodenal content and I) feces. All data are mean ± SEM. t-test for the corresponding panels (C, G, H, I). Western analyses (B): Images were analyzed by Image J software from three independent experiments, representative image shown. Statistical significance compared with DFO-only treatment group. * P < 0.05, ** P < 0.01.
Figure 6.
Figure 6.. Reuterin suppresses HIF-2α activity via blocking heterodimerization.
A) Chemical structures of butyrate, propionate, DAP and reuterin. B) Intestinal reuterin concentrations in GF and GF-conv mice. C) Mean physiological concentration of reuterin in the human duodenum and mouse intestine (left panel) and intestinal reuterin concentration in mice fed with 350-ppm or < 5-ppm iron diet (right panel). D) HIF-2α Western analysis in DFO treated HCT116, HT29 and SW480 cells or co-treated with reuterin. E) HRE luciferase assay in HCT116 cells transfected with empty vector (control) or HIF-2α, followed by dose-dependent treatment of reuterin (n=3). F) Modified two-hybrid assays in HEK293 cells transfected with pBIND-HIF-2α and pACT-ARNT and treated with reuterin or PT2385 (PT) (n=3). G) HRE-luciferase assay in HEK293 cells transfected with wild type or PT-binding site mutant of HIF-2α and treated with reuterin or PT2385 (PT) (n=3). All data are mean ± SEM. t-test (B and C) or one-way ANOVA with Tukey’s multiple comparisons test (E, F and G). Western analyses (D): Images were analyzed by Image J software from three independent experiments, representative image shown. Statistical significance compared with DFO-only treatment group. * P < 0.05, ** P < 0.01, *** P < 0.001.
Figure 7.
Figure 7.. DAP and reuterin prevent systemic iron accumulation and antibiotics improve anemia in mouse models.
A) Schematic showing timeline of DAP or L. reuteri probiotic treatment in tamoxifen-mediated temporal disruption of hepcidin (HampΔLiv). B) Serum and tissue (liver, pancreas and heart) iron analyses and C) Duodenal DMT1, Dcytb and FPN Western analyses in DAP- or L. reuteri probiotic treated Hampfl/fl and HampΔLiv mice. Wild type SPF mice were fed with 350- or <5-ppm iron diet for 1 week followed by 350-ppm, <5-ppm or rifaximin (Rfx) (20 mg/kg/day)-blended <5-ppm diet for another 2 weeks; (D) duodenal Dmt1 and Dcytb gene expression and (E) CBC (Hb, MCH and MCHC) analysis. F) Schematic showing integration of HIF-2α inhibitory and FTN stimulatory roles of gut microbial metabolites to regulate host systemic iron homeostasis. HIF-2α inhibitory metabolites disrupt HIF-2α-ARNT interaction followed by its degradation and subsequent transcriptional downregulation of the intestinal transporters, a different subset of metabolites upregulates FTN expression. Both of these responses can lead to decreased iron absorption. All data are mean ± SEM. One-way ANOVA with Tukey’s multiple comparisons test (B, D and E). Western analyses (C): Images were analyzed by Image J software from three independent experiments, representative image shown. Statistical significance compared with Vehicle-only treatment group. * P < 0.05, ** P < 0.01, *** P < 0.001.

Comment in

References

    1. Adams PC, and Barton JC (2007). Haemochromatosis. Lancet 370, 1855–1860. - PubMed
    1. Albenberg L, Esipova TV, Judge CP, Bittinger K, Chen J, Laughlin A, Grunberg S, Baldassano RN, Lewis JD, Li H, et al. (2014). Correlation between intraluminal oxygen gradient and radial partitioning of intestinal microbiota. Gastroenterology 147, 1055–1063 e1058. - PMC - PubMed
    1. Anderson ER, Taylor M, Xue X, Ramakrishnan SK, Martin A, Xie L, Bredell BX, Gardenghi S, Rivella S, and Shah YM (2013). Intestinal HIF2αlpha promotes tissue-iron accumulation in disorders of iron overload with anemia. Proc Natl Acad Sci U S A 110, E4922–4930. - PMC - PubMed
    1. Benita Y, Kikuchi H, Smith AD, Zhang MQ, Chung DC, and Xavier RJ (2009). An integrative genomics approach identifies Hypoxia Inducible Factor-1 (HIF-1)-target genes that form the core response to hypoxia. Nucleic Acids Res 37, 4587–4602. - PMC - PubMed
    1. Bennett BD, Yuan J, Kimball EH, and Rabinowitz JD (2008). Absolute quantitation of intracellular metabolite concentrations by an isotope ratio-based approach. Nat Protoc 3, 1299–1311. - PMC - PubMed

Publication types

MeSH terms