. 2019 Dec 10;13(6):1083-1098.
doi: 10.1016/j.stemcr.2019.10.009. Epub 2019 Nov 7.

Wnt Inhibition Facilitates RNA-Mediated Reprogramming of Human Somatic Cells to Naive Pluripotency

Affiliations

Wnt Inhibition Facilitates RNA-Mediated Reprogramming of Human Somatic Cells to Naive Pluripotency

Nicholas Bredenkamp et al. Stem Cell Reports. .

Abstract

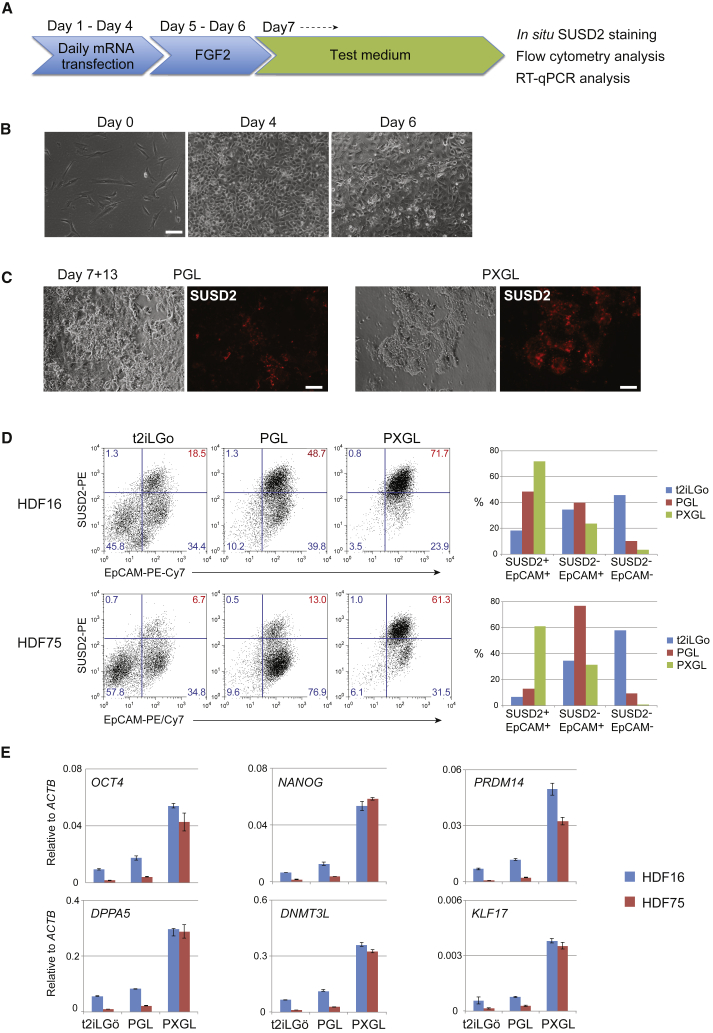
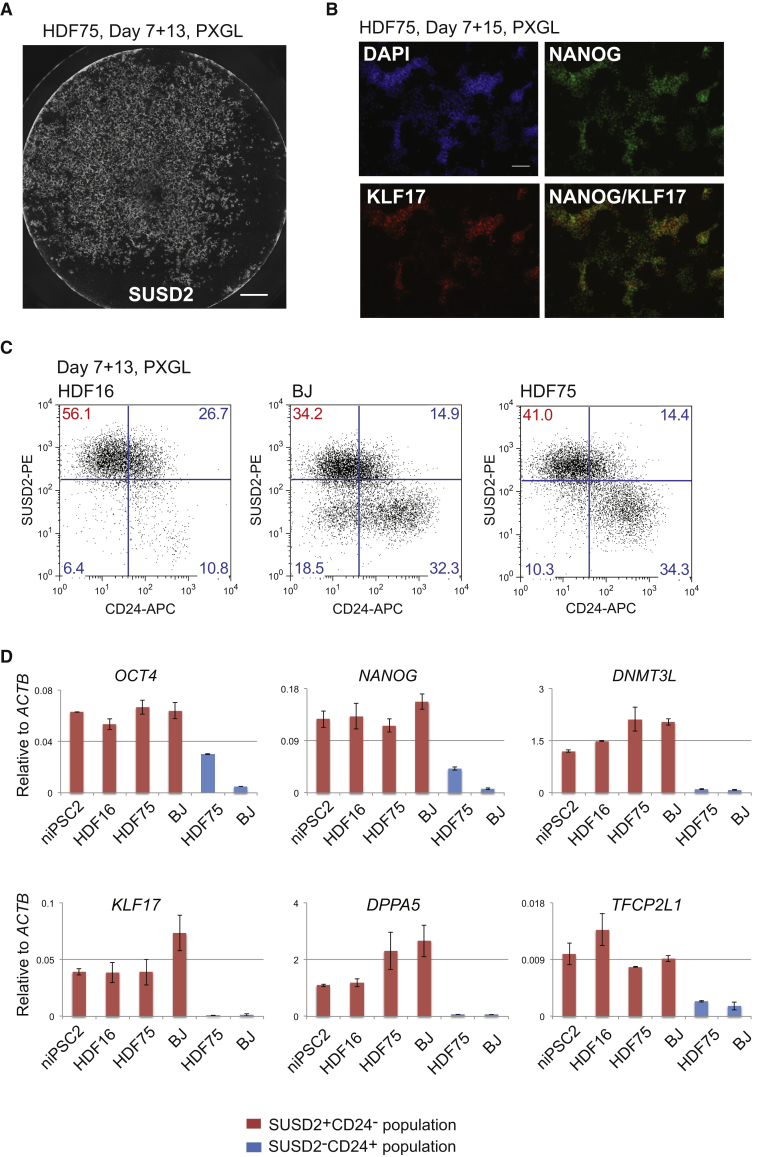
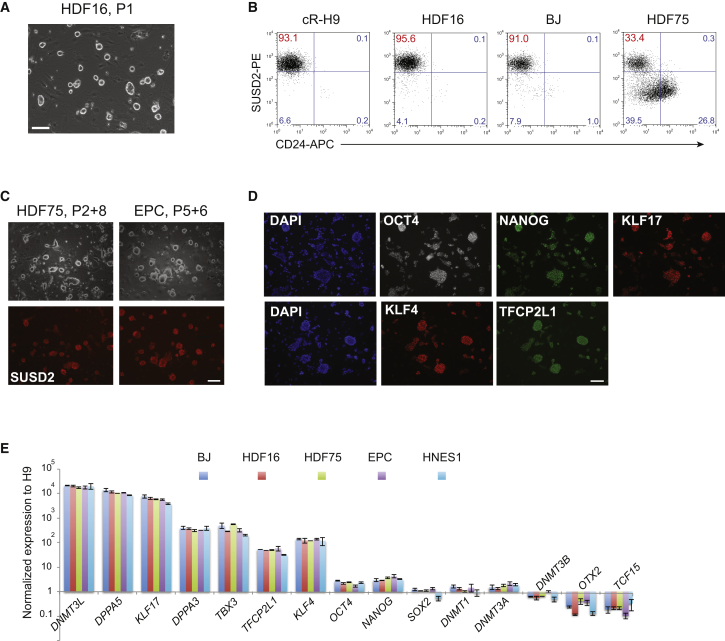
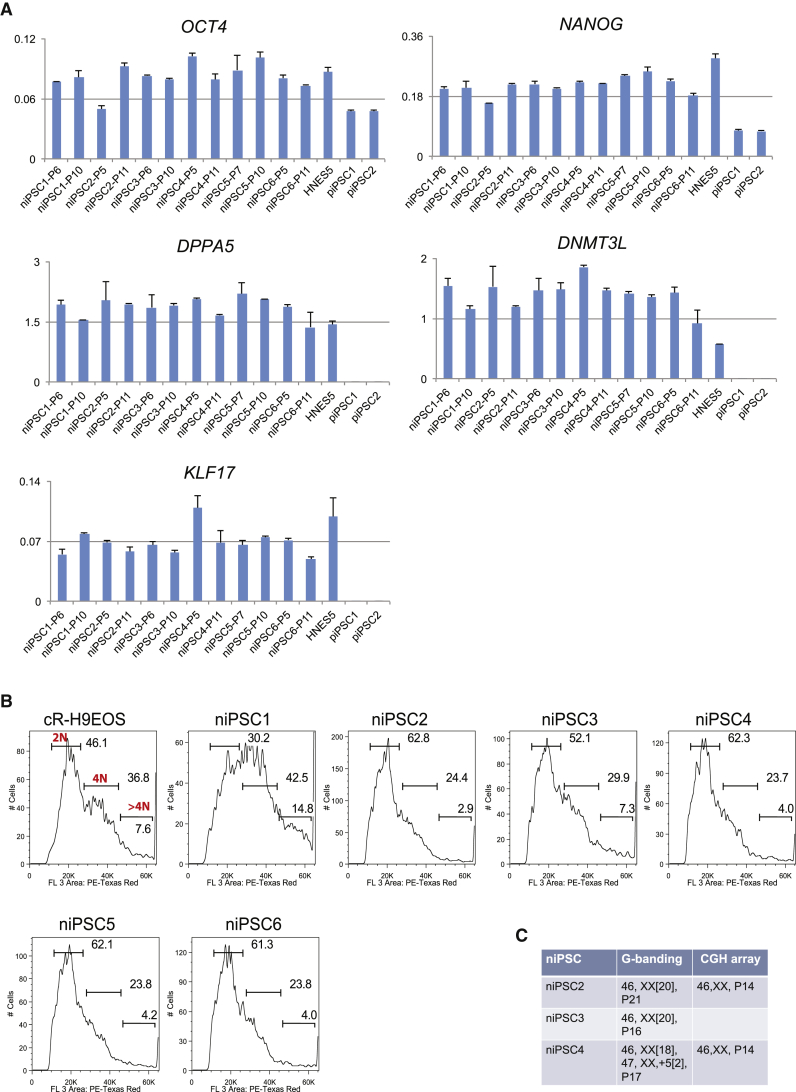
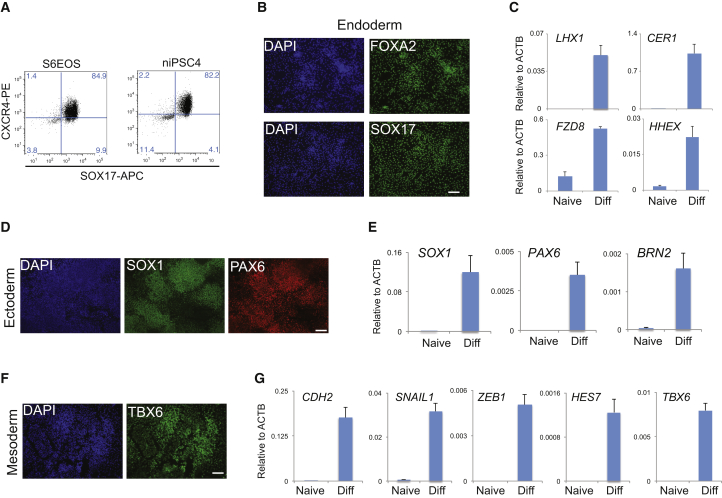
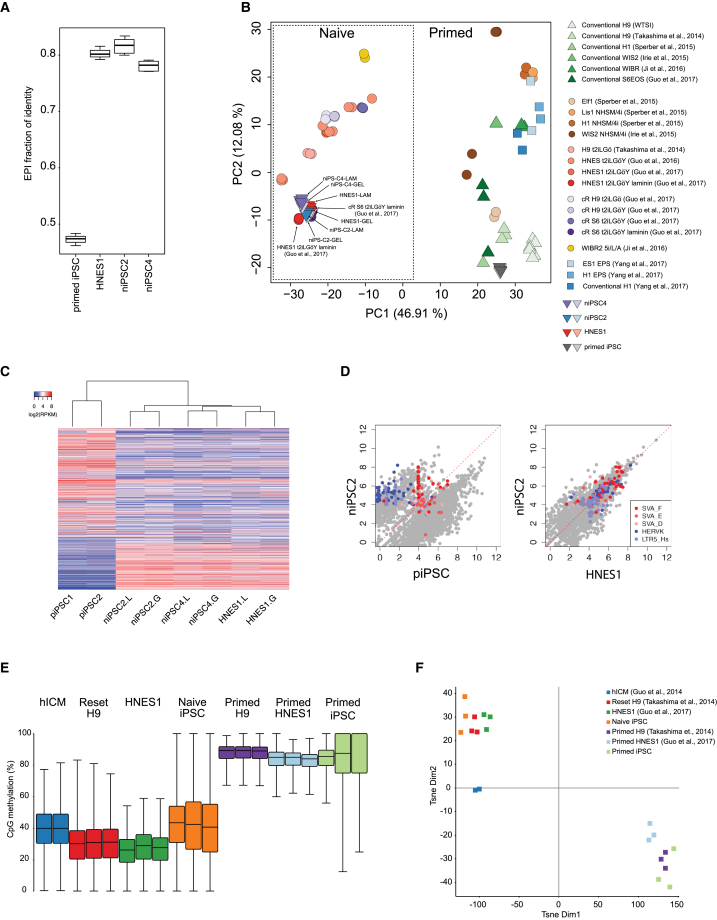
In contrast to conventional human pluripotent stem cells (hPSCs) that are related to post-implantation embryo stages, naive hPSCs exhibit features of pre-implantation epiblast. Naive hPSCs are established by resetting conventional hPSCs, or are derived from dissociated embryo inner cell masses. Here we investigate conditions for transgene-free reprogramming of human somatic cells to naive pluripotency. We find that Wnt inhibition promotes RNA-mediated induction of naive pluripotency. We demonstrate application to independent human fibroblast cultures and endothelial progenitor cells. We show that induced naive hPSCs can be clonally expanded with a diploid karyotype and undergo somatic lineage differentiation following formative transition. Induced naive hPSC lines exhibit distinctive surface marker, transcriptome, and methylome properties of naive epiblast identity. This system for efficient, facile, and reliable induction of transgene-free naive hPSCs offers a robust platform, both for delineation of human reprogramming trajectories and for evaluating the attributes of isogenic naive versus conventional hPSCs.

Keywords: RNA-mediated reprogramming; Wnt signaling; human pluripotent stem cells; human pre-implantation epiblast; induced pluripotent stem cells; molecular reprogramming; naive pluripotency.


Figures

Figure 1
Figure 1
Wnt Inhibition Enhances Naive Reprogramming by RNA (A) Schematic of reprogramming protocol. (B) Morphology during initial reprogramming in medium with FGF2. (C) Morphology in naive capture medium, PGL or PXGL. See also Figure S1A. (D) Flow cytometry analysis of EpCAM and SUSD2 expression after 12 days in PGL with CH (t2iLGö) or XAV. Scatterplots on left, histograms on right. (E) qRT-PCR analysis of pluripotency markers after 12 days in PGL-based medium. Scale bars, 100 μm. Error bars indicate SD of two technical replicates. See also Figure S1.
Figure 2
Figure 2
Reproducibility of Reprogramming in PXGL (A) Well of HDF75 reprogramming culture after 13 days in PXGL, stained in situ with SUSD2-PE antibody. See also Figure S1B. Scale bar, 2 mm. (B) Immunostaining for KLF17 and NANOG after 15 days in PXGL. Scale bar, 100 μm. (C) Flow cytometry analysis SUSD2 and CD24 expression at day 13 in PXGL for different fibroblast lines. (D) Marker analysis by qRT-PCR of isolated SUSD2+ and SUSD2– populations. Error bars indicate SD of two technical replicates. See also Figure S2.
Figure 3
Figure 3
Expansion and Characterization of Naive iPSCs (A) Morphology of naive iPSC culture on MEFs at passage 1 after reprogramming. (B) Flow cytometry analysis of SUSD2 and CD24 expression in HDF16-, HDF75-, and BJ-derived naive iPSC cultures at passage 2, compared to chemically reset H9 naive cells. (C) SUSD staining of naive iPSC cultures of indicated origin after sorting and subsequent passaging (P). (D) Immunostaining for naive markers in expanded naive iPSCs (BJ derived). (E) qRT-PCR analysis of marker expression in expanded naive iPSCs of indicated origins and embryo-derived naive HNES1 cells. Data are normalized to expression in conventional H9 cells. Error bars indicate SD of two technical replicates. Scale bars, 100 μm. See also Figure S3.
Figure 4
Figure 4
Expansion of Naive iPSCs from Single Colonies (A) qRT-PCR analysis of pluripotency markers in six expanded naive iPSC colonies at indicated passages. Two isogenic conventional iPSC colonies (piPSC1 and piPSC2) expanded in parallel and embryo-derived HNES5 cells are included for comparison. Error bars indicate SD of two technical replicates. (B) DNA content analysis from flow cytometry profiles of cells stained with propidium iodide. Diploid genome population is labeled as 2N, 4N indicates cells in G2 and/or tetraploid, hyperpolypoid is >4N. (C) Chromosome analyses of expanded niPSC colonies at indicated passasages (P).
Figure 5
Figure 5
Differentiation of Capacitated Naive iPSCs (A) Flow cytometry analysis of SOX17 and CXCR4 expression after 3 days definitive endoderm induction of primed S6EOS and capacitated niPSC4 cells. (B) Immunostaining for FOXA2 and SOX17 after 3 days definitive endoderm induction of niPSC2. (C) qRT-PCR analysis of definitive endoderm markers after 3 days induction of niPSC2. (D) Immunostaining for SOX1 and PAX6 after 10 days neuroectoderm induction of niPSC2. (E) qRT-PCR analysis of neuroectoderm marker expression. (F) Immunostaining for TBX6 after 6 days of paraxial mesoderm induction of niPSC2. (G) qRT-PCR analysis of paraxial mesoderm markers. Scale bars, 100 μm. Error bars indicate SD of three technical replicates. See also Figure S4.
Figure 6
Figure 6
Global Molecular Analyses of Naive iPSCs (A) Fraction of identity with human pre-implantation epiblast for primed iPSCs, embryo-derived naive stem cells (HNES1), and naive iPSCs. Boxplots show four independent cell cultures of each indicated type. (B) Principal-component analysis using all expressed protein-coding genes. (C) A heatmap showing the expression of 6,290 differentially expressed TEs (log2FC > 2, p < 0.05 in any pairwise comparison; and log2(norm counts) > 3.5 expression in any sample). TEs are ranked by the average log2FC of four possible different comparisons between naive iPSC (niPSC) on laminin (L) or geltrex (G), and primed iPSC (piPSC) cell types. (D) Scatterplots showing the expression of TEs in piPSCs, niPSC2, and HNES1 cells. TEs from representative TE subfamilies that are differentially expressed between naive and primed cells are highlighted. (E) Boxplots showing the global distribution of CpG methylation levels from pooled replicates of the indicated samples compared with published datasets (Guo et al., 2014, Guo et al., 2017, Takashima et al., 2014). iPSC samples are from two independent experiments. Methylation was quantitated over 20-kb genomic tiles. (F) tSNE plot showing the distribution and clustering of the analyzed datasets. Methylation was quantitated over 20-kb genomic tiles. See also Figure 5.

References

    1. Anders S., Pyl P.T., Huber W. HTSeq––a Python framework to work with high-throughput sequencing data. bioRxiv. 2014 - PMC - PubMed
    1. Blakeley P., Fogarty N.M.E., del Valle I., Wamaitha S.E., Hu T.X., Elder K., Snell P., Christie L., Robson P., Niakan K.K. Defining the three cell lineages of the human blastocyst by single-cell RNA-seq. Development. 2015;142:3151–3165. - PMC - PubMed
    1. Bredenkamp N., Stirparo G.G., Nichols J., Smith A., Guo G. The cell surface marker sushi containing domain 2 facilitates establishment of human naïve pluripotent stem cells. Stem Cell Reports. 2019;12:1212–1222. - PMC - PubMed
    1. Chal J., Oginuma M., Al Tanoury Z., Gobert B., Sumara O., Hick A., Bousson F., Zidouni Y., Mursch C., Moncuquet P. Differentiation of pluripotent stem cells to muscle fiber to model Duchenne muscular dystrophy. Nat. Biotechnol. 2015;33:962–969. - PubMed
    1. Chambers S.M., Fasano C.A., Papapetrou E.P., Tomishima M., Sadelain M., Studer L. Highly efficient neural conversion of human ES and iPS cells by dual inhibition of SMAD signaling. Nat. Biotechnol. 2009;27:275–280. - PMC - PubMed

Publication types