. 2019 Oct 25:13:1126.
doi: 10.3389/fnins.2019.01126. eCollection 2019.

The Relationship Between Local Field Potentials and the Blood-Oxygenation-Level Dependent MRI Signal Can Be Non-linear

Affiliations

The Relationship Between Local Field Potentials and the Blood-Oxygenation-Level Dependent MRI Signal Can Be Non-linear

Xiaodi Zhang et al. Front Neurosci. .

Abstract

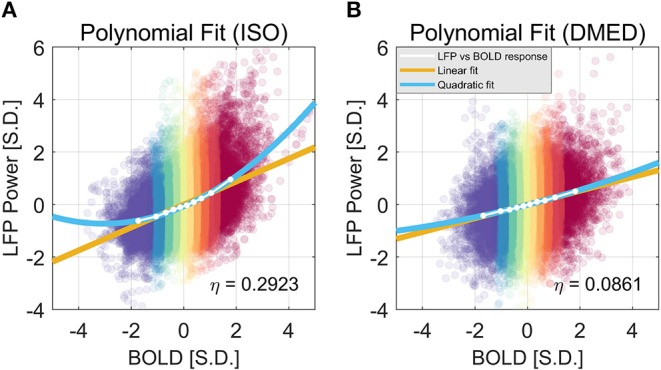
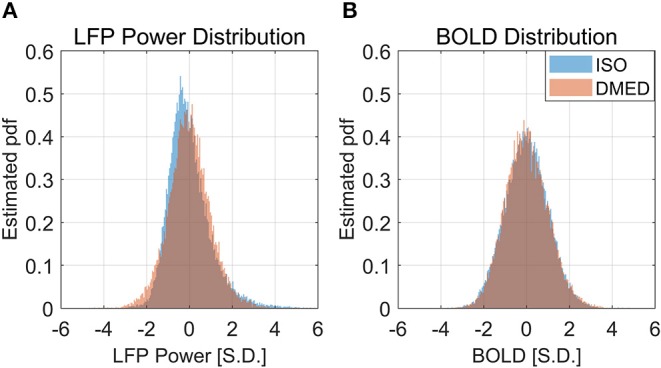
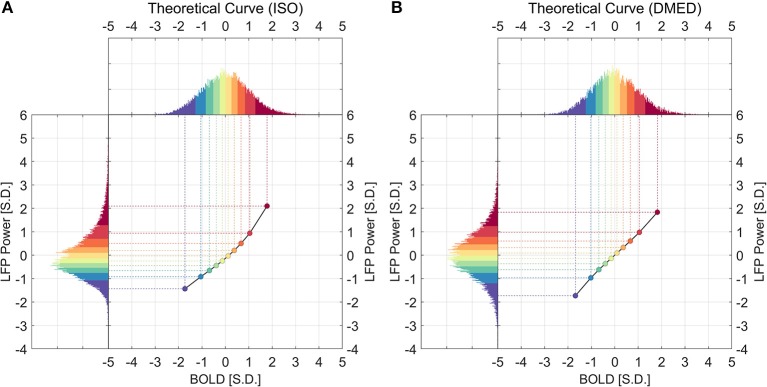
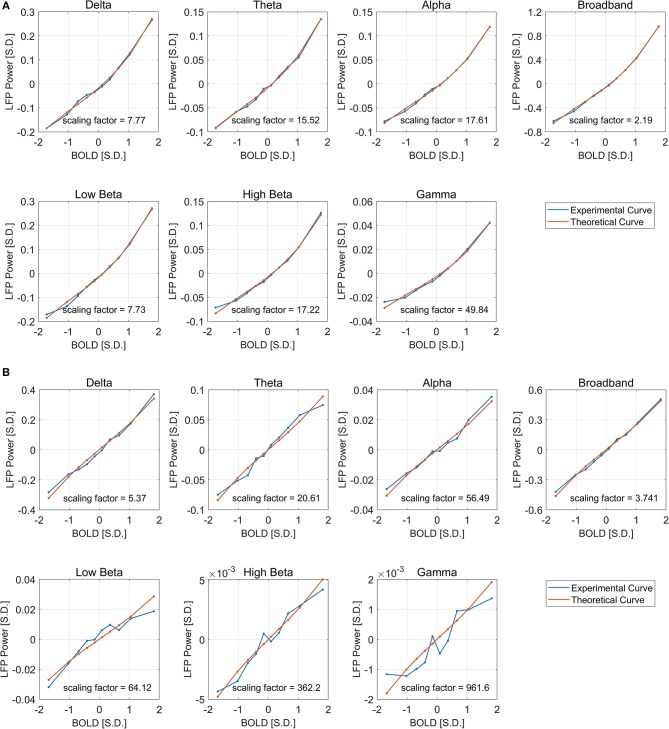
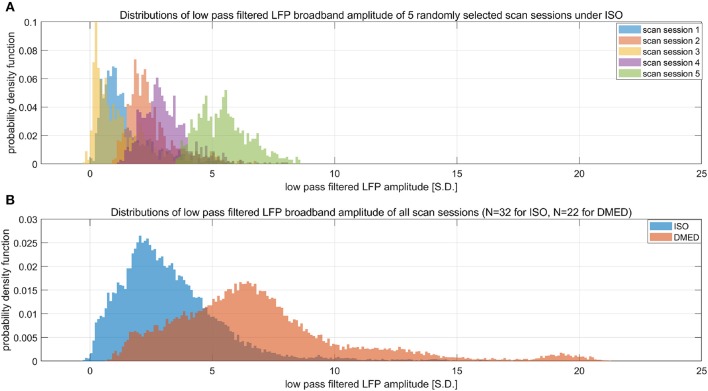
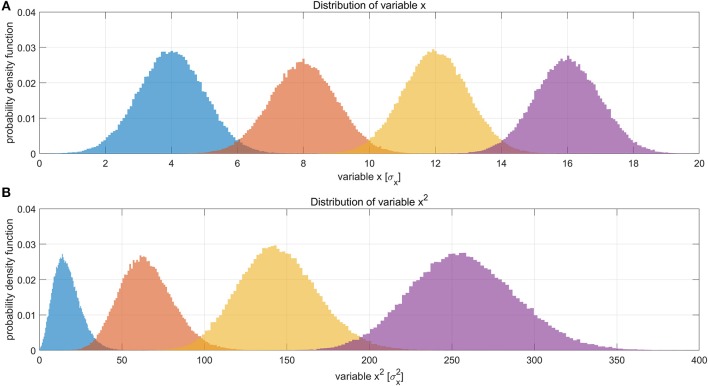
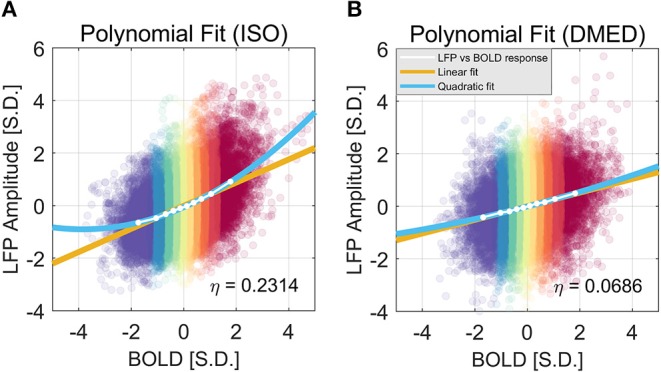
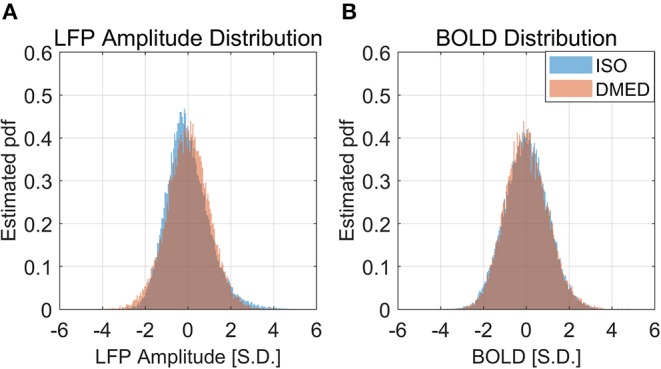
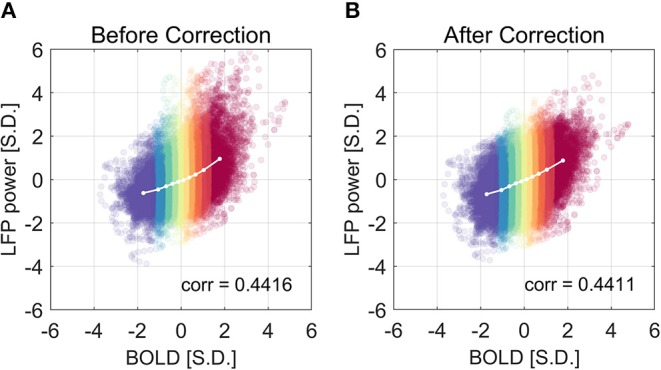
Functional magnetic resonance imaging (fMRI) is currently one of the most important neuroimaging methods in neuroscience. The image contrast in fMRI relies on the blood-oxygenation-level dependent (BOLD) signal, which indirectly reflects neural activity through neurovascular coupling. Because the mechanism that links the BOLD signal to neural activities involves multiple complicated processes, where neural activity, regional metabolism, hemodynamics, and the BOLD signal are all inter-connected, understanding the quantitative relationship between the BOLD signal and the underlying neural activities is crucial for interpreting fMRI data. Simultaneous local field potential (LFP) and fMRI recordings provide a method to study neurovascular coupling. There were a few studies that have shown non-linearities in stimulus related responses, but whether there is any non-linearity in LFP-BOLD relationship at rest has not been specifically quantified. In this study, we analyzed the simultaneous LFP and resting state-fMRI data acquired from rodents, and found that the relationship between LFP and BOLD is non-linear under isoflurane (ISO) anesthesia, but linear under dexmedetomidine (DMED) anesthesia. Subsequent analysis suggests that such non-linearity may come from the non-Gaussian distribution of LFP power and switching from LFP power to LFP amplitude can alleviate the problem to a degree. We also confirmed that, despite the non-linearity in the mean LFP-BOLD curve, the Pearson correlation between the two signals is relatively unaffected.

Keywords: BOLD; correlation; electrophysiology; fMRI; local field potentials; neurovascular coupling; non-linearity.


Figures

Figure 1
Figure 1
EPI image (A) and cross-correlation (B) between the LFP recorded from left S1 area and the BOLD signal. The location of the electrodes was indicated by the triangles overlaid on the EPI image. It can be seen that for this subject, the LFP recorded from left S1 area shows significant localized correlation with the BOLD signal near the electrodes on both hemispheres. The colormap for the correlation is shown on the right.
Figure 2
Figure 2
Scatter plot of LFP power vs. BOLD and the centroids of each category under ISO (A) and DMED (B). The 10 BOLD categories are color-coded (Red for high BOLD value and Blue for low BOLD value). Each dot in the figure represents a time point with its BOLD value and LFP power value. In total there are 32,000 points under ISO, and 22,000 points under DMED, since each scan session has exact 1,000 time points. The cross-correlation between LFP power and BOLD is shown for each LFP band. The BOLD value and the LFP power value were expressed in units of standard deviation [S.D.]. Both BOLD and LFP power were normalized so that the standard deviation of BOLD is 1, and the standard deviation of LFP broadband power is also 1. For the individual LFP frequency bands, the summation of the power in the six bands at any given time points equals to the LFP broadband power (so any individual band will have a standard deviation lower than 1 standard deviation of LFP broadband power. Note that the display scale of different frequency bands may be different.
Figure 3
Figure 3
Quadratic Fitting of LFP power vs. BOLD response under ISO (A) and DMED (B). The quadratic fitting captures the shape of the LFP power vs. BOLD response well. Under ISO the LFP power-BOLD relationship is much more non-linear than under DMED. Under ISO, the fitted coefficients a, b, c, are 0.0713, 0.4344, −0.0696, respectively. The p-values are 2.06e-05, 2.13e-10, 0.00029, respectively. The 95% confidence intervals are [0.0546, 0.0881], [0.4151, 0.4536], [−0.0944, −0.0449], respectively. Under DMED, the fitted coefficients a, b, c, are 0.0124, 0.2606, −0.0130, respectively. The p-values are 0.0122, 8.06e-11, 0.0465, respectively. The 95% confidence intervals are [0.0036, 0.0211], [0.2505, 0.2706], [–0.0258, −0.0003], respectively. Both ISO and DMED have a second order coefficient still significantly different from zero (p = 2.06e-05 < 0.05 under ISO, p = 0.0122 < 0.05 under DMED), however under ISO the magnitude of the coefficient is much larger, which is why we can visually see a curvature. The non-linearity, measured by the ratio between the second order term and the first order term, is also shown in the figure.
Figure 4
Figure 4
Histogram of LFP broadband power, BOLD under ISO (A) and DMED (B). It can be seen that the LFP power under ISO is non-Gaussian distributed.
Figure 5
Figure 5
Histograms of LFP, BOLD, and the derived theoretical LFP vs. BOLD response under ISO (A) and DMED (B). For any given point in the LFP vs. BOLD response, the x-axis shows the averaged BOLD value of the BOLD group, while the y-axis shows the averaged LFP broadband power value of the corresponding LFP group.
Figure 6
Figure 6
Least square fitting of experimental and theoretical LFP vs. BOLD responses under ISO (A) and DMED (B). The fitting is good across all frequency bands and both anesthesia conditions. The scaling factor shows the amount of amplification needed by the experimental response to match with the theoretical one.
Figure 7
Figure 7
Histograms of low pass filtered LFP broadband amplitude. (A) Shows five randomly selected scan sessions under ISO to illustrate the variety in their mean value. (B) Shows the overall distribution of low pass filtered (under 0.1 Hz under ISO and under 0.25 HZ under DMED) LFP broadband amplitude obtained from the entire dataset (N = 32 for ISO, N = 22 for DMED). Since low pass filtering preserves the direct current component, it can be seen that the LFP amplitude under ISO actually has a much lower baseline (mean value) when compared to under DMED. The unit in the figure is 1 standard deviation (S.D.) of the band pass filtered (0.01–0.1 Hz under ISO and 0.01–0.25 Hz under DMED) LFP broadband amplitude. So the scale of the signal is the same as the ones shown in previous figures, with the only difference being the superposition of the direct current component preserved by switching band pass filtering to low pass filtering.
Figure 8
Figure 8
Illustration of how Gaussian distributions can transform to non-Gaussian ones by taking the power of two, and the degree of non-linearity is influenced by the mean value (baseline) of the original distribution. (A) Shows four different distributions of a hypothetical variable x, representing the LFP amplitude. The histograms were obtained by Monte Carlo simulation of 100,000 points for each distribution. The four distributions have the same standard deviation (σ = 1σx) but different mean values (μ = 4σx, 8σx, 12σx, 16σx, respectively). (B) Shows the distributions of variable x2. The unit in panel B is σx2. It can be clearly seen that the one with the lowest mean value (blue), become much more non-Gaussian after taking the power of two, whereas the one with the highest mean value (purple) still remains approximately Gaussian. This suggests that the non-Gaussian distribution of LFP power under ISO (shown in Figure 4) may partly come from taking the power of two.
Figure 9
Figure 9
Quadratic Fitting of LFP amplitude vs. BOLD response under ISO (A) and DMED (B). It can be seen that, under ISO, the non-linearity in LFP amplitude–BOLD relationship is smaller than the one in LFP power—BOLD relationship, although the remaining non-linearity is still considerably larger than the one under DMED. Under ISO, the fitted coefficients a, b, c, are, 0.0570, 0.4386, −0.0606, respectively. The p-values are, 7.24e-6, 1.39e-11, 6.35e-5, respectively. The 95% confidence intervals are [0.0456, 0.0685], [0.4255, 0.4518], [−0.0775, −0.0437], respectively. Under DMED, the fitted coefficients a, b, c, are 0.0098, 0.2584, −0.0099, respectively. The p-values are 0.0321, 8.09e-11, 0.1085, respectively. The 95% confidence intervals are [0.0011, 0.0184], [0.2484, 0.2684], [−0.0226, 0.0028], respectively.
Figure 10
Figure 10
Histogram of LFP broadband amplitude, BOLD under ISO (A) and DMED (B). It can be seen that the LFP amplitude under ISO is less skewed than LFP power, but is still non-Gaussian distributed.
Figure 11
Figure 11
The correlation coefficient is not improved after the non-linear correction. The correlation coefficient before and after non-linearity correction was shown in (A) and (B), respectively. The experimental LFP power vs. BOLD relationship is more linear after the non-linear correction, but there is little change in the correlation coefficient.

Similar articles

Cited by

References

    1. Arthurs O. J., Boniface S. (2002). How well do we understand the neural origins of the fMRI BOLD signal? Trends Neurosci. 25, 27–31. 10.1016/S0166-2236(00)01995-0 - DOI - PubMed
    1. Bandettini P. A., Ungerleider L. G. (2001). From neuron to BOLD: new connections. Nat. Neurosci. 4:864. 10.1038/nn0901-864 - DOI - PubMed
    1. Belliveau J. W., Kennedy D. N., McKinstry R. C., Buchbinder B. R., Weisskoff R., Cohen M. S., et al. . (1991). Functional mapping of the human visual cortex by magnetic resonance imaging. Science 254, 716–719. 10.1126/science.1948051 - DOI - PubMed
    1. Biswal B., Zerrin Yetkin F., Haughton V. M., Hyde J. S. (1995). Functional connectivity in the motor cortex of resting human brain using echo-planar MRI. Magn. Reson. Med. 34, 537–541. 10.1002/mrm.1910340409 - DOI - PubMed
    1. de Zwart J. A., van Gelderen P., Jansma J. M., Fukunaga M., Bianciardi M., Duyn J. H. (2009). Hemodynamic nonlinearities affect BOLD fMRI response timing and amplitude. Neuroimage 47, 1649–1658. 10.1016/j.neuroimage.2009.06.001 - DOI - PMC - PubMed

LinkOut - more resources