. 2019 Oct 25:10:1215.
doi: 10.3389/fphar.2019.01215. eCollection 2019.

Computational Analysis of Therapeutic Neuroadaptation to Chronic Antidepressant in a Model of the Monoaminergic Neurotransmitter and Stress Hormone Systems

Affiliations

Computational Analysis of Therapeutic Neuroadaptation to Chronic Antidepressant in a Model of the Monoaminergic Neurotransmitter and Stress Hormone Systems

Mariam B Camacho et al. Front Pharmacol. .

Abstract

The clinical practice of selective serotonin reuptake inhibitor (SSRI) augmentation relies heavily on trial-and-error. Unfortunately, the drug combinations prescribed today fail to provide relief for many depressed patients. In order to identify potentially more effective treatments, we developed a computational model of the monoaminergic neurotransmitter and stress-steroid systems that neuroadapts to chronic administration of combinations of antidepressant drugs and hormones by adjusting the strengths of its transmitter-system components (TSCs). We used the model to screen 60 chronically administered drug/hormone pairs and triples, and identified as potentially therapeutic those combinations that raised the monoamines (serotonin, norepinephrine, and dopamine) but lowered cortisol following neuroadaptation in the model. We also evaluated the contributions of individual and pairs of TSCs to therapeutic neuroadaptation with chronic SSRI using sensitivity, correlation, and linear temporal-logic analyses. All three approaches revealed that therapeutic neuroadaptation to chronic SSRI is an overdetermined process that depends on multiple TSCs, providing a potential explanation for the clinical finding that no single antidepressant regimen alleviates depressive symptoms in all patients.

Keywords: SSRI augmentation; combination therapy; cortisol; depression; monoamine; overdetermined system; polypharmacy; systems biology.


Figures

Figure 1
Figure 1
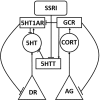
Simplified schematic representation of the model. The Monoamine-Stress model takes the form of a recurrent neural network of nonlinear elements (units) that represent neurotransmitter-producing regions, enzymes, neurotransmitters, hormones, and receptors. Each unit type in the model is represented using a different shape in this highly simplified model diagram, in which only one or two of each unit type is shown. The full model diagram incorporates all three monoaminergic neurotransmitter-producing brain regions and the stress hormone system, and can be viewed in Supplemental Material . Neurotransmitter and hormone producing regions are represented as triangles, neurotransmitters and hormones are represented as circles, protein molecules are represented as rectangles, and inputs are represented as rounded rectangles. Connections between model units can be excitatory (arrow) or inhibitory (tee). DR, dorsal raphe; AG, adrenal gland; 5HT, serotonin; CORT, cortisol; 5HTT, serotonin transporter; 5HT1AR, 5HT1A receptor; and GCR, glucocorticoid receptor.
Figure 2
Figure 2
Agreement between desired (i.e., target) and actual outputs after pruning and re-training. All of the desired and actual outputs, collected over all input/desired-output patterns, are represented in a single plot for each of the brain region and transmitter or hormone output units (DR, LC, VTA, PVN, 5HT, NE, DA, and CORT). Each output response is plotted as a solid line and each target (i.e. desired) output is plotted as a dashed line. Each of the outputs reach a steady-state value within 25 time steps. The RMS error of this network is 5.10 × 10⁻⁵. Note that the solid line (actual output) is superimposed on the dashed line (desired or target output), illustrating the accuracy of the training method.
Figure 3
Figure 3
Model element activities in the baseline (no-drug) condition, acute (no-adaptation) SSRI condition, and chronic (adaptation) SSRI condition. Each plot corresponds to a different model unit as labeled. The blue dotted line in each plot shows the baseline activity level of a unit in the normal (no-drug) baseline condition. The red line in each plot shows the unit activity in the acute (no-adaptation) SSRI condition. Note that acute SSRI changes the activity levels of all of the units. The yellow line in each plot shows the adapted activity of a unit in an example, adapted configuration with chronic SSRI. Note that the adapted DR and PVN unit responses return closer to baseline, and the adapted 5HT and CORT responses increase and decrease, respectively. DR, dorsal raphe; LC, locus coeruleus; VTA, ventral tegmental area; PVN, paraventricular nucleus of the hypothalamus; 5HT, serotonin; NE, norepinephrine; DA, dopamine; and CORT, cortisol.
Figure 4
Figure 4
Histograms showing numbers of configurations adapted to SSRI expressing different levels of monoamines or CORT. Results are shown for three networks individually or pooled. Networks were adapted to chronic SSRI. The bin width of these and all other histograms was set to 0.03. The blue, green, or magenta vertical line in each plot is located at the baseline level (0.50), the average level, or the therapeutic cutoff (0.70), respectively, for each neurotransmitter or hormone. This figure also demonstrates pooling of the adapted configurations from three networks.
Figure 5
Figure 5
Histograms showing number of adapted configurations expressing different monoamine and CORT levels with combinations of SSRI, Asenapine, and Oxytocin. Networks were adapted to SSRI alone (A), SSRI+Asenapine (Asn, an antipsychotic drug) (B), SSRI+Oxytocin (Oxt, a hormone) (C), and SSRI+Asn+Oxt (D). (B) and (C) show that combining an SSRI with either Asn or Oxt increases the proportion of high monoamine and low CORT states over the SSRI by itself. (D) shows that combining an SSRI with both Oxt and Asn further increases the proportion of high monoamine and low CORT states. These histograms suggest that combining an SSRI with either Oxt, Asn, or both may be therapeutic for a greater proportion of patients than an SSRI administered alone.
Figure 6
Figure 6
Histograms showing number of adapted configurations expressing different monoamine and CORT levels with combinations of SSRI, Bupropion, and Olanzapine. Networks were adapted to SSRI alone (A), SSRI+Bupropion (Bup, a NET and DAT blocker) (B), SSRI+Olanzapine (Olan, an antipsychotic drug) (C), and SSRI+Bup+Olan (D). (B) and (C) show that combining an SSRI with either Bup or Olan increases the proportion of high monoamine and low CORT states over the SSRI by itself. (D) shows that combining an SSRI with both Bup and Olan further increases the proportion of high monoamine and low CORT states. The histograms in (D) illustrate that the combination of SSRI+Bup+Olan shifts the monoamine and CORT histograms, especially those of NE and DA, toward more therapeutic states, suggesting that this combination can be therapeutic for a greater proportion of patients than an SSRI administered alone.
Figure 7
Figure 7
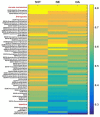
Heatmap of adapted monoamine levels with SSRI, all other drugs paired with SSRI, and selected 3-drug combinations. Adapted monoamine levels were averaged over the three networks and expressed as a vector [5HT NE DA]. The excess monoamine reference vector, representing levels high enough that they could be associated with unwanted side effects, was set to [0.80 0.80 0.80]. All drug combinations that resulted in one or more excess monoamine levels were ordered by vector distance from the excess monoamine reference vector. The therapeutic and the baseline reference vectors were set to [0.70 0.70 0.70] and [0.50 0.50 0.50], respectively. The baseline reference vector and all remaining drug pair and triple vectors were ordered by vector distance from the therapeutic reference vector. GBR, GBR-12909; WAY, WAY-100635; PPX, Pramipexole; RU, RU-28362; Org, Org-34850; CP, CP-96345; MAOI, Monoamine oxidase inhibitor.
Figure 8
Figure 8
Comparison of average adjustable TSC strengths between resistant and sensitive configurations in all representative networks. Every configuration adapted to chronic SSRI that was also therapeutic (high 5HT and low CORT) at degree 6 was assessed for resistance to adjustments of each of the 10 adjustable TSCs. All TSC strength adjustments that resulted in configurations that were no longer adapted were excluded. Configurations that remained adapted and therapeutic following weight adjustments were determined to be “resistant” and adapted configurations that were no longer therapeutic following TSC adjustments were determined to be “sensitive.” The average strength of each of the 10 adjustable TSCs in all of the configurations, excluding those in which that TSC itself was adjusted, was computed for both the resistant and sensitive configurations and plotted as asterisks or diamonds, respectively. The results for all three networks are represented on this single plot using three different colors (red, blue, or green) to distinguish between the mean adjustable TSC strengths of each network. Note that the average resistant and sensitive strengths for each adjustable TSC are very close in all three networks, illustrating that each individual TSC can provide a contribution to therapeutic resistance, but no single TSC by itself determines the therapeutic state. 5HT1AR, 5HT1A receptor; AR2, α-2 adrenergic receptor; GCR, glucocorticoid receptor; DAT, DA transporter; NET, NE transporter; 5HTT, 5HT transporter; CRF1R, CRF1 receptor; DR, dorsal raphe; LC, locus coeruleus; VTA, ventral tegmental area; PVN, paraventricular nucleus of the hypothalamus; Pit, pituitary gland; Adr, adrenal gland.

Similar articles

References

    1. Ananth J. (1998). Treatment-resistant depression. Psychother Psychosom;67:61-70. 10.1159/000012261 - DOI - PubMed
    1. Adson D. E., Kushner M. G., Eiben K. M., Schulz S. C. (2004). Preliminary experience with adjunctive quetiapine in patients receiving selective serotonin reuptake inhibitors. Depress. Anxiety 19, 121–126. 10.1002/da.10137 - DOI - PubMed
    1. Albert P. R., Vahid-Ansari F., Luckhart C. (2014). Serotonin-prefrontal cortical circuitry in anxiety and depression phenotypes: pivotal role of pre- and post-synaptic 5-HT1A receptor expression. Front. Behav. Neurosci. 8, 199. 10.3389/fnbeh.2014.00199 - DOI - PMC - PubMed
    1. Amini-Khoei H., Mohammadi-Asl A., Amiri S., Hosseini M.-J., Momeny M., Hassanipour M., et al. (2017). Oxytocin mitigated the depressive-like behaviors of maternal separation stress through modulating mitochondrial function and neuroinflammation. Prog. Neuro-Psychopharmacol. Biol. Psychiatry 76, 169–178. 10.1016/j.pnpbp.2017.02.022 - DOI - PubMed
    1. Anastasio T. J. (2017). Editorial: Computational and experimental approaches in multi-target pharmacology. Front. Pharmacol. 8, 443. 10.3389/fphar.2017.00443 - DOI - PMC - PubMed

LinkOut - more resources