. 2019 Oct 25:10:2514.
doi: 10.3389/fimmu.2019.02514. eCollection 2019.

A Bispecific Antibody to Link a TRAIL-Based Antitumor Approach to Immunotherapy

Affiliations

A Bispecific Antibody to Link a TRAIL-Based Antitumor Approach to Immunotherapy

Alessandro Satta et al. Front Immunol. .

Abstract

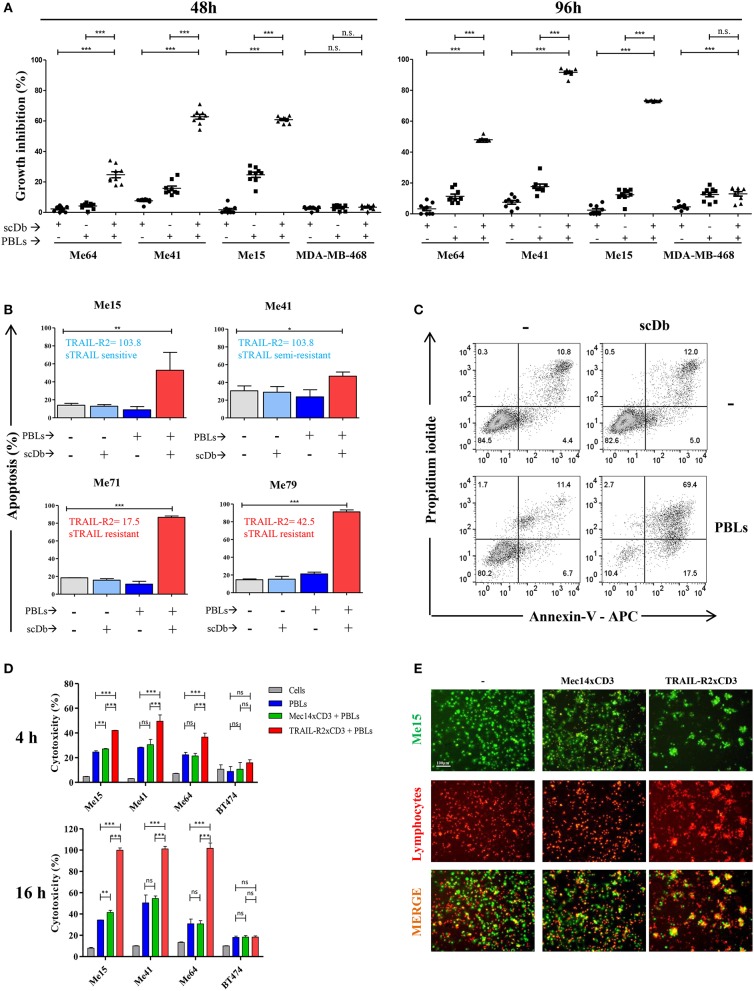
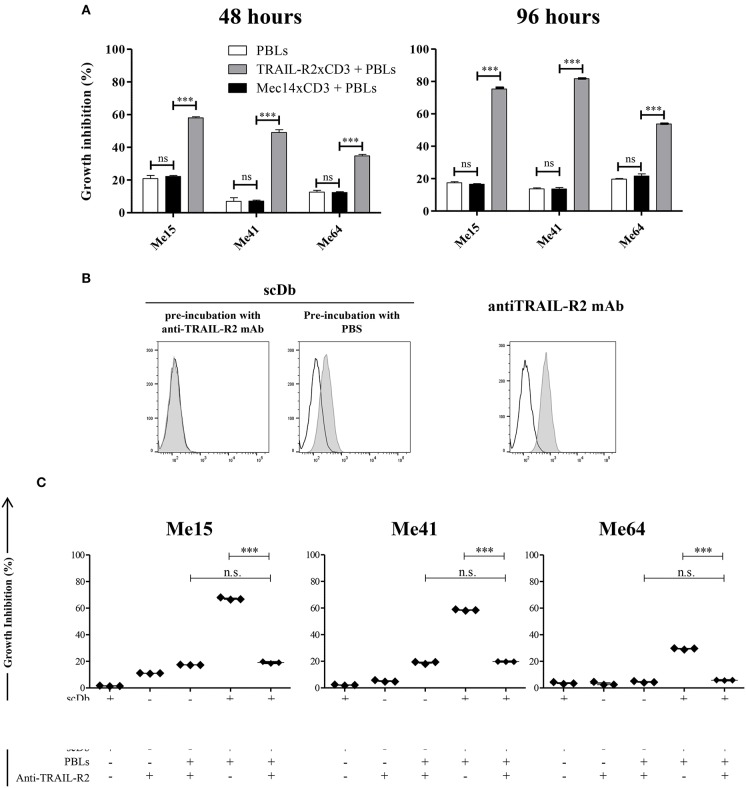
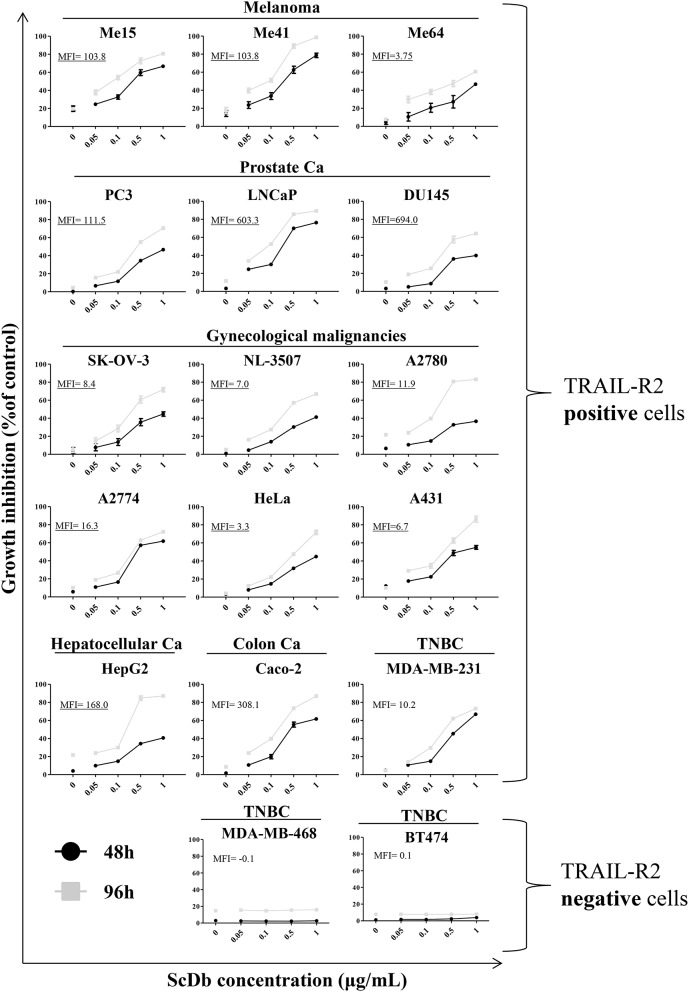
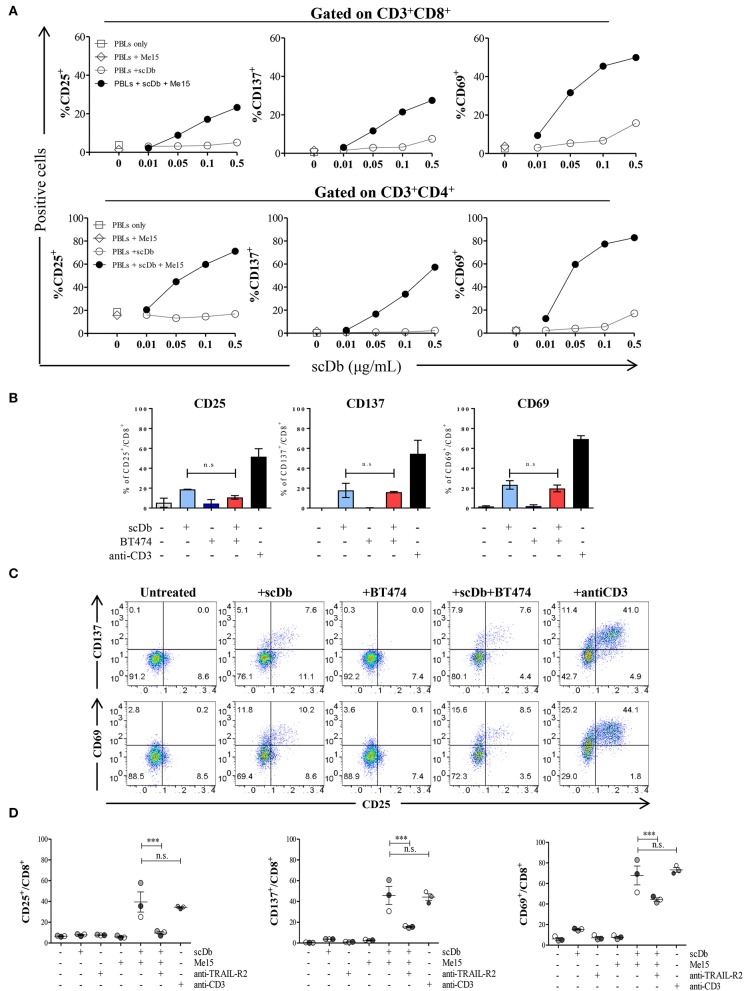
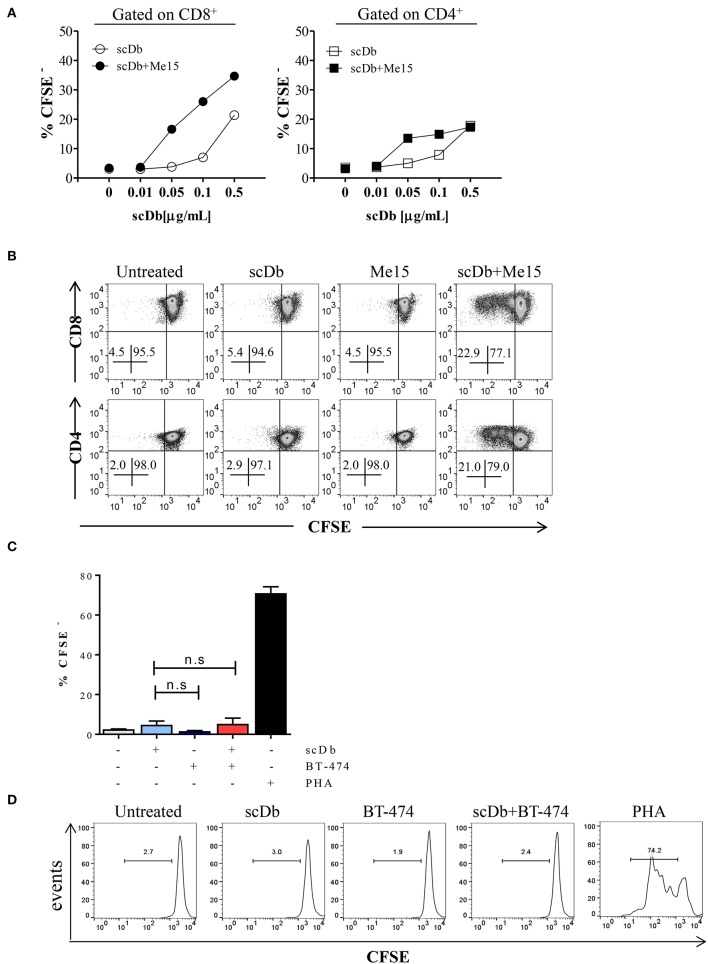
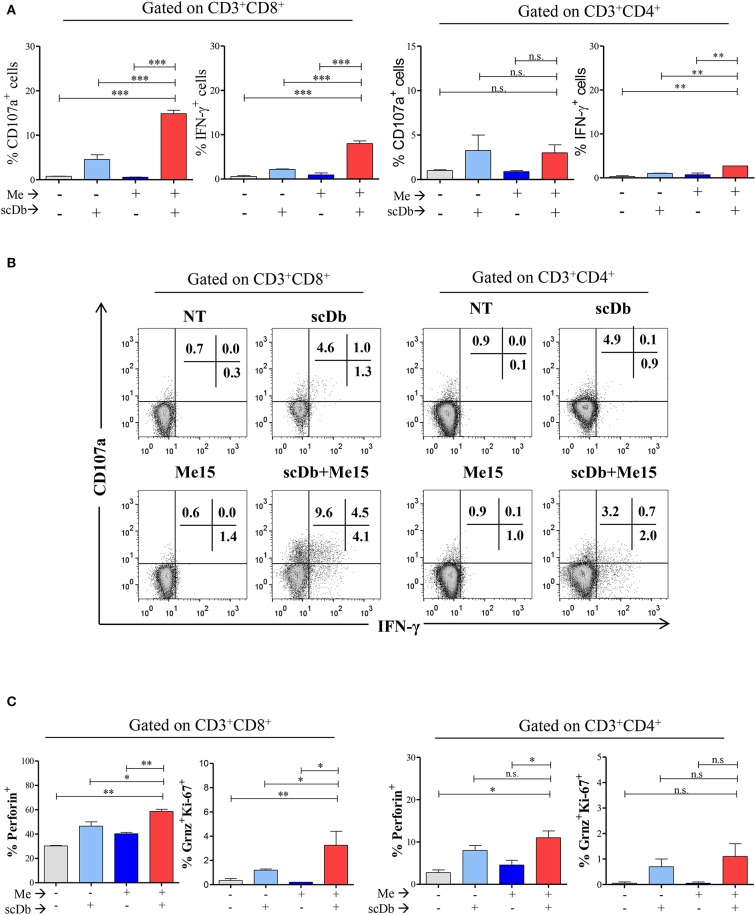
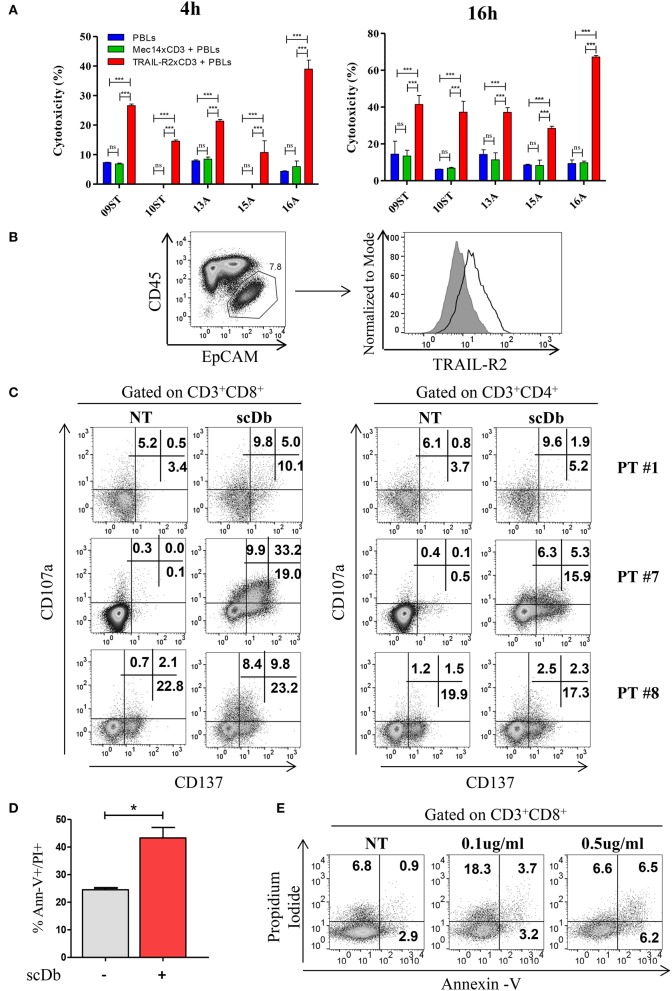
T-cell-based immunotherapy strategies have profoundly improved the clinical management of several solid tumors and hematological malignancies. A recently developed and promising immunotherapy approach is to redirect polyclonal MHC-unrestricted T lymphocytes toward cancer cells by bispecific antibodies (bsAbs) that engage the CD3 complex and a tumor-associated antigen (TAA). The TNF-related apoptosis-inducing ligand receptor 2 (TRAIL-R2) is an attractive immunotherapy target, frequently expressed by neoplastic cells, that we decided to exploit as a TAA. We found that a TRAIL-R2xCD3 bsAb efficiently activates T cells and specifically redirect their cytotoxicity against cancer cells of different origins in vitro, thereby demonstrating its potential as a pan-carcinoma reagent. Moreover, to mimic in vivo conditions, we assessed its ability to retarget T-cell activity in an ex vivo model of ovarian cancer patients' ascitic fluids containing both effector and target cells-albeit with a suboptimal effector-to-target ratio-with remarkable results.

Keywords: T-cell retargeting; TRAIL-R2; bispecific antibody; immunotherapy; malignant ascites.


Figures

Figure 1
Figure 1
ScDb-redirected T-cell killing of melanoma cell lines. (A) Growth inhibition assays performed using nine different batches of PBLs (each derived from a different healthy donor) in the presence or absence of scDb. TRAIL-R2-expressing Me64, Me41, and Me15 and TRAIL-R2-negative MDA-MB-468 were used as target cells treated with 0.5 μg/mL of scDb and non-activated PBLs at an E:T ratio of 5:1 for 48 h (left panel) or 96 h (right panel). Each point represents a single experiment. Bars represent the mean of all nine experiments; error bars, SD. (B) Percentage of apoptosis (early + late apoptosis, annexin V+) of two sTRAIL-sensitive melanoma cell lines (top, Me15 and Me41) and two sTRAIL-resistant melanoma cell lines (bottom, Me71 and Me79) co-cultured for 72 h with 0.1 μg/mL scDb, non-activated PBLs, or both at E:T = 5:1. (n = 3; error bars, SD). (C) Representative plot of data shown in (B). (D) Tumor cells were treated for 4 and 16 h with pre-activated PBLs in the presence or absence of TRAIL-R2xCD3 scDb. Irrelevant scDb Mec14xCD3 was used as control. The graphs show the percentage of direct cell lysis as the mean ± SD of three experiments. (E) Immunofluorescence was performed using Me15 cells loaded with calcein-AM (green) and grown for 4 h with pre-activated PBLs stained using a PKH26 Red Fluorescent Cell Linker Kit in the absence (left panels) or presence (right panels) of 0.5 μg/mL TRAIL-R2xCD3 scDb. 0.5 μg/mL irrelevant scDb Mec14xUCHT1 was used as control (central panels). The pictures were taken at the end of the incubation time. Statistical analysis in (A,B,D) by one-way ANOVA followed by Tukey's post-test. *p < 0.05, **p < 0.01, ***p < 0.001; ns: not significant.
Figure 2
Figure 2
Specificity of scDb-mediated cytotoxicity. (A) Growth inhibition assays were performed treating Me15, Me41, and Me64 cells with 0.5 μg/mL irrelevant scDb Mec14xCD3 or scDb TRAIL-R2xCD3 and non activated PBLs at an E:T ratio of 5:1 for 48 and 96 h. Mean values and SD of triplicate determinations are shown. (B) Competition between a commercial anti-TRAIL-R2 mAb and the scDb was evaluated by FACS. Before the addition of the scDb, TRAIL-R2+ Me41 cells were incubated for 1 h with the anti-human TRAIL-R2 mAb (left panel) or with PBS (middle panel). Binding of the scDb is revealed by an anti-6xHis tag rabbit mAb followed by an Alexa Fluor 488-labeled anti-rabbit Ab. The binding of the competing anti-TRAIL-R2 mAb was revealed by a secondary Alexa Fluor 488-labeled antimouse Ab (right panel). Empty peaks: negative control; gray peaks: scDb or mAb. (C) Growth inhibition assays were performed treating Me15, Me41, and Me64 cells with 0.5 μg/mL scDb and non-activated PBLs at an E:T ratio of 5:1 for 48 h. Pre-incubation with 10 μg/mL anti-TRAIL-R2 mAb was used as scDb-competing mAb to test scDb specificity. The graphs show the mean ± SD of three experiments. Each point represents a single experiment. Bars represent the mean ± SD. Statistical analysis in (A,C) by one-way ANOVA followed by Tukey's post-test. ***p < 0.001; n.s.: not significant.
Figure 3
Figure 3
Tumor growth inhibition assay on a panel of TRAIL-R2-positive or negative cells. ScDb-dependent PBL-mediated growth inhibition was performed on several cancer cell lines using scDb concentrations of 0, 0.05, 0.1, 0.5, and 1 μg/mL and an E:T ratio of 5:1 for 48 h (black line) or 96 h (gray line). Non-activated PBLs were used as effectors. The graph represents the mean ± SD of three experiments. In each graph the expression level of TRAIL-R2 as mean fluorescence intensity (MFI) is reported.
Figure 4
Figure 4
Effects of scDb on T-cell activation. (A) Frequency of CD25+, CD137+, and CD69+ T lymphocytes in CD8+ (top) and CD4+ (bottom) subsets after treatment with increasing doses of scDb in the presence of TRAIL-R2+ Me15 cells at E:T=5:1. (B) Effects of scDb on T-cell activation when TRAIL-R2 negative BT-474 cells were treated. Frequency of CD25+, CD137+, and CD69+ T lymphocytes in CD8+ subsets after treatment with 0.5 μg/mL scDb in the presence of TRAIL-R2 BT-474 cells at E:T=5:1. Pre-incubation with 10 μg/mL anti-CD3 was used as positive control. The graphs show the mean ± SD of three experiments. (C) Representative plot of (B). (D) Frequency of CD25+, CD137+, and CD69+ cells in CD8+ T lymphocytes (after gating on CD45+CD3+ cells) after 16 h of treatment with 0.5 μg/mL scDb in the presence or absence of the melanoma target cell line (Me15). Pre-incubation with 10 μg/mL anti-TRAIL-R2 mAb and anti-CD3 was used as scDb-competing Ab and positive control, respectively. The graphs show the mean ± SD of three experiments. Statistical analysis in (B,D) by one-way ANOVA followed by Tukey's post-test. ***p < 0.001; ns: not significant.
Figure 5
Figure 5
ScDb-mediated CD4+ and CD8+ T-cell proliferation. (A) Proliferation (CFSE dilution assay) of CD8+ and CD4+ T cells after overnight treatment with increasing doses of scDb in the presence or absence of TRAIL-R2+ melanoma target cells. (B) Representative plot of data shown in (A). (C) Proliferation assay of CD8+ T cells at day +4 after treatment with 0.1 μg/mL scDb in the presence or absence of TRAIL-R2 negative BT-474 cells. Stimulation with PHA (5 μg/mL) was used as positive control. Graph represents mean ± SD of three different experiments. (D) Representative plot of (C). Statistical analysis in (C) by one-way ANOVA followed by Tukey's post-test. ns: not significant.
Figure 6
Figure 6
ScDb triggering of PBL lytic machinery. (A) Increased frequency among CD3+/CD8+ and CD3+/CD4+ T lymphocytes of CD107a+ or IFN-γ+ cells after treatment with 0.1 μg/mL scDb in the presence or absence of a melanoma target cell line (Me15) at E:T 5:1. The graphs represent the mean ± SD of three experiments. (B) Surface expression of CD107a and intracellular staining for IFN-γ by flow cytometry in CD3+/CD8+ (left) and CD3+/CD4+ (right) T-cell subsets after treatment with 0.1 μg/mL scDb in the presence or absence of the Me15 melanoma target cell line. (C) Frequency among CD3+/CD8+ (left graphs) and CD3+/CD4+ (right graphs) T lymphocytes of perforin, granzyme B and Ki-67 expression, after treatment with 0.1 μg/mL scDb in the presence or absence of a melanoma target cell line (Me15) at E:T 5:1. The graphs represent the mean ± SD of three experiments. Statistical analysis in (A,C) by one-way ANOVA followed by Tukey's post-test. *p < 0.05, **p < 0.01, ***p < 0.001; ns: not significant.
Figure 7
Figure 7
Treatment of ex vivo cells derived from ovarian cancer patients. (A) Primary ovarian carcinoma cytotoxicity assay after 4 and 16 h of treatment with TRAIL-R2xCD3 or Mec14xCD3 scDbs and pre-activated healthy donors' PBLs. 09ST and 10ST: short-term ovarian cancer cell lines established from biopsies; 13A, 15A, and 16A: cells isolated from ascitic fluid of ovarian cancer patients. The graphs show the percentage of direct cell lysis as the mean ± SD of three wells for treatment. Statistical analysis by one-way ANOVA followed by Tukey's post-test. ***p < 0.001; ns: not significant. (B) Representative staining for CD45 and EpCAM (left) and TRAIL-R2 expression in EpCAM+ tumor cells (right) in an ascitic fluid from an ovarian cancer patient. (C) Flow cytometry expression of the surface activation markers CD107a and CD137 on CD8+ (left) and CD4+ (right) T lymphocytes of ascites samples from three ovarian cancer patients, treated or not with scDb (0.5 μg/mL, 18 h). (D) Annexin-V/propidium iodide apoptosis assay of tumor cells (EpCAM+/CD45) treated or not with 0.5 μg/mL scDb for 48 h. Statistical analysis by Student T-test. *p < 0.05. (E) Annexin-V/propidium iodide apoptosis assay on CD8+ T cells treated as in (D).

References

    1. Lim WA, June CH. The principles of engineering immune cells to treat cancer. Cell. (2017) 168:724–40. 10.1016/j.cell.2017.01.016 - DOI - PMC - PubMed
    1. Pardoll DM. The blockade of immune checkpoints in cancer immunotherapy. Nat Rev Cancer. (2012) 12:252–64. 10.1038/nrc3239 - DOI - PMC - PubMed
    1. Satta A, Mezzanzanica D, Turatti F, Canevari S, Figini M. Redirection of T-cell effector functions for cancer therapy: bispecific antibodies and chimeric antigen receptors. Future Oncol. (2013) 9:527–39. 10.2217/fon.12.203 - DOI - PubMed
    1. Daniels RA, Turley H, Kimberley FC, Liu XS, Mongkolsapaya J, Ch'En P, et al. . Expression of TRAIL and TRAIL receptors in normal and malignant tissues. Cell Res. (2005) 15:430–8. 10.1038/sj.cr.7290311 - DOI - PubMed
    1. Prasad S, Kim JH, Gupta SC, Aggarwal BB. Targeting death receptors for TRAIL by agents designed by mother nature. Trends Pharmacol Sci. (2014) 35:520–36. 10.1016/j.tips.2014.07.004 - DOI - PubMed

Publication types

Substances