

Landscape of Loci and Candidate Genes for Muscle Fatty Acid Composition in Pigs Revealed by Multiple Population Association Analysis
- PMID: 31708975
- PMCID: PMC6824322
- DOI: 10.3389/fgene.2019.01067
Landscape of Loci and Candidate Genes for Muscle Fatty Acid Composition in Pigs Revealed by Multiple Population Association Analysis
Abstract
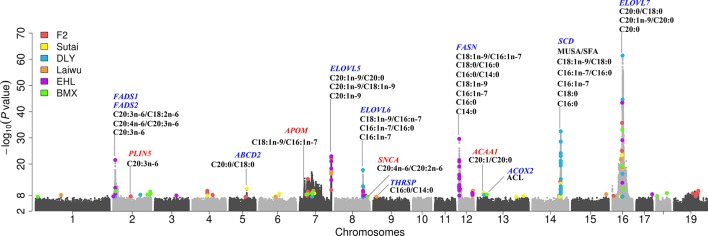
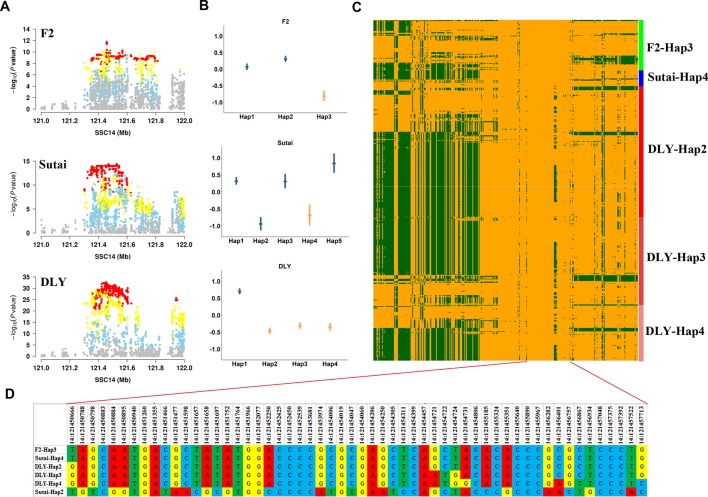
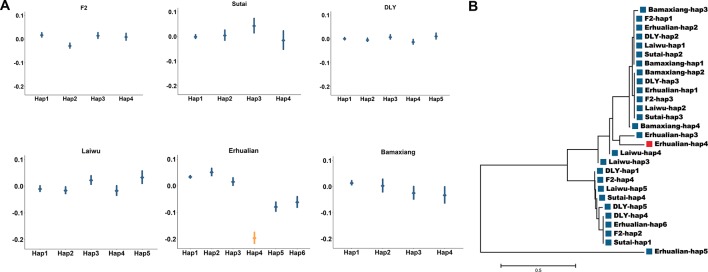
Genome wide association analyses in diverse populations can identify complex trait loci that are specifically present in one population or shared across multiple populations, which help to better understand the genetic architecture of complex traits in a broader genetic context. In this study, we conducted genome-wide association studies and meta-analysis for 38 fatty acid composition traits with 12-19 million imputed genome sequence SNPs in 2446 pigs from six populations, encompassing White Duroc × Erhualian F2, Sutai, Duroc-Landrace-Yorkshire (DLY) three-way cross, Laiwu, Erhualian, and Bamaxiang pigs that were originally genotyped with 60 K or 1.4 million single nucleotide polymorphism (SNP) chips. The analyses uncovered 285 lead SNPs (P < 5 × 10⁻⁸), among which 78 locate more than 1 Mb to the lead chip SNPs were considered as novel, largely augmented the landscape of loci for porcine muscle fatty acid composition. Meta-analysis enhanced the association significance at loci near FADS2, ABCD2, ELOVL5, ELOVL6, ELOVL7, SCD, and THRSP genes, suggesting possible existence of population shared mutations underlying these loci. Further haplotype analysis at SCD loci identified a shared 3.7 kb haplotype in F2, Sutai and DLY pigs showing consistent effects of decreasing C18:0 contents in the three populations. In contrast, at FASN loci, we found an Erhualian specific haplotype explaining the population specific association signals in Erhualian pigs. This study refines our understanding on landscape of loci and candidate genes for fatty acid composition traits of pigs.
Keywords: fatty acid composition; genome-wide association studies; meta-analysis; pig; sequence imputation.
Copyright © 2019 Zhang, Zhang, Gong, Cui, Ma, Chen, Ai, Xiao, Huang and Yang.
Figures
Similar articles
-
Genome-wide association analyses for meat quality traits in Chinese Erhualian pigs and a Western Duroc × (Landrace × Yorkshire) commercial population.Genet Sel Evol. 2015 May 12;47(1):44. doi: 10.1186/s12711-015-0120-x. Genet Sel Evol. 2015. PMID: 25962760 Free PMC article.
-
Genetic mapping using 1.4M SNP array refined loci for fatty acid composition traits in Chinese Erhualian and Bamaxiang pigs.J Anim Breed Genet. 2017 Dec;134(6):472-483. doi: 10.1111/jbg.12297. Epub 2017 Sep 20. J Anim Breed Genet. 2017. PMID: 28940847
-
Genome-wide detection of genetic markers associated with growth and fatness in four pig populations using four approaches.Genet Sel Evol. 2017 Feb 14;49(1):21. doi: 10.1186/s12711-017-0295-4. Genet Sel Evol. 2017. PMID: 28196480 Free PMC article.
-
Genome-wide association analyses for fatty acid composition in porcine muscle and abdominal fat tissues.PLoS One. 2013 Jun 7;8(6):e65554. doi: 10.1371/journal.pone.0065554. Print 2013. PLoS One. 2013. PMID: 23762394 Free PMC article.
-
Evaluation of the causality of the low-density lipoprotein receptor gene (LDLR) for serum lipids in pigs.Anim Genet. 2014 Oct;45(5):665-73. doi: 10.1111/age.12183. Epub 2014 Jun 21. Anim Genet. 2014. PMID: 24954195
Cited by
-
Genome-Wide Association Studies of Hair Whorl in Pigs.Genes (Basel). 2024 Sep 25;15(10):1249. doi: 10.3390/genes15101249. Genes (Basel). 2024. PMID: 39457372 Free PMC article.
-
A composite strategy of genome-wide association study and copy number variation analysis for carcass traits in a Duroc pig population.BMC Genomics. 2022 Aug 13;23(1):590. doi: 10.1186/s12864-022-08804-1. BMC Genomics. 2022. PMID: 35964005 Free PMC article.
-
Weighted Single-Step GWAS Identified Candidate Genes Associated with Growth Traits in a Duroc Pig Population.Genes (Basel). 2021 Jan 19;12(1):117. doi: 10.3390/genes12010117. Genes (Basel). 2021. PMID: 33477978 Free PMC article.
-
Construction of a transposase accessible chromatin landscape reveals chromatin state of repeat elements and potential causal variant for complex traits in pigs.J Anim Sci Biotechnol. 2022 Oct 11;13(1):112. doi: 10.1186/s40104-022-00767-3. J Anim Sci Biotechnol. 2022. PMID: 36217153 Free PMC article.
-
Candidate genes associated with fatty acid compositions in north American Atlantic salmon (Salmo salar).BMC Genomics. 2024 Dec 18;25(1):1208. doi: 10.1186/s12864-024-11131-2. BMC Genomics. 2024. PMID: 39695999 Free PMC article.
References
-
- Bouwman A. C., Daetwyler H. D., Chamberlain A. J., Ponce C. H., Sargolzaei M., Schenkel F. S., et al. (2018). Meta-analysis of genome-wide association studies for cattle stature identifies common genes that regulate body size in mammals. Nat. Genet. 50 (3), 362–367. 10.1038/s41588-018-0056-5 - DOI - PubMed
-
- Cameron N. D., Enser M., Nute G. R., Whittington F. M., Penman J. C., Fisken A. C., et al. (2000). Genotype with nutrition interaction on fatty acid composition of intramuscular fat and the relationship with flavour of pig meat. Meat Sci. 55 (2), 187–195. 10.1016/S0309-1740(99)00142-4 - DOI - PubMed
Associated data
LinkOut - more resources
Full Text Sources
Miscellaneous