. 2019 Sep 5;6(Pt 6):1024-1031.
doi: 10.1107/S2052252519011345. eCollection 2019 Nov 1.

A cryo-EM grid preparation device for time-resolved structural studies

Affiliations

A cryo-EM grid preparation device for time-resolved structural studies

Dimitrios Kontziampasis et al. IUCrJ. .

Abstract

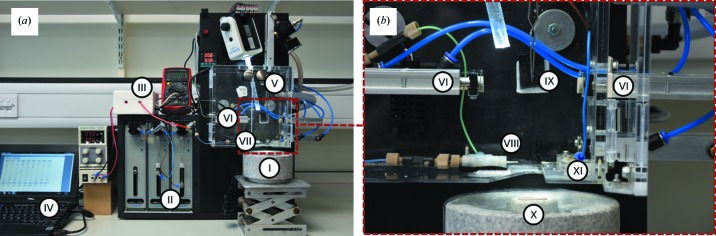
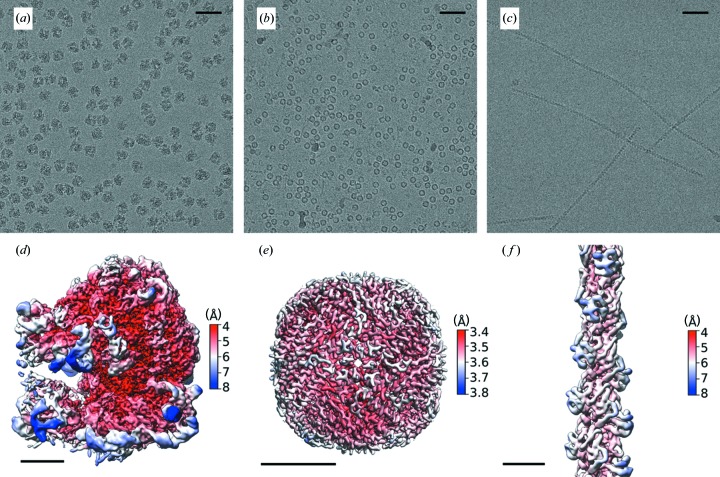
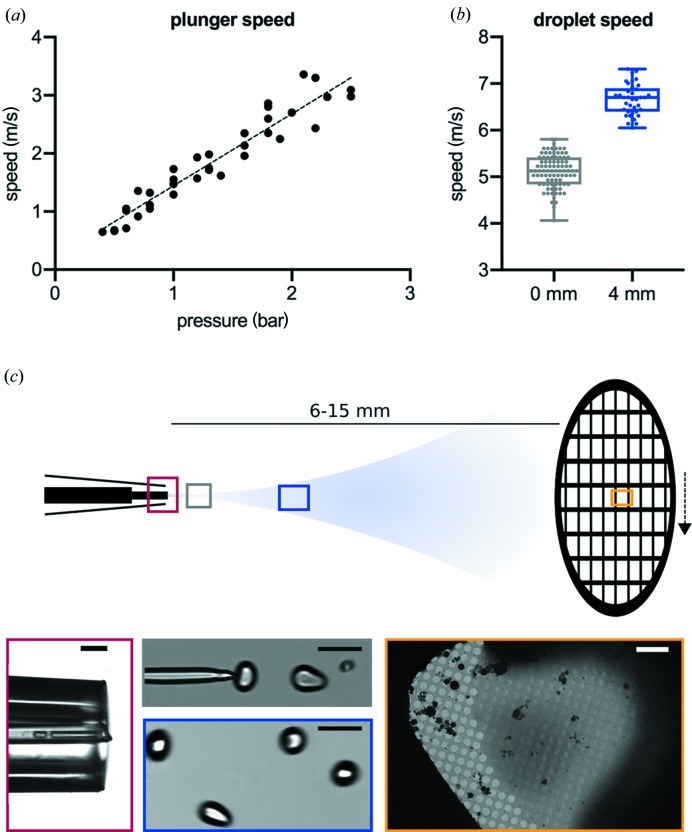
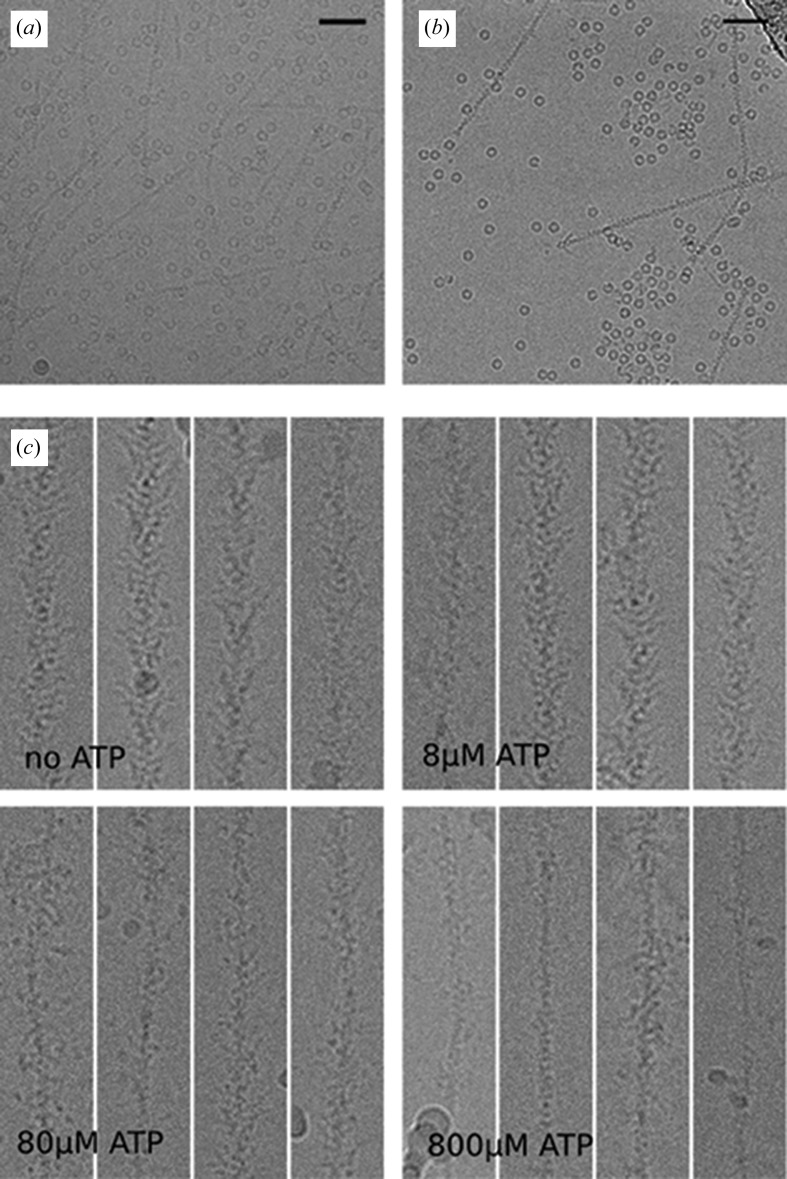
Structural biology generally provides static snapshots of protein conformations that can provide information on the functional mechanisms of biological systems. Time-resolved structural biology provides a means to visualize, at near-atomic resolution, the dynamic conformational changes that macromolecules undergo as they function. X-ray free-electron-laser technology has provided a powerful tool to study enzyme mechanisms at atomic resolution, typically in the femtosecond to picosecond timeframe. Complementary to this, recent advances in the resolution obtainable by electron microscopy and the broad range of samples that can be studied make it ideally suited to time-resolved approaches in the microsecond to millisecond timeframe to study large loop and domain motions in biomolecules. Here we describe a cryo-EM grid preparation device that permits rapid mixing, voltage-assisted spraying and vitrification of samples. It is shown that the device produces grids of sufficient ice quality to enable data collection from single grids that results in a sub-4 Å reconstruction. Rapid mixing can be achieved by blot-and-spray or mix-and-spray approaches with a delay of ∼10 ms, providing greater temporal resolution than previously reported mix-and-spray approaches.

Keywords: microscope hardware; sample preparation; structural biology; time-resolved cryo-EM; voltage-assisted spraying.


Figures

Figure 1
Figure 1
Current setup of the TrEM apparatus. (a) Overview of the complete apparatus showing the Styrofoam freezing cup which houses the liquid ethane (I), syringe pumps (II), high-tension voltage module (III), computer controller (IV), forceps on plunger (V), blotting arms (VI) and sprayer (VII). (b) Zoomed-in view of the spray chamber showing the spray nozzle (VIII), blotting arms (VI), forceps with grid (IX), ethane cup within the Styrofoam liquid nitro­gen holder (X), and a port that opens just prior to the grid plunge and limits the exposure of the liquid ethane to the humid air in the chamber (XI).
Figure 2
Figure 2
Structures of the three model systems from grids prepared on the TrEM setup. To test our ability to make high-quality EM grids by spraying proteins on a fast-moving plunging grid, three samples were tested and data are shown with representative micrographs and 3D reconstructions: (a, d) E. coli ribosome (0.72 µM in 50 mM HEPES pH 7.5, 100 mM KAc, 8 mM MgAc2), (b, e) apoferritin [30 µM (24-mer) in 20 mM HEPES pH 7.5, 150 mM NaCl], and (c, f) porcine thin filaments [5 µM (actin monomer) in 10 mM MOPS pH 7, 50 mM KAc, 3 mM MgCl2, 1 mM EGTA]. The scale bars in (a), (b) and (c) represents 50 nm. The scale bars in (d), (e) and (f) represents 5 nm.
Figure 3
Figure 3
Measuring plunger and droplet speeds. (a) The relationship between pressure and plunger speed, linear fit: speed (m s−1) = ∼1.5 × pressure (bar). (b) A boxplot of droplet speeds with ten different droplets tracked over at least three frames for each position, measured at the spray tip (0 mm) and at a distance of 4 mm. (c) Microscopic images of the spray tip (red, scale bar 200 µm), the breakup point of the liquid jet (grey, scale bar 100 µm), 4 mm away from the capillary tip (blue, scale bar 100 µm) and a grid square of a vitrified grid in the electron microscope (yellow, scale bar 10 µm).
Figure 4
Figure 4
Rapid mixing of samples on the TrEM setup. (a) Representative micrograph with thin filaments blotted and apoferritin sprayed on the subsequent plunged grid. (b) Representative micrograph from the rapid mixing of apoferritin and thin filaments, and direct spraying onto the EM grid. (c) Four representative images of myosin S1 decorated filaments after the rapid mixing (∼15 ms) of 0, 8, 80 and 800 µM MgATP showing decoration consistent with that predicted by kinetic modelling (0, 10, 70 and 99%, respectively).

References

    1. Berriman, J. & Unwin, N. (1994). Ultramicroscopy, 56, 241–252. - PubMed
    1. Blundell, T. L. (2017). IUCrJ, 4, 308–321. - PMC - PubMed
    1. Dandey, V. P., Wei, H., Zhang, Z., Tan, Y. Z., Acharya, P., Eng, E. T., Rice, W. J., Kahn, P. A., Potter, C. S. & Carragher, B. (2018). J. Struct. Biol. 202, 161–169. - PMC - PubMed
    1. D’Imprima, E., Floris, D., Joppe, M., Sánchez, R., Grininger, M. & Kühlbrandt, W. (2019). eLife, 8, e42747. - PMC - PubMed
    1. Feng, X., Fu, Z., Kaledhonkar, S., Jia, Y., Shah, B., Jin, A., Liu, Z., Sun, M., Chen, B., Grassucci, R. A., Ren, Y., Jiang, H., Frank, J. & Lin, Q. (2017). Structure, 25, 663–670.e3. - PMC - PubMed