. 2019 Oct 25:7:248.
doi: 10.3389/fcell.2019.00248. eCollection 2019.

Fatty Liver Due to Increased de novo Lipogenesis: Alterations in the Hepatic Peroxisomal Proteome

Affiliations

Fatty Liver Due to Increased de novo Lipogenesis: Alterations in the Hepatic Peroxisomal Proteome

Birgit Knebel et al. Front Cell Dev Biol. .

Abstract

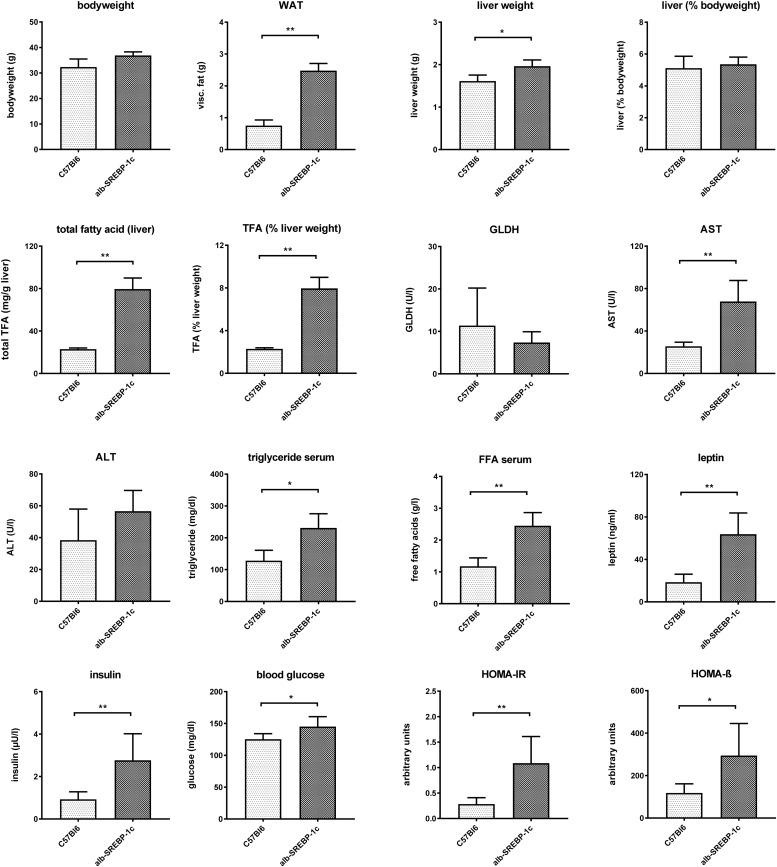
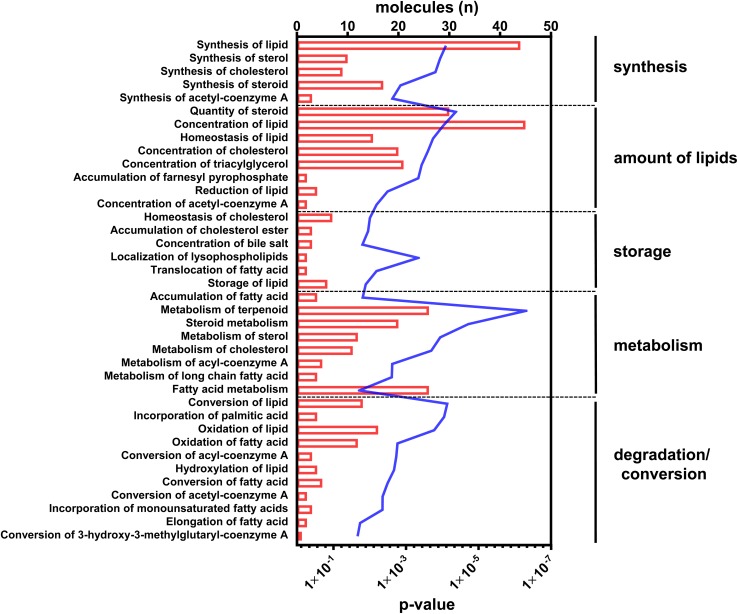
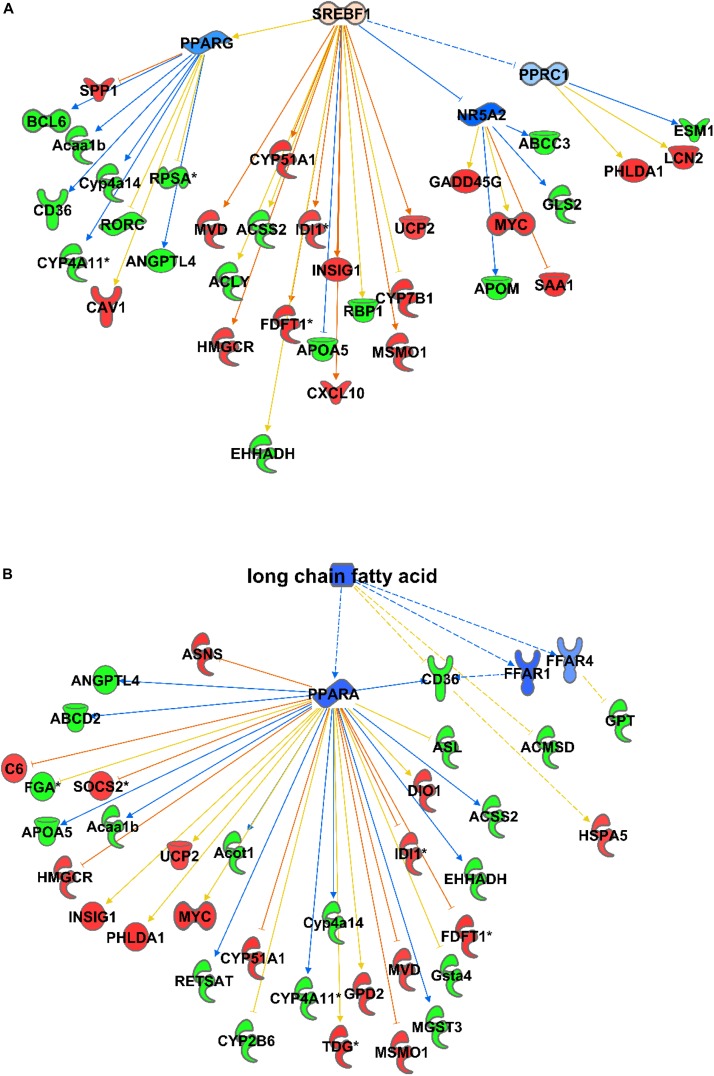
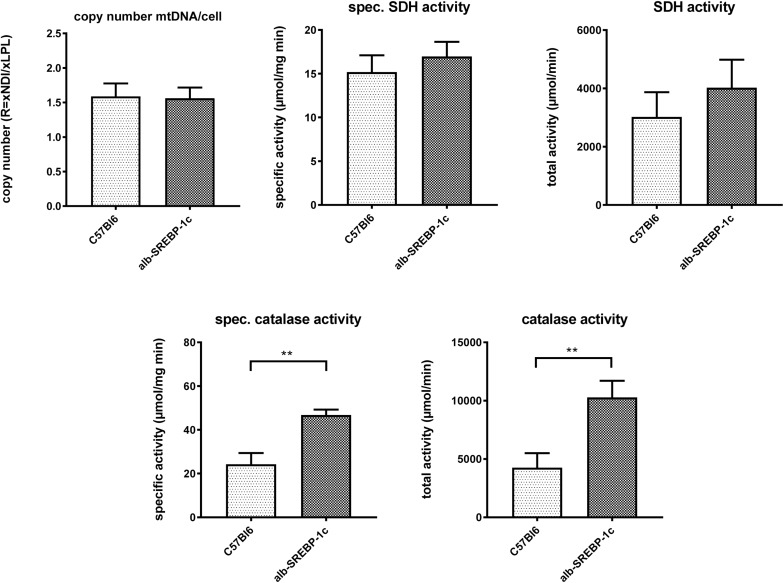
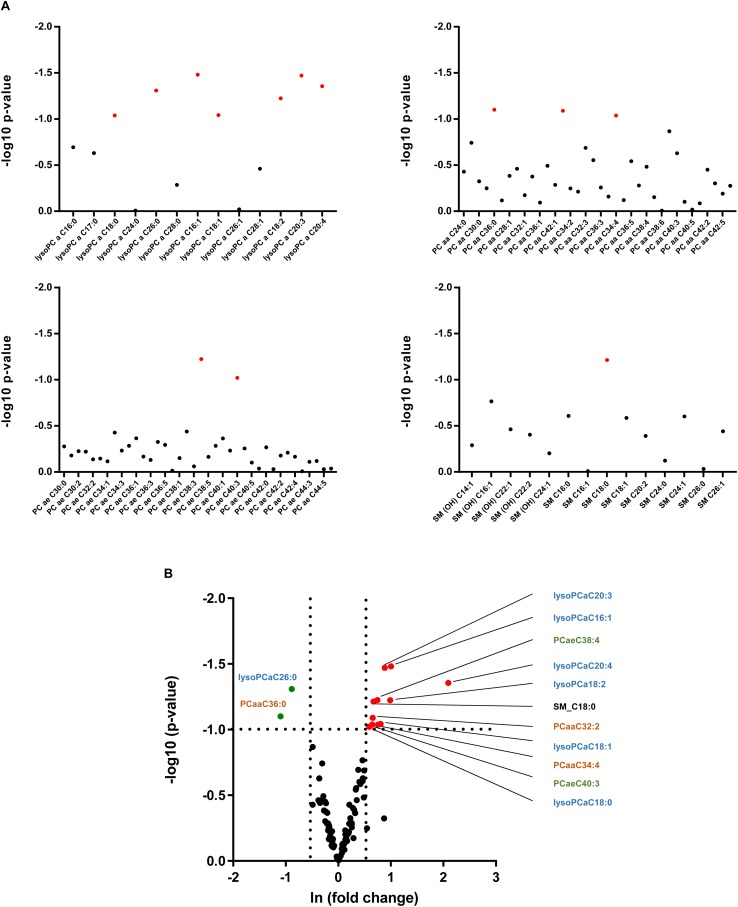
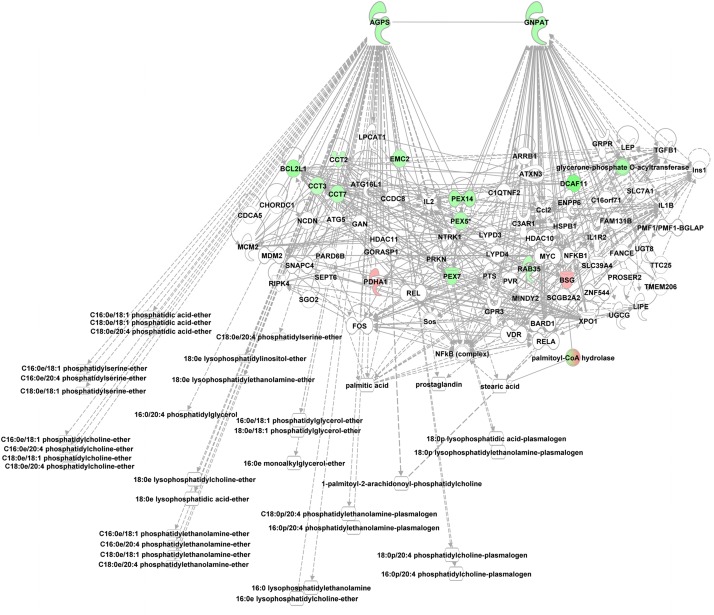
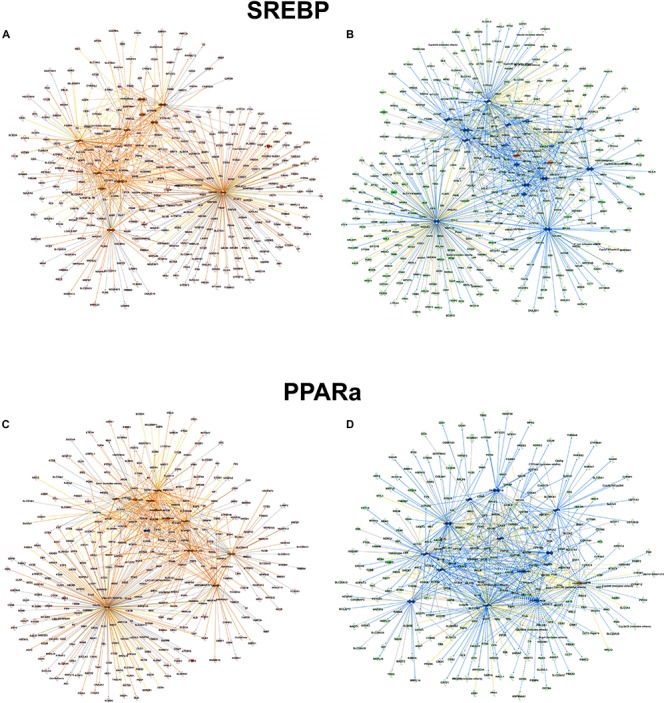
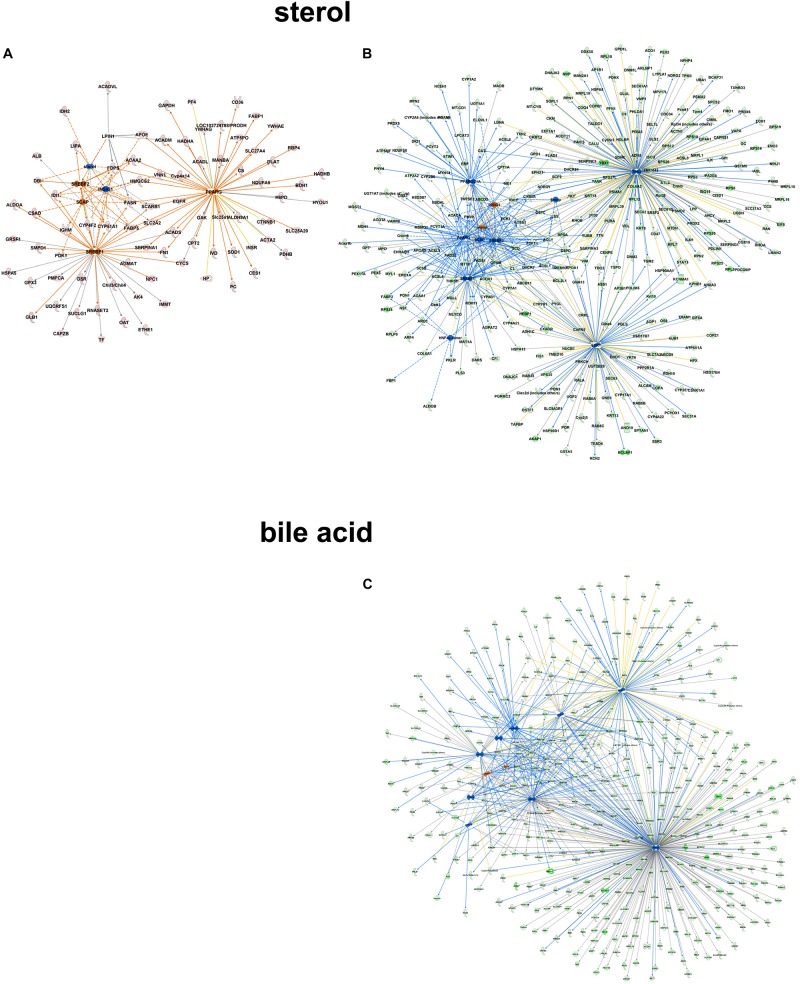
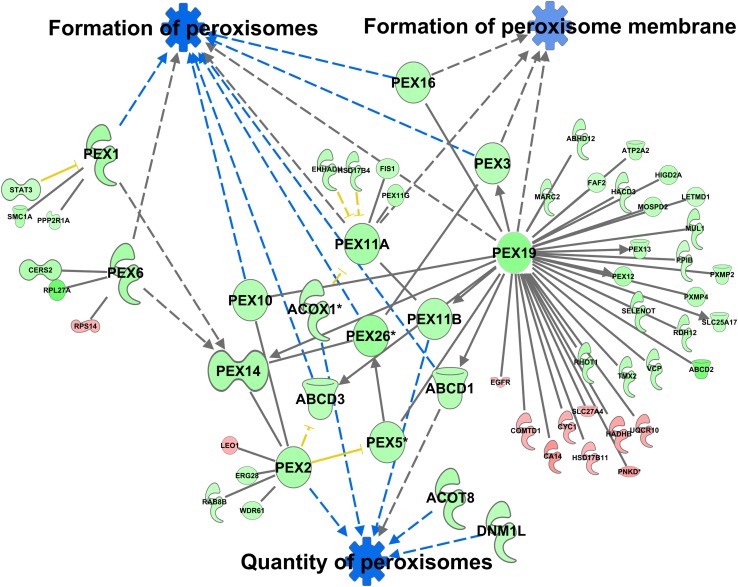
In non-alcoholic fatty liver disease (NAFLD) caused by ectopic lipid accumulation, lipotoxicity is a crucial molecular risk factor. Mechanisms to eliminate lipid overflow can prevent the liver from functional complications. This may involve increased secretion of lipids or metabolic adaptation to ß-oxidation in lipid-degrading organelles such as mitochondria and peroxisomes. In addition to dietary factors, increased plasma fatty acid levels may be due to increased triglyceride synthesis, lipolysis, as well as de novo lipid synthesis (DNL) in the liver. In the present study, we investigated the impact of fatty liver caused by elevated DNL, in a transgenic mouse model with liver-specific overexpression of human sterol regulatory element-binding protein-1c (alb-SREBP-1c), on hepatic gene expression, on plasma lipids and especially on the proteome of peroxisomes by omics analyses, and we interpreted the results with knowledge-based analyses. In summary, the increased hepatic DNL is accompanied by marginal gene expression changes but massive changes in peroxisomal proteome. Furthermore, plasma phosphatidylcholine (PC) as well as lysoPC species were altered. Based on these observations, it can be speculated that the plasticity of organelles and their functionality may be directly affected by lipid overflow.

Keywords: DNL; NAFLD; SREBP-1c; fatty liver; label-free proteomic profiling; lipidomics; peroxisomes; transcriptomics.


Figures

FIGURE 1
FIGURE 1
Metabolic characterization of C57Bl6 and of alb-SREBP-1c mice at the age of 24 weeks used in the study. Data are expressed as mean ± SD (n = 8 of each phenotype). p < 0.05, ∗∗p < 0.01, by Student’s t-test. Abbreviations: ALT, alanine transaminase; AST, aspartate transaminase; FFA, free fatty acids; GLDH, glutamate dehydrogenase; HOMA-IR, Homeostatic model assessment of insulin resistance; HOMA-ß Homeostatic model assessment of ß-cell function (%); TFA, total fatty acids; WAT, white adipose tissue.
FIGURE 2
FIGURE 2
Canonical pathways annotated to lipid metabolism. Differential abundant transcripts in the comparisons of C57Bl6 and alb-SREBP-1c mice were subjected to knowledge-based analyses using IPA®. The bars indicate the number of differential abundant transcripts in the dataset associated to the respective pathway. The line indicates the significance of overlap to the respective pathway by Log10 transformed p-value. Analyses including statistics were performed in IPA® using the Core expression analyses routine.
FIGURE 3
FIGURE 3
Causal networks for differences in gene expression. Differential abundant transcripts in the comparisons of C57Bl6 and alb-SREBP-1c mice were subjected to knowledge-based analyses using IPA® to identify causal networks. SREBP-1 (A) and long chain fatty acids (B) were identified with high significance. Analyses were performed in IPA® using the Core expression analyses routine. Color code, according to IPA® analyses, for molecules: green: negative fold change (more abundant in C57Bl6); red: positive fold change (more abundant in alb-SREBP-1c), and for arrows: yellow: findings inconsistent with the state of the downstream molecule; blue: inhibition, consistent with the state of the downstream molecule; orange: increase, consistent with the state of the downstream molecule. Solid arrows indicate a direct interaction, and dotted arrows an indirect interaction, of connected molecules.
FIGURE 4
FIGURE 4
Mitochondrial DNA contend and marker enzyme activity of mitochondria and peroxisomes. The mtDNA content was determined in comparison to gDNA in C57Bl6 and alb-SREBP-1c mice (n = 20). Specific enzyme activities per mg liver tissue and total enzyme activities of mitochondrial succinate dehydrogenase (SDH) and peroxisomal catalase were determined in liver homogenates C57Bl6 and alb-SREBP-1c mice (n = 20) (n.s., not significant, ∗∗p < 0.01).
FIGURE 5
FIGURE 5
Hepatic lipid composition of C57Bl6 and alb-SREBP-1c mice at the age of 24 weeks. (A) Fractional composition of liver TFAs and %-change within C57Bl6 and alb-SREBP-1c mice. (B) From the hepatic lipid composition, the sums of non-saturated FA, non-essential FA (C16:0 + cC16:1 + C18:0 + cC18:1), monounsaturated FA, polyunsaturated FA, saturated FA, essential FA [cC18:2 + cC18:3) or elongation index (C18:0/C16:0)], de novo lipogenesis (DNL) index (C16:0/cC18:2), Δ5 desaturase index (cC18:2/cC20:4), Δ6 desaturase index (cC18:3/cC18:2), Δ9 desaturase index (cC16:1/C16:0), and Δ9 desaturase index (cC18:1/C18:0) were calculated. Data are expressed as mean ± SD (n = 8 of each genotype). p < 0.05, ∗∗p < 0.01, ∗∗∗p < 0.01, by Student’s t-test. Abbreviations: DNL, de novo lipogenesis; EFA, essential fatty acids; MUFA, monounsaturated fatty acids; NEFA, non-essential fatty acids; PUFA, polyunsaturated fatty acids; SFA, saturated fatty acids; TFA, total fatty acids; UFA, unsaturated fatty acids.
FIGURE 6
FIGURE 6
Lipid species in the serum of C57Bl6 and alb-SREBP-1 mice. (A) Alterations in individual lipid species in the group of phosphatidylcholines (PC), i.e., lysoPCs, PCaa, PCae, and sphingomyelins are indicated by log 10 p-value. Red dots indicate significant altered lipid species. (B) Differential abundance of lipid species. The fold change [(ln(fold change)] of lipid concentration was plotted against the significance (log 10 p-value). Red dots mark lipid species with >1.5-fold change in alb-SREBP-1c mice, green dots indicate lipid species with >1.5-fold difference in C57Bl6 mice. A p-value of <0.05 (Students’ t-test) was accepted as significant. Chemical residues [hydroxyl (OH), acyl (a), di-acyl (aa), and acyl-alkyl (ae)] are abbreviated accordingly. Nomenclature further indicates Cx:y (x, number of carbons in the fatty acid; y, number of double bonds in the fatty acid).
FIGURE 7
FIGURE 7
Knowledge-based analyses enzymes essential in ether lipid analyses in peroxisomal protein fractions. All proteins identified in peroxisomal fractions of C57Bl6 mice and alb-SREBP-1c mice were subjected to IPA® Core analyses. The networks deduced for upstream regulator molecules glyceronephosphate O-acyltransferase (GNPAT) and alkylglycerone phosphate synthase (AGPS) are shown. Color code, according to IPA analyses, for molecules: green, overrepresented in alb-SREBP-1c (negative fold change in dataset); red: overrepresented in C57Bl6 (positive fold change in dataset). Solid arrows indicate a direct interaction, and dotted arrows an indirect interaction, of connected molecules.
FIGURE 8
FIGURE 8
Upstream regulator molecules in peroxisomal proteins. All proteins identified in the peroxisomal fraction of C57Bl6 mice and alb-SREBP-1c mice were separated, according to overrepresentation in the genotypes, and subjected to IPA® Core analyses. Upstream regulator molecule networks are shown for SREBP in C57Bl6 overrepresented proteins (A), or in alb-SREBP-1c overrepresented proteins (B) and for PPARa in C57Bl6 overrepresented proteins (C), or in alb-SREBP-1c overrepresented proteins (D). Hub molecules for SREBF1 in C57Bl6 mice were cholesterol, SCAP, Insulin, SREBF2, PPARG, PPARA, HIF1A, FOXO1, PPARGC1A, TP53, and RXRA. Hub proteins/molecules for SREBF1 in alb-SREBP-1c mice were SCAP, cholesterol, fatty acid, Ins1, PPARD, NR1H3, PPARG, PPARA, NR0B2, CEBPB, RXRA, SREBF2, NR5A2, NFE2L2, TP53, and PPARGC1A. Hub proteins/molecules for PPARA in C57Bl6 mice were bezafibrate, pirinixic acid, fenofibrate, NR1H4, PPARG, PPARD, NRIP1, RXRA, FOXO1, SREBF1, TP53, PPARGC1A, and NCOA2. Hub proteins/molecules for PPARA in alb-SREBP-1c mice were ciprofibrate, fenofibrate, pirinixic acid, NR1H4, PPARG, PPARD, MED1, NCOA2, NR1H3, FOXO1, RXRA, SREBF1, NR1I3, THRB, and PPARGC1A. Color code, according to IPA® analyses, for molecules: green: overrepresented in alb-SREBP-1c (negative fold change in dataset); red: overrepresented in C57Bl6 (positive fold change in dataset), and for arrows: yellow: findings inconsistent with the state of the downstream molecule; blue: inhibition, consistent with the state of the downstream molecule; orange: increase, consistent with the state of the downstream molecule. Solid arrows indicate a direct interaction, and dotted arrows an indirect interaction, of connected molecules.
FIGURE 9
FIGURE 9
Upstream regulator metabolites in peroxisomal proteins. All proteins identified in peroxisomal fractions of C57Bl6 mice and alb-SREBP-1c mice were separated, according to overrepresentation in the genotypes, and subjected to IPA® Core analyses. Upstream regulator molecule networks are shown for sterol in C57Bl6 overrepresented proteins (A), or in alb-SREBP-1c overrepresented proteins (B), and for bile acid in alb-SREBP-1c overrepresented proteins (C). Upstream regulator molecule networks are shown for sterol (A) and bile acid (B). Hub proteins for sterol in C57Bl6 were PPARG, SCAP, LPIN1, INSIG1, SREBF1, and SREBF2. Hub proteins for sterol in alb-SREBP-1c were: PPARG, SCAP, INSIG1, SREBF1, SREBF2, HNF4α dimer, ESR1, TP53, and PPARGC1A. Hub proteins for bile acid in alb-SREBP-1c were: PPARA, FOXO1, FGF19, NR1H4, NR0B2, HNF4A, MLXIPL, NR5A2, FOXA2, RXRA, HNF1A, and PPARGC1A. Color code, according to IPA® analyses, for molecules: green: overrepresented in alb-SREBP-1c (negative fold change in dataset); red: overrepresented in C57Bl6 (positive fold change in dataset), and for arrows: yellow: findings inconsistent with the state of the downstream molecule; blue: inhibition, consistent with the state of the downstream molecule; orange: increase, consistent with the state of the downstream molecule. Solid arrows indicate a direct interaction, and dotted arrows an indirect interaction, of connected molecules.
FIGURE 10
FIGURE 10
Differential peroxisomal formation deduced from the peroxisomal proteome. Proteins with at least 1.5-fold difference in abundance identified in peroxisomal fractions of C57Bl6 mice and alb-SREBP-1c mice were subjected to IPA® Core analyses. Peroxisomal formation and associated proteins were identified as the downstream function with highest significance. The datasets of peroxisomal proteins enriched in either C57Bl6 or alb-SREBP-1c were screened for interacting proteins of the peroxisomal formation node. Color code, according to IPA® analyses, for molecules: green: overrepresented in alb-SREBP-1c (negative fold change in dataset); red: overrepresented in C57Bl6 (positive fold change in dataset), and for arrows: yellow: findings inconsistent with the state of the downstream molecule; blue: inhibition, consistent with the state of the downstream molecule. Solid arrows indicate a direct interaction, and dotted arrows an indirect interaction, of connected molecules. Molecules not in direct connection to the downstream functions are shown in reduced size.

References

    1. Agrawal G., Shang H. H., Xia Z. J., Subramani S. (2017). Functional regions of the peroxin Pex19 necessary for peroxisome biogenesis. J. Biol. Chem. 292 11547–11560. 10.1074/jbc.M116.774067 - DOI - PMC - PubMed
    1. Bartz R., Li W. H., Venables B., Zehmer J. K., Roth M. R., Welti R. (2007). Lipidomics reveals that adiposomes store ether lipids and mediate phospholipid traffic. J. Lipid Res. 48 837–847. 10.1194/jlr.m600413-jlr200 - DOI - PubMed
    1. Binns D., Januszewski T., Chen Y., Hill J., Markin V. S., Zhao Y. M. (2006). An intimate collaboration between peroxisomes and lipid bodies. J. Cell Biol. 173 719–731. 10.1083/jcb.200511125 - DOI - PMC - PubMed
    1. Brown M. S., Goldstein J. L. (2009). Cholesterol feedback: from Schoenheimer’s bottle to Scap’s MELADL. J. Lipid Res. 50 15–27. 10.1194/jlr.R800054-JLR200 - DOI - PMC - PubMed
    1. Chakravarthy M. V., Lodhi I. J., Yin L., Malapaka R. R., Xu H. E., Turk J., et al. (2009). Identification of a physiologically relevant endogenous ligand for PPARalpha in liver. Cell 138 476–488. 10.1016/j.cell.2009.05.036 - DOI - PMC - PubMed